5-11
1.
Trophies
Plaques
Total
Direct materials
Forming
$13,000
$11,250
Assembly
2,600
9,375
Total
15,600
20,625
Direct Labor
Forming
15,600
9,000
Assembly
7,800
10,500
Total
23,400
19,500
Total direct costs
$39,000
$40,125
$79,125
Budgeted
overhead rate
=
($12,000 $10,386 $23,000 $10,960) $56,346
$79,125 $79,125
+ + + =
=
$0.712114
per dollar of direct cost
Trophies
Plaques
Total
Direct materials
$15,600
$20,625
$ 36,225
Direct labor
23,400
19,500
42,900
Total direct cost
39,000
40,125
79,125
Allocated overhead*
27,772
28,574
56,346
Total costs
$66,772
$68,699
$135,471
*Allocated overhead = Total direct cost Budgeted overhead rate (0.712114).
2.
Budgeted
overhead rate
Forming Dept.
—
=
Budgeted Forming Department overhead costs
Budgeted Forming Department direct-labor costs
=
$12,000 $10,386
$15,600 $9,000
+
+
=
$22,386
$24,600 =
$0.91 per Forming Department direct-labor dollar
Budgeted
overhead rate
Assembly Dept.
—
=
Budgeted Assembly Department overhead costs
Budgeted Assembly Department direct costs
=
$23,000 $10,960
($2,600 $9,375 $7,800 $10,500)
+
+ + +
=
$33,960
$30,275 =
$1.121718 per Assembly Department direct cost dollar
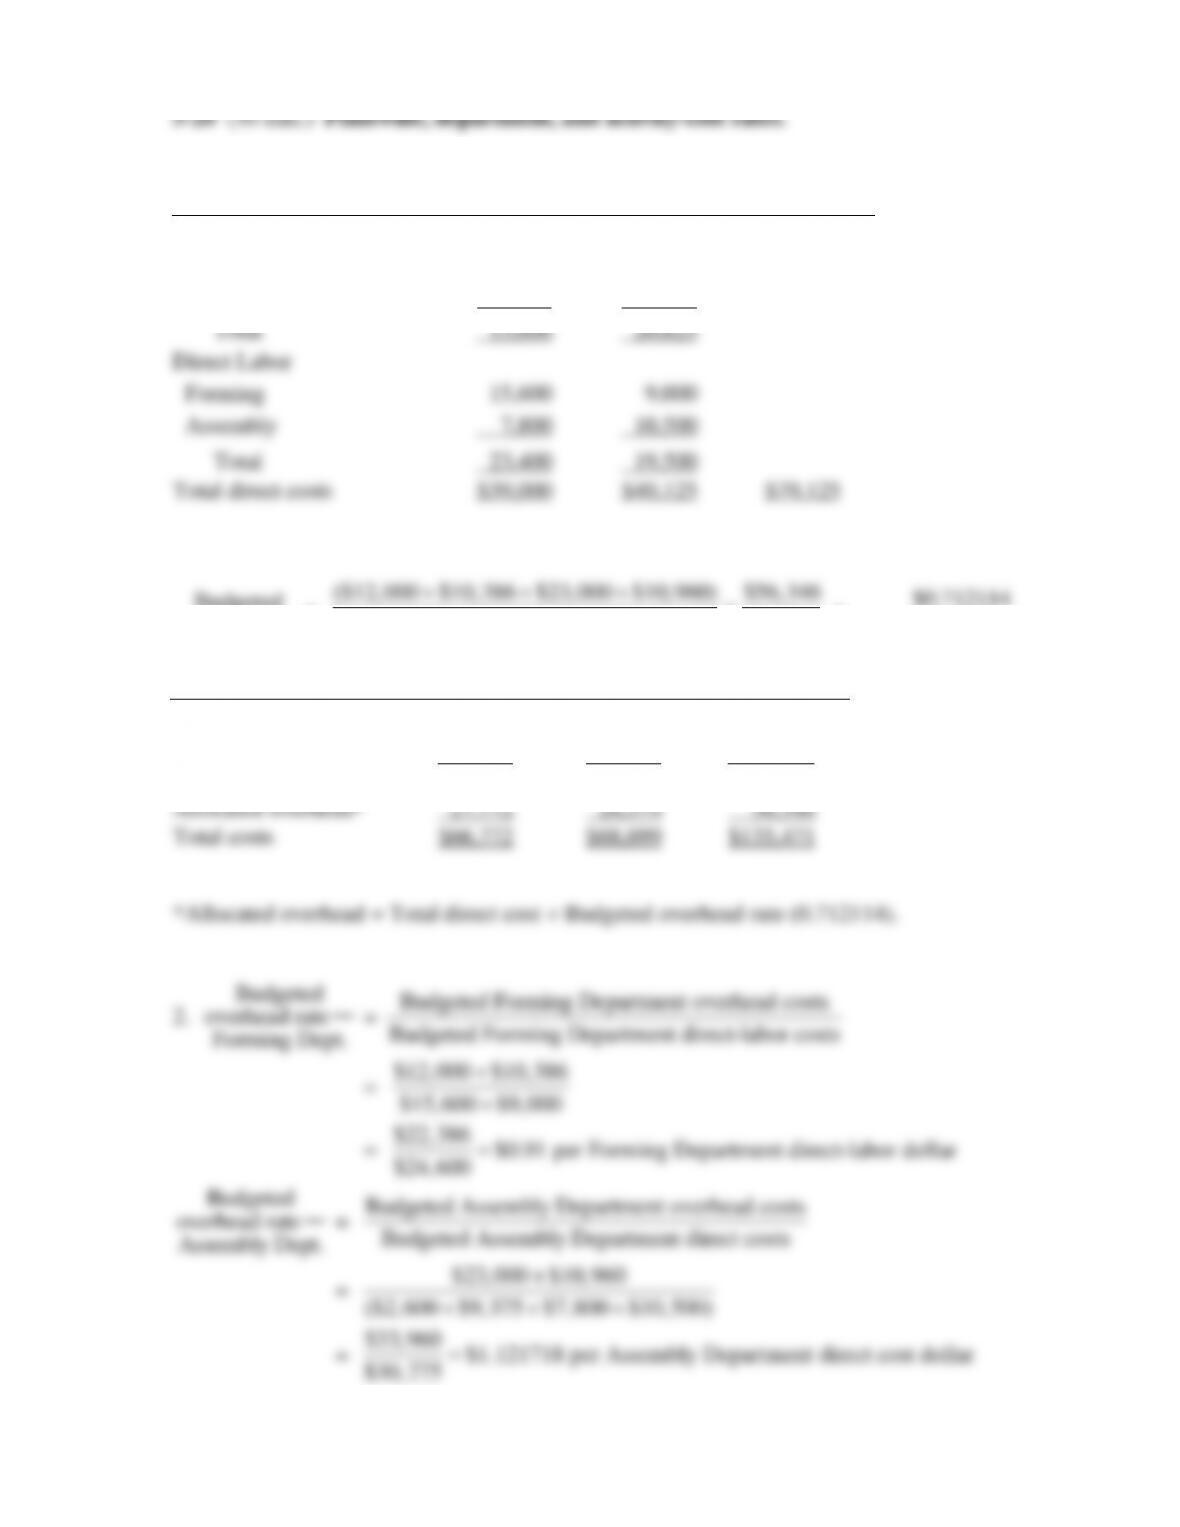
5-12
Trophies
Plaques
Total
Direct materials
$15,600
$20,625
$ 36,225
Direct labor
23,400
19,500
42,900
Total direct cost
39,000
40,125
79,125
Allocated overhead
Forming Dept.a
14,196
8,190
22,386
Assembly Dept.b
11,666
22,294
33,960
Total costs
$64,862
$70,609
$135,471
3.
Trophies
Plaques
Total
a Forming Dept.
Direct labor costs
$15,600
$ 9,000
$24,600
Allocated overhead
(0.91 × $15,600; $9,000)
$14,196
$ 8,190
$22,386
b Assembly Dept.
Total direct costs
($2,600 + $7,800; $9,375 + $10,500)
$10,400
$19,875
$30,275
Allocated overhead
(1.121718 $10,400; $19,875)
$11,666
$22,294
$33,960
Forming Department
Budgeted setup rate
=
$12,000
156 batches
= $76.92308 per batch
$18,300
5-13
Trophies
Plaques
Total
Direct material costs
$15,600
$20,625
$36,225
Direct labor costs
23,400
19,500
42,900
Total direct costs
39,000
40,125
79,125
Forming Dept. overhead
Set up
$76.92308 40; 116
3,077
8,923
12,000
Supervision
0.422195
$15,600; $9,000
6,586
3,800
10,386
Assembly Department overhead
Set up
$157.5342
43; 103
6,774
16,226
23,000
Supervision
0.598907
$7,800; $10,500
4,671
6,289
10,960
Total costs
$60,108
$75,363
$135,471
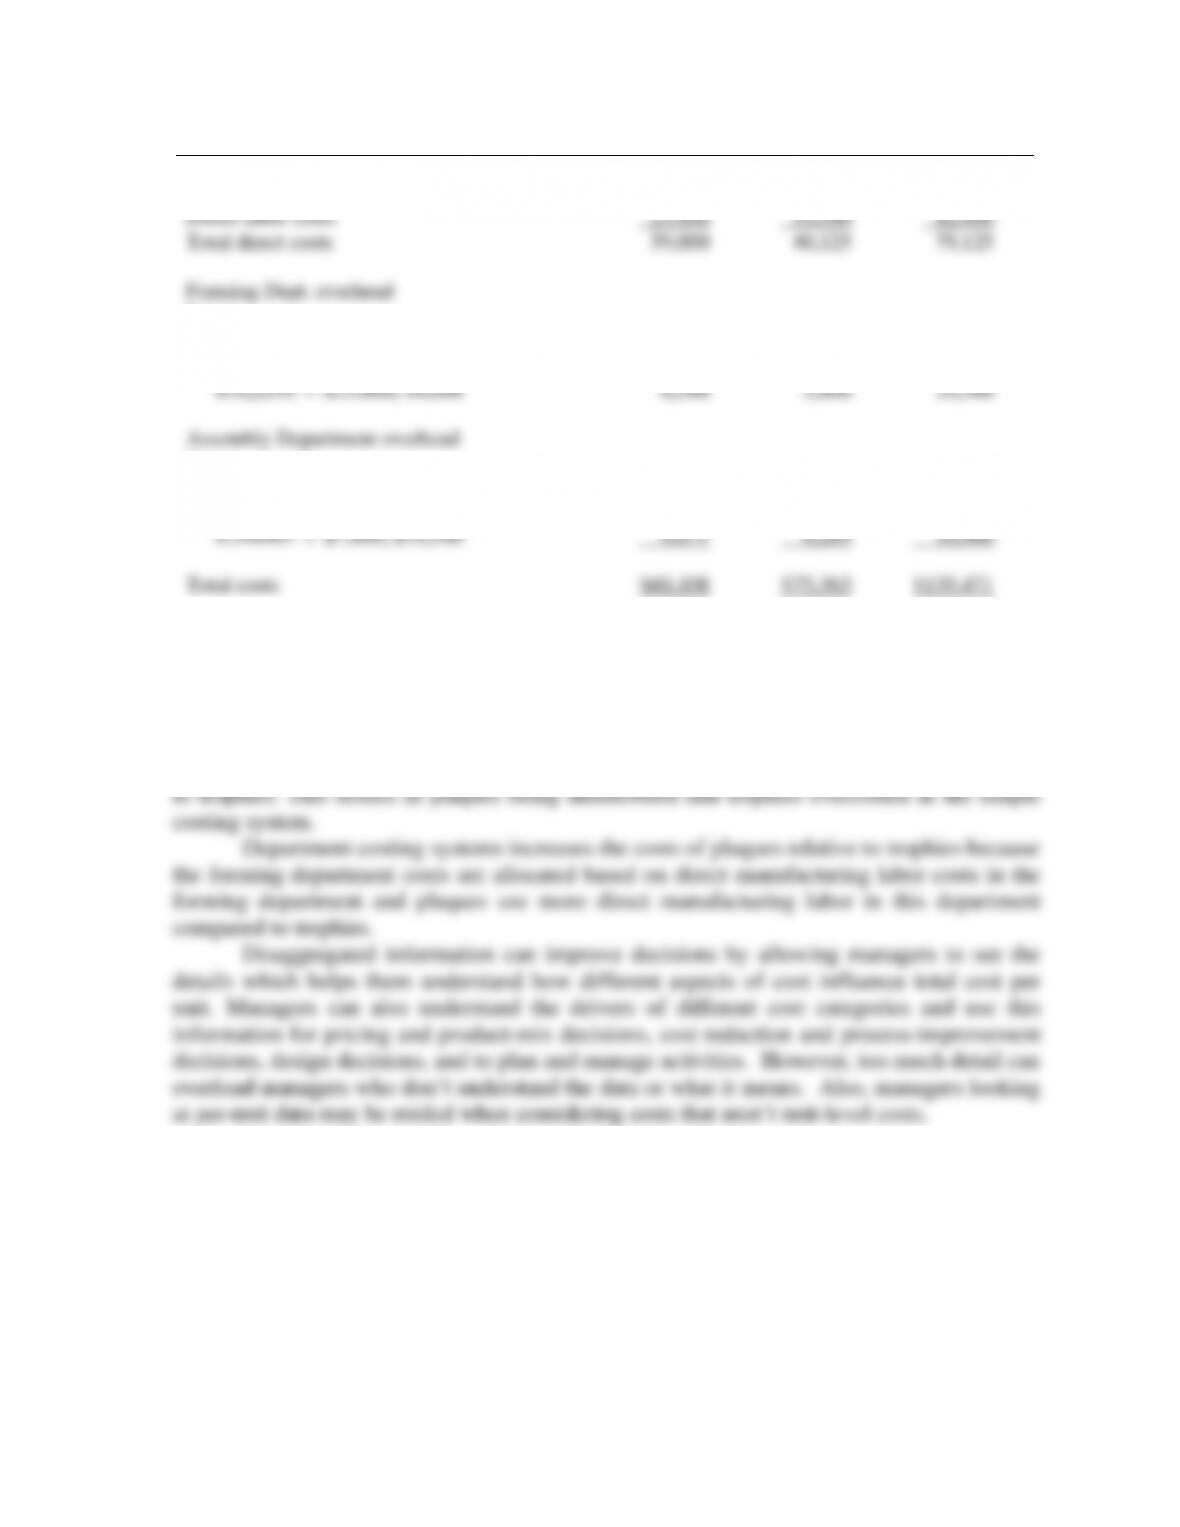
4. Tarquin uses more refined cost pools the costs of trophies decreases and costs of
plaques increases. This is because plaques use a higher proportion of cost drivers (batches of
set ups and direct manufacturing labor costs) than trophies whereas the direct costs (the
allocation base used in the simple costing system) are slightly smaller for plaques compared
5-14
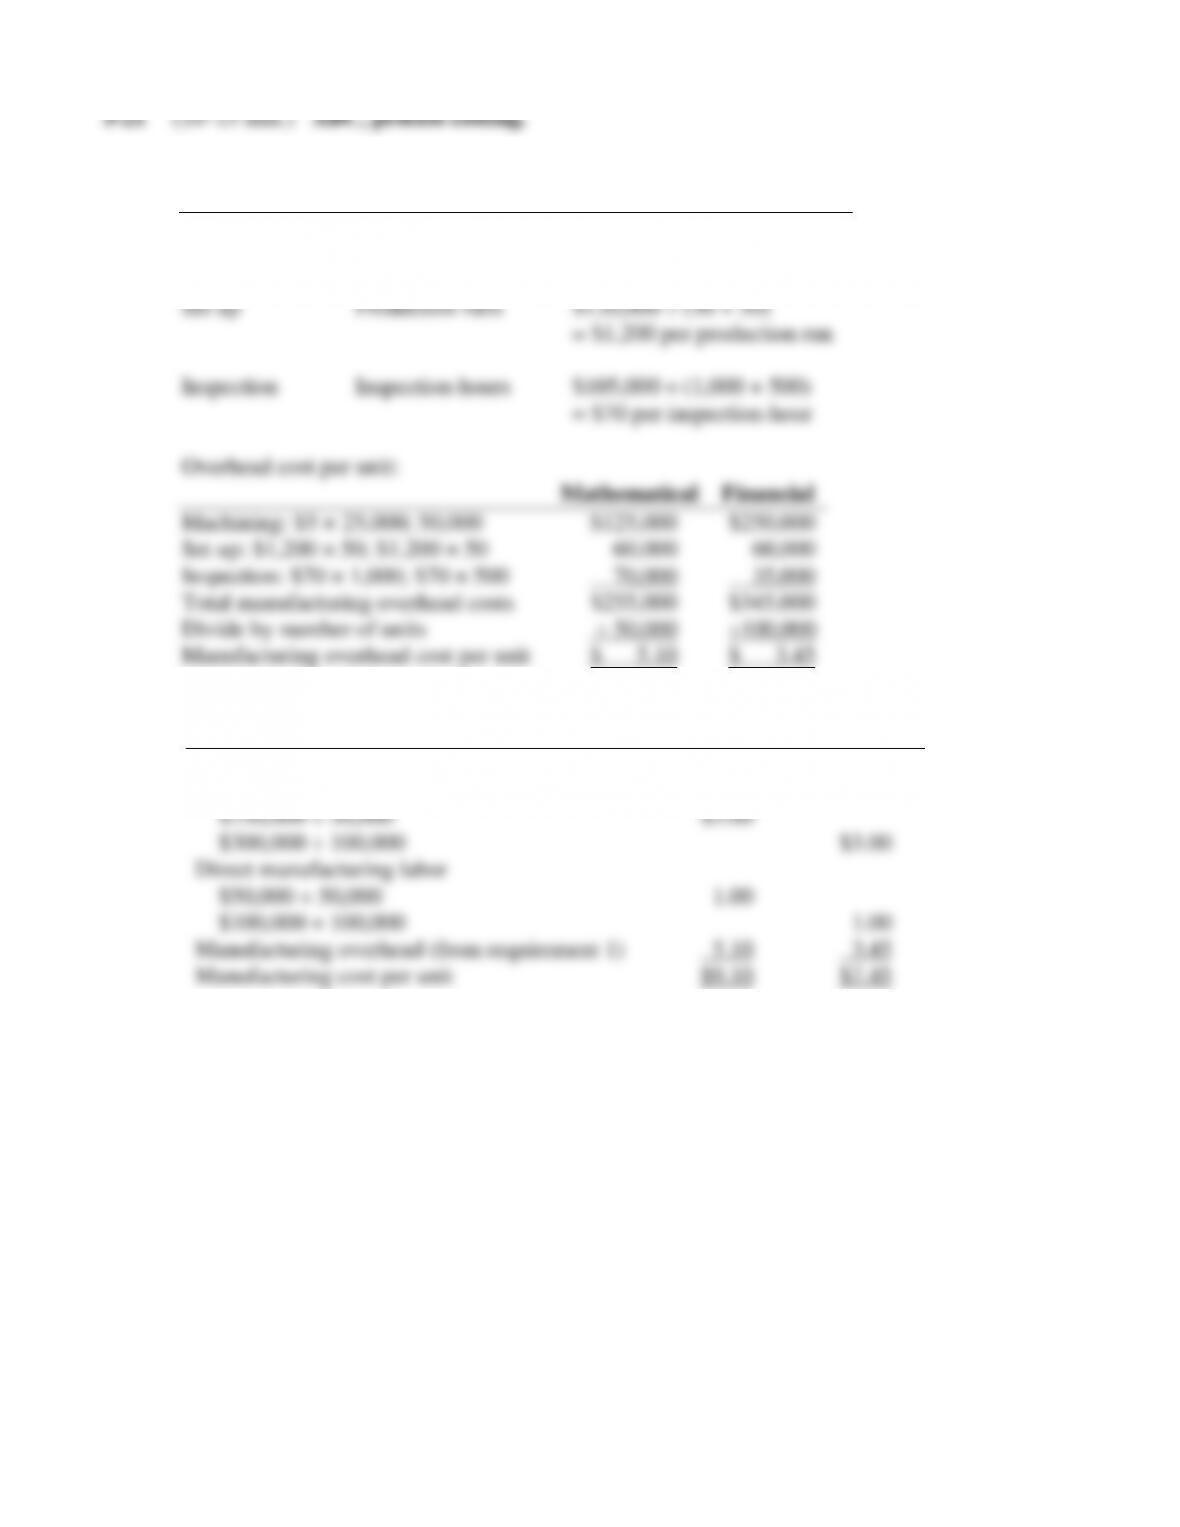
1. Rates per unit cost driver.
Activity Cost Driver Rate
Machining Machine-hours $375,000 ÷ (25,000 + 50,000)
= $5 per machine-hour
2.
Mathematical
Financial
Manufacturing cost per unit:
Direct materials
$150,000 ÷ 50,000
$3.00
$300,000 ÷ 100,000
$3.00
Direct manufacturing labor
$50,000 ÷ 50,000
1.00
$100,000 ÷ 100,000
1.00
Manufacturing overhead (from requirement 1)
5.10
3.45
Manufacturing cost per unit
$9.10
$7.45
1. Total indirect costs = $150,000 + $90,000 + $36,000 + $40,000 + $39,000 + $48,000
= $403,000
Total machine-hours = (400
10) + (200
10) = 6,000
5-16
3.
Cost per job
Standard
Job
Special
Job
Simple Costing System
$1,051.70
$1,121.70
Activity-based Costing System
$ 947.14
$1,330.72
Difference (Simple – ABC)
$ 104.56
$ (209.02)
system.
4. Quikprint can use the information revealed by the ABC system to change its pricing
based on the ABC costs. Under the simple system, Quikprint was making a gross margin of 12%
on each standard job (($1,200 – $1,051.70)
$1,200) and 25% on each special job (($1,500 –
5-23 (30 min.) Activity-based costing, manufacturing.
1. Simple costing system:
Total indirect costs = $95,000 + $45,000 + $25,000 + $60,000 + $8,000 + 3%[($125 3,200) +
($200 1,800)]
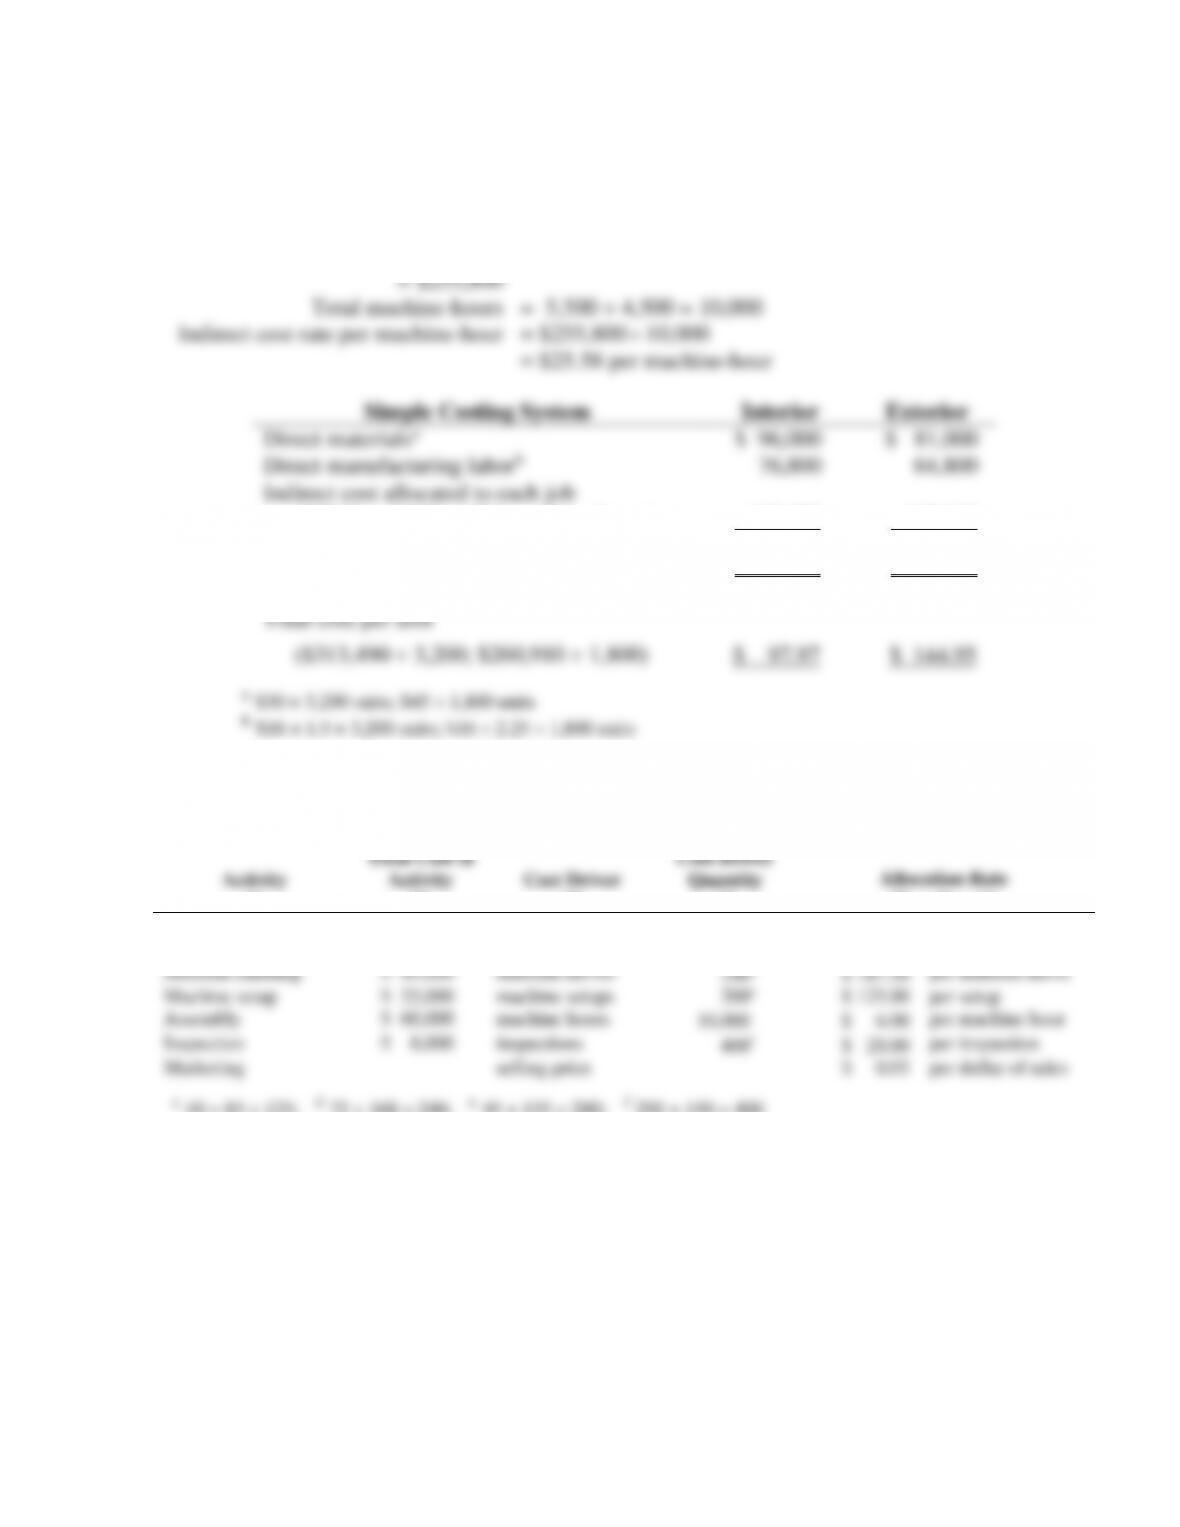
5-18
ABC System
Interior
Exterior
Direct materials
$ 96,000
$ 81,000
Direct manufacturing labor
76,800
64,800
Indirect costs allocated:
Product scheduling ($760 per run
40; 85)
30,400
64,600
Material handling ($187.50 per move
72; 168)
13,500
31,500
Machine setup ($125 per setup
45; 155)
5,625
19,375
Assembly ($6 per MH × 5,500; 4,500)
33,000
27,000
Inspection ($20 per inspection × 250; 150)
5,000
3,000
Marketing (0.03
$125
3,200; 0.03
$200
1,800)
12,000
10,800
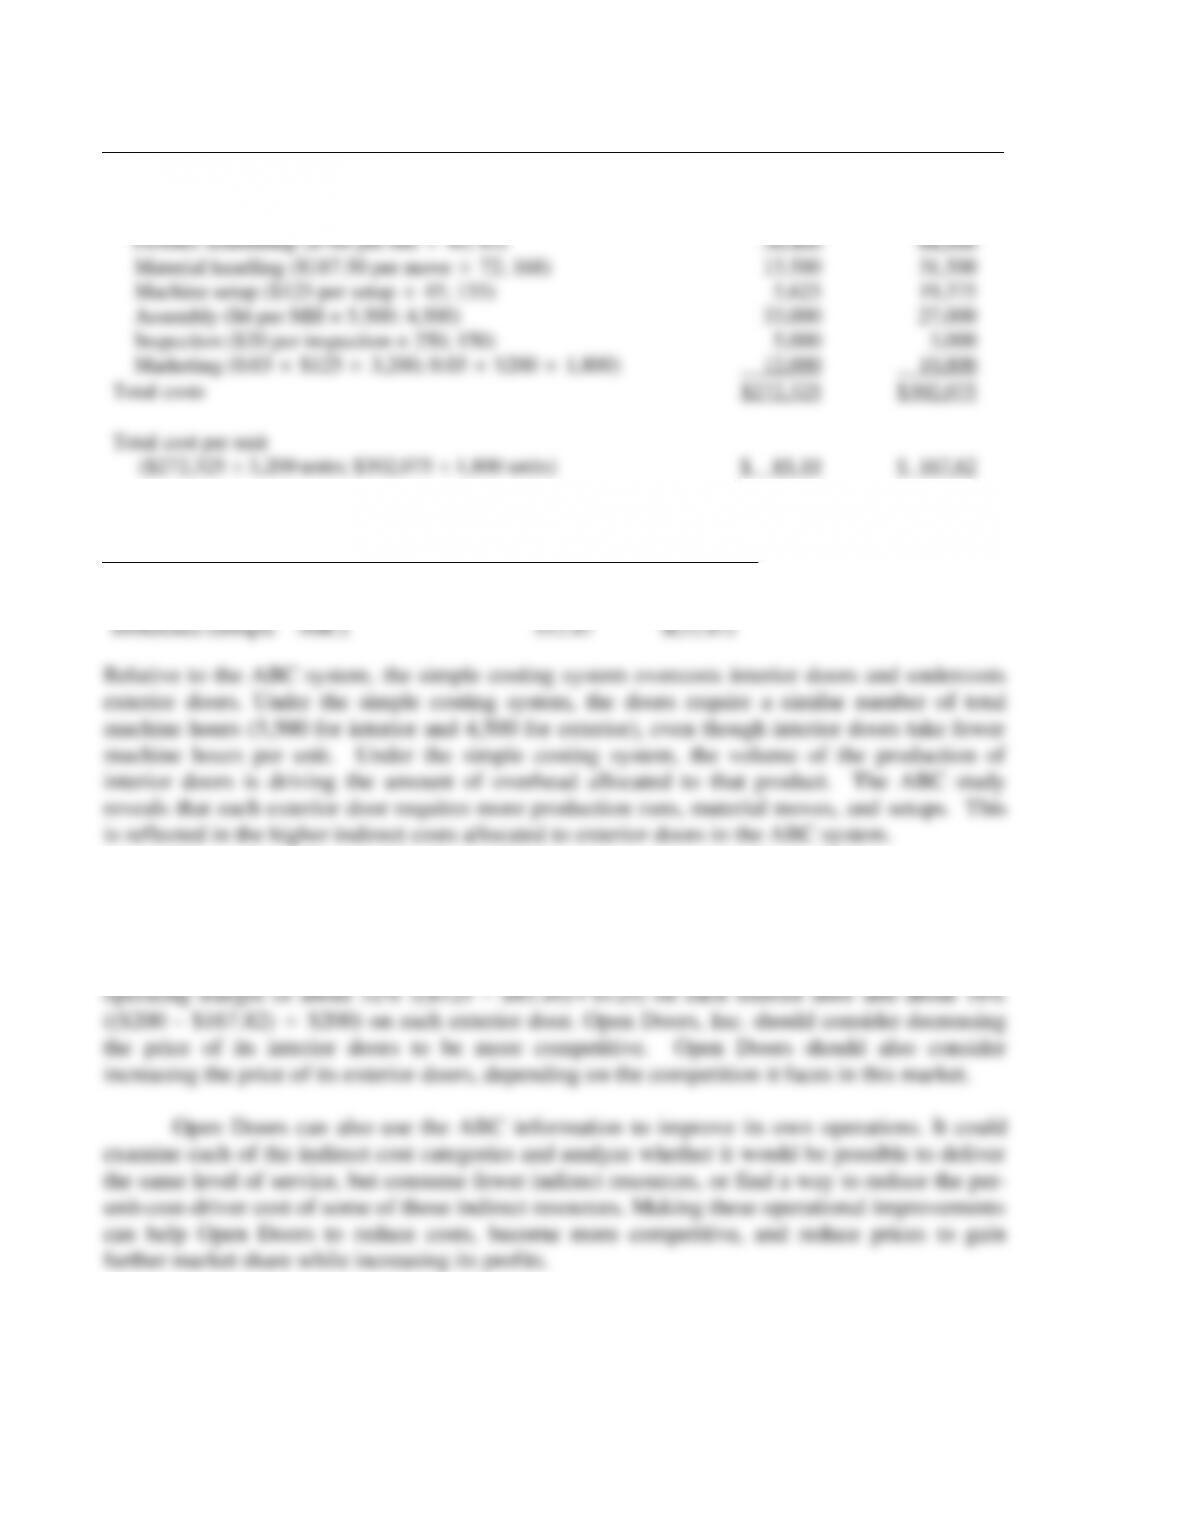
Total costs
$272,325
$302,075
Total cost per unit
($272,325 ÷ 3,200 units; $302,075 ÷ 1,800 units)
$ 85.10
$ 167.82
3.
Cost per unit
Interior
Exterior
Simple Costing System
$97.97
$144.95
Activity-based Costing System
$85.10
$167.82
Difference (Simple – ABC)
$12.87
$(22.87)
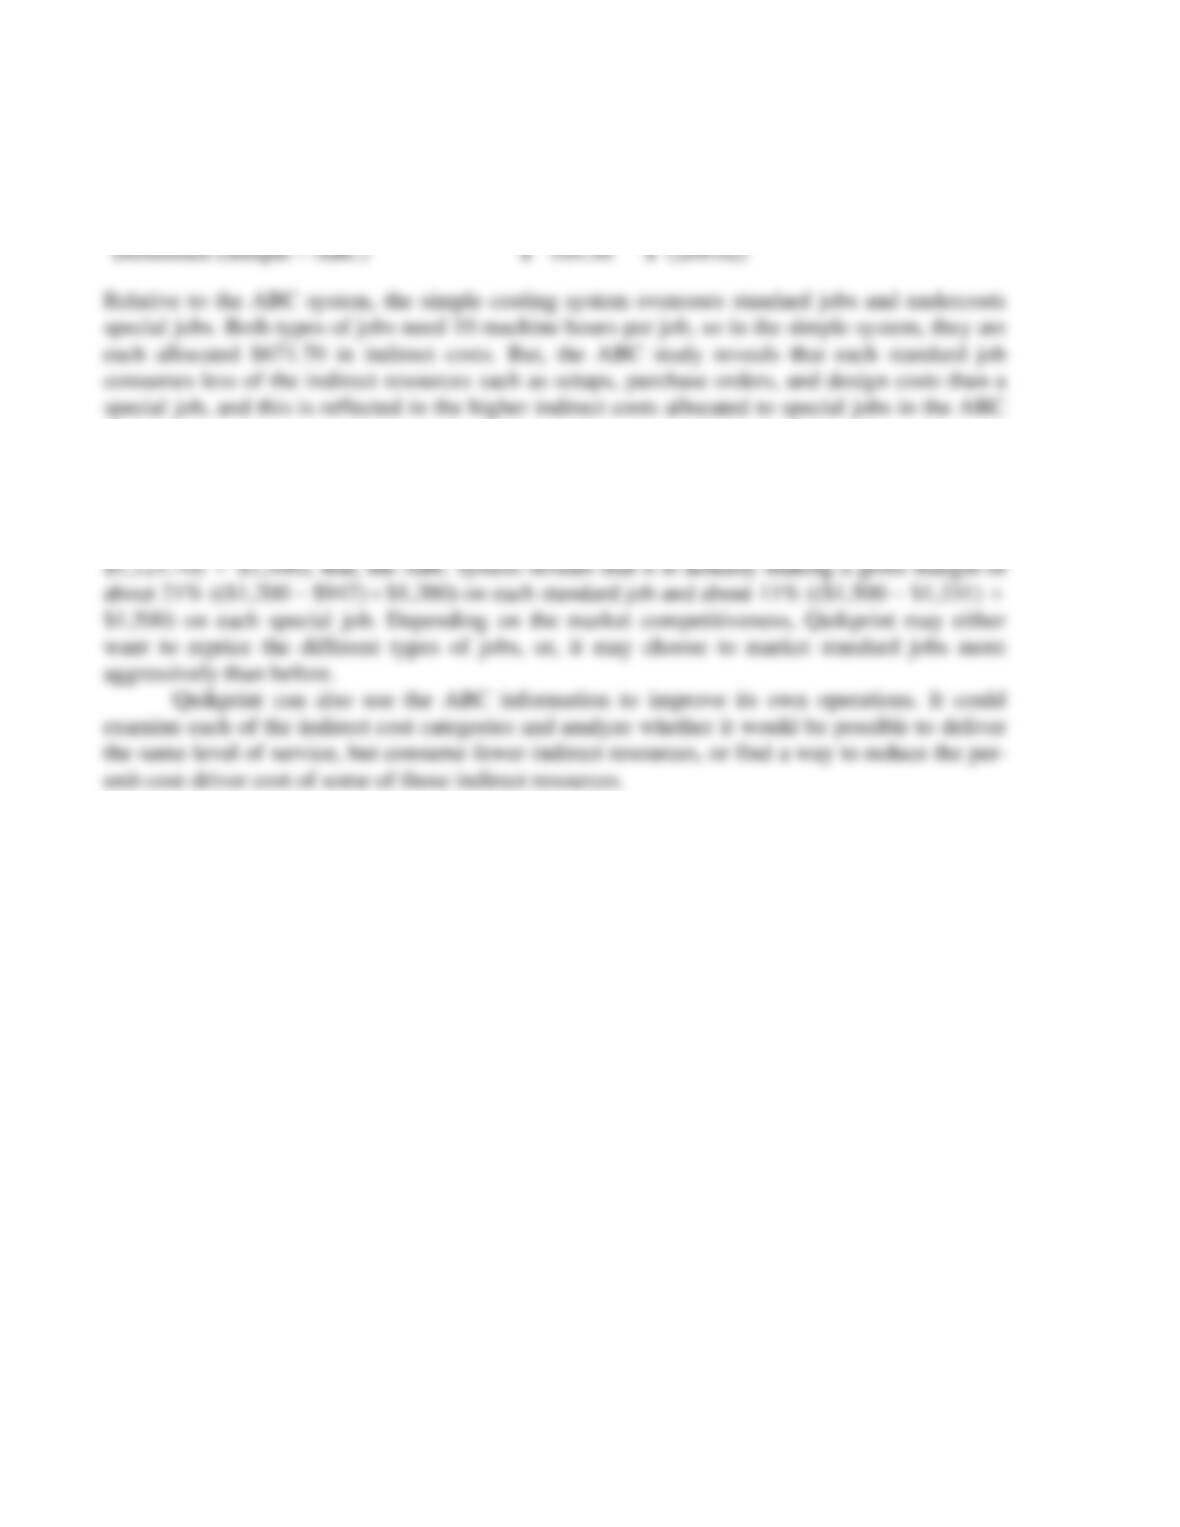
Relative to the ABC system, the simple costing system overcosts interior doors and undercosts
exterior doors. Under the simple costing system, the doors require a similar number of total
machine hours (5,500 for interior and 4,500 for exterior), even though interior doors take fewer
machine hours per unit. Under the simple costing system, the volume of the production of
interior doors is driving the amount of overhead allocated to that product. The ABC study
reveals that each exterior door requires more production runs, material moves, and setups. This
is reflected in the higher indirect costs allocated to exterior doors in the ABC system.
4. Open Doors, Inc. can use the information revealed by the ABC system to change its
pricing based on the ABC costs. Under the simple system, Open Doors was making an operating
margin of 21.6% on each interior door (($125 – $97.97)
$125) and 27.5% on each exterior
door (($200 – $144.95)
$200). But, the ABC system reveals that it is actually making an
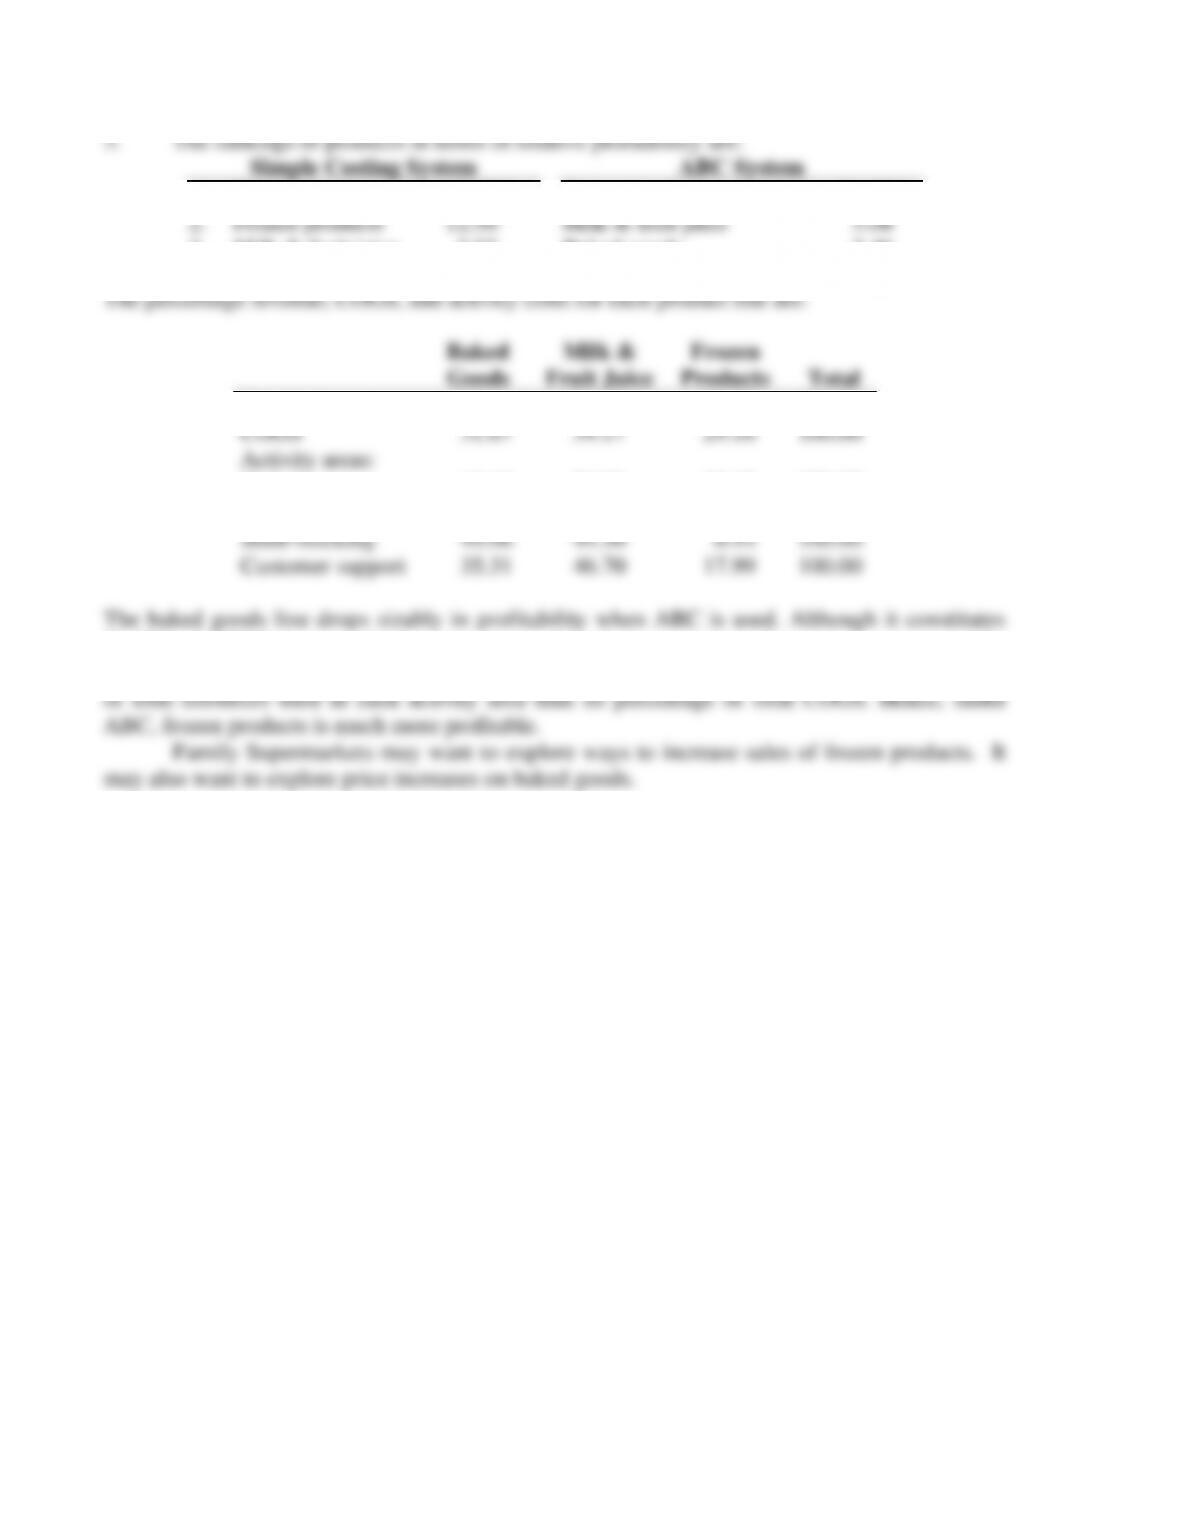
5-24 (30 min.) ABC, retail product-line profitability.
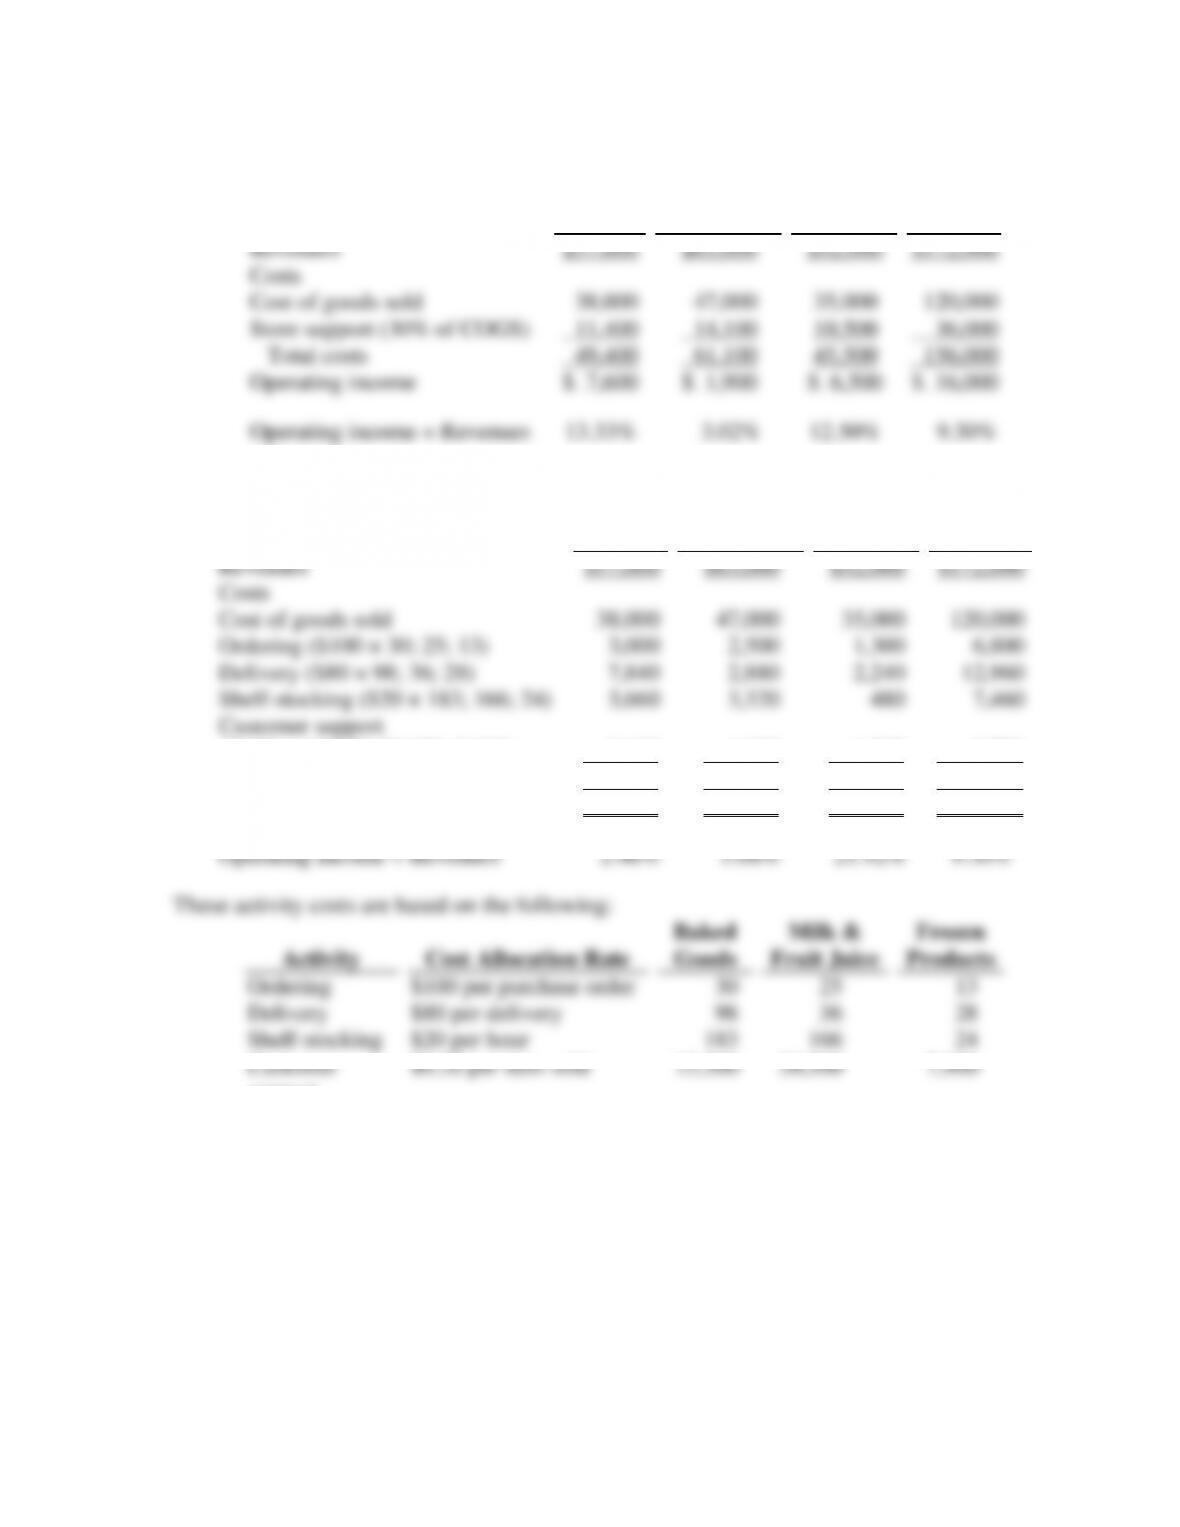
1. The simple costing system (Panel A of Solution Exhibit 5-24) reports the following:
Baked
Goods
Milk &
Fruit Juice
Frozen
Products
Total
Revenues
Costs
Cost of goods sold
Store support (30% of COGS)
Total costs
Operating income
Operating income ÷ Revenues
$57,000
38,000
11,400
49,400
$ 7,600
13.33%
$63,000
47,000
14,100
61,100
$ 1,900
3.02%
$52,000
35,000
10,500
45,500
$ 6,500
12.50%
$172,000
120,000
36,000
156,000
$ 16,000
9.30%
2. The ABC system (Panel B of Solution Exhibit 5-24) reports the following:
Baked
Goods
Milk &
Fruit Juice
Frozen
Products
Total
Revenues
Costs
Cost of goods sold
Ordering ($100 × 30; 25; 13)
Delivery ($80 × 98; 36; 28)
Shelf-stocking ($20 × 183; 166; 24)
Customer support
($0.20 × 15,500; 20,500; 7,900)
Total costs
Operating income
Operating income ÷ Revenues
$57,000
38,000
3,000
7,840
3,660
3,100
55,600
$ 1,400
2.46%
$63,000
47,000
2,500
2,880
3,320
4,100
59,800
$ 3,200
5.08%
$52,000
35,000
1,300
2,240
480
1,580
40,600
$11,400
21.92%
$172,000
120,000
6,800
12,960
7,460
8,780
156,000
$ 16,000
9.30%
These activity costs are based on the following:
Activity
Cost Allocation Rate
Baked
Goods
Milk &
Fruit Juice
Frozen
Products
Ordering
Delivery
Shelf-stocking
Customer
support
$100 per purchase order
$80 per delivery
$20 per hour
$0.20 per item sold
30
98
183
15,500
25
36
166
20,500
13
28
24
7,900