3-41
0.40R = $11,700,000
R = $11,700,000 0.40 = $29,250,000
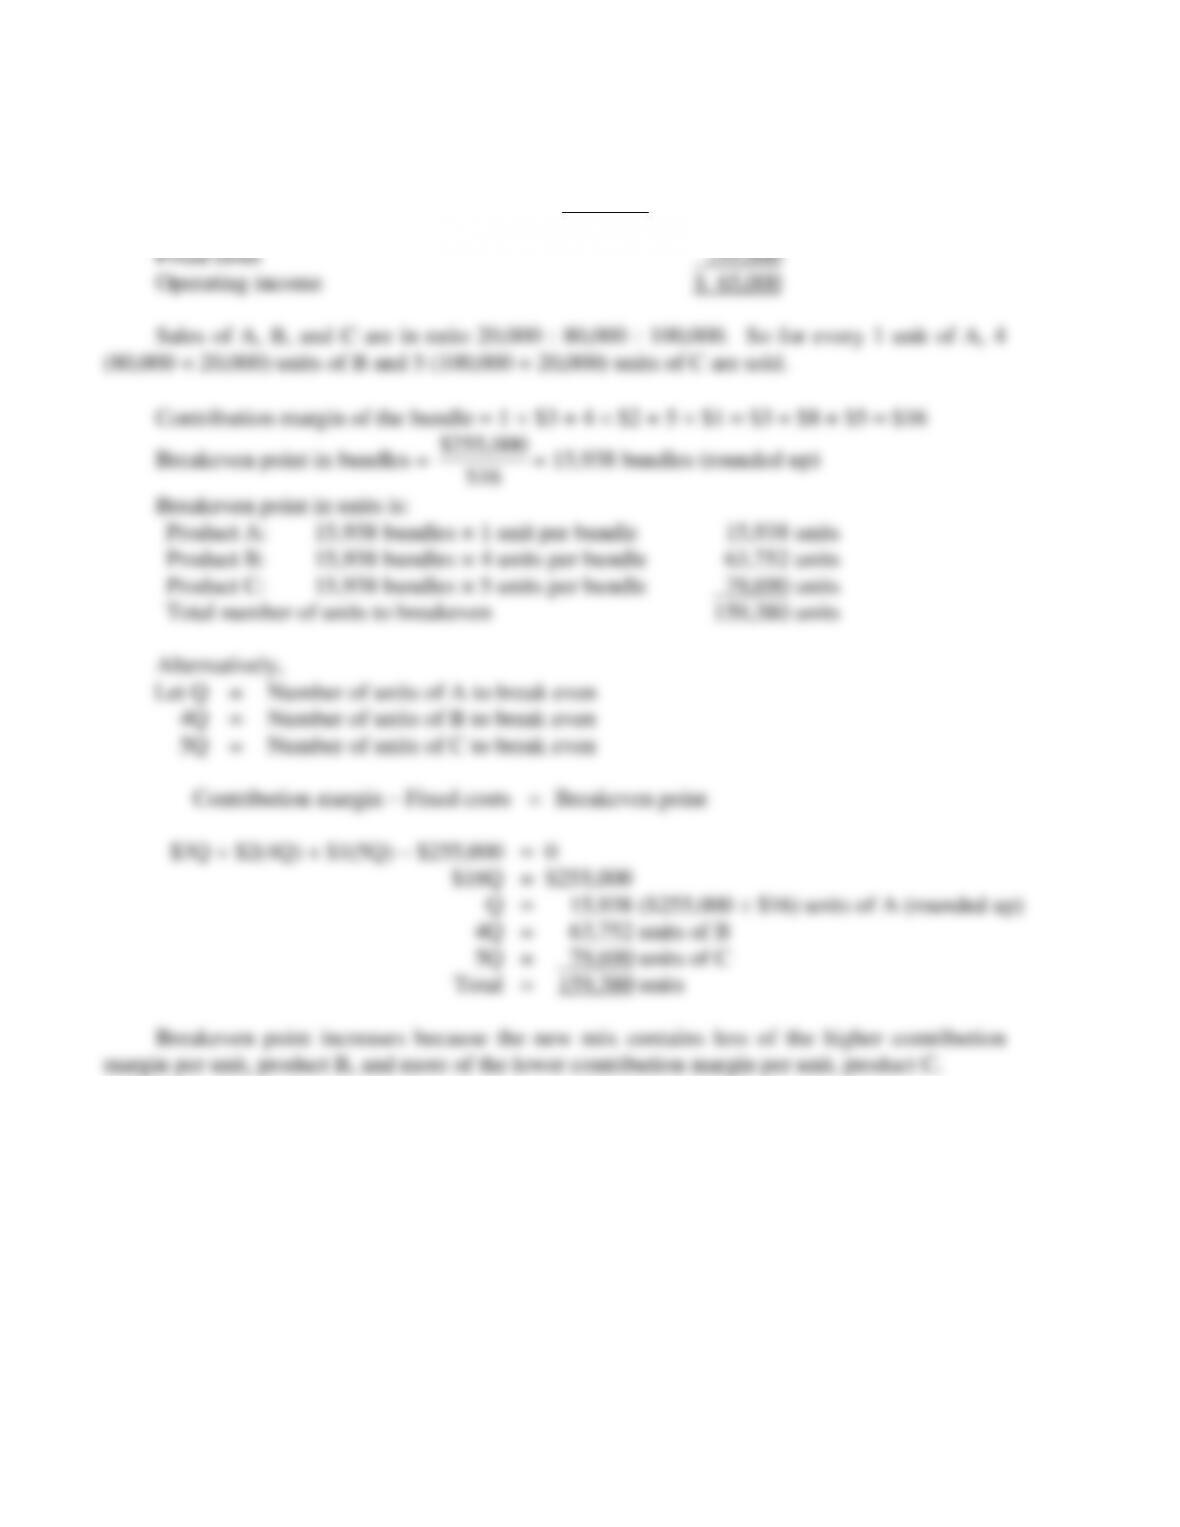
1. Sales of A, B, and C are in ratio 20,000 : 100,000 : 80,000. So for every 1 unit of A, 5
(100,000 ÷ 20,000) units of B are sold, and 4 (80,000 ÷ 20,000) units of C are sold.
Contribution margin of the bundle = 1 $3 + 5 $2 + 4 $1 = $3 + $10 + $4 = $17
Breakeven point in bundles =
$255,000
$17
= 15,000 bundles
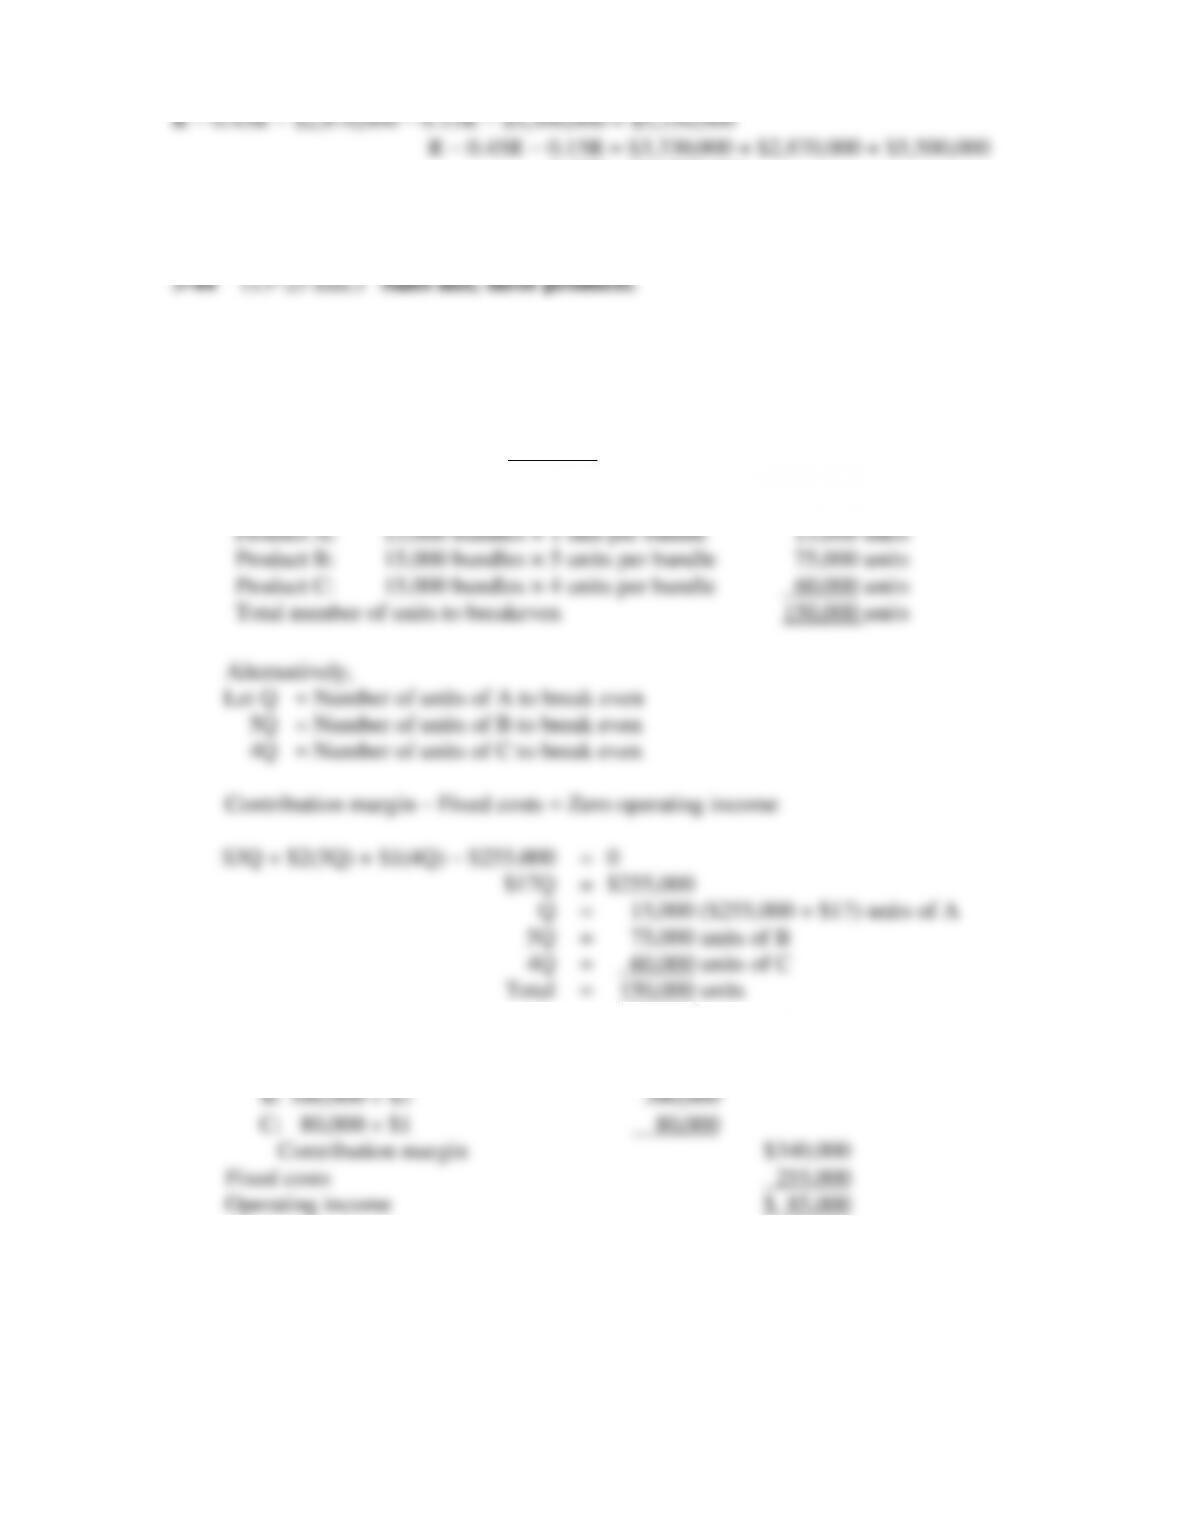
Breakeven point in units is:
Product A:
15,000 bundles × 1 unit per bundle
15,000 units
Product B:
15,000 bundles × 5 units per bundle
75,000 units
Product C:
15,000 bundles × 4 units per bundle
60,000 units
Total number of units to breakeven
150,000 units
Alternatively,
Let Q = Number of units of A to break even
5Q = Number of units of B to break even
4Q = Number of units of C to break even
Contribution margin – Fixed costs = Zero operating income
$3Q + $2(5Q) + $1(4Q) – $255,000 = 0
$17Q = $255,000
Q = 15,000 ($255,000 ÷ $17) units of A
5Q = 75,000 units of B
4Q = 60,000 units of C
Total = 150,000 units
2. Contribution margin:
A: 20,000 $3 $ 60,000
3-42
3. Contribution margin
A: 20,000 $3 $ 60,000
B: 80,000 $2 160,000
C: 100,000 $1 100,000
Contribution margin $320,000
3-43
3-45 (40 min.) Multi-product CVP and decision making.
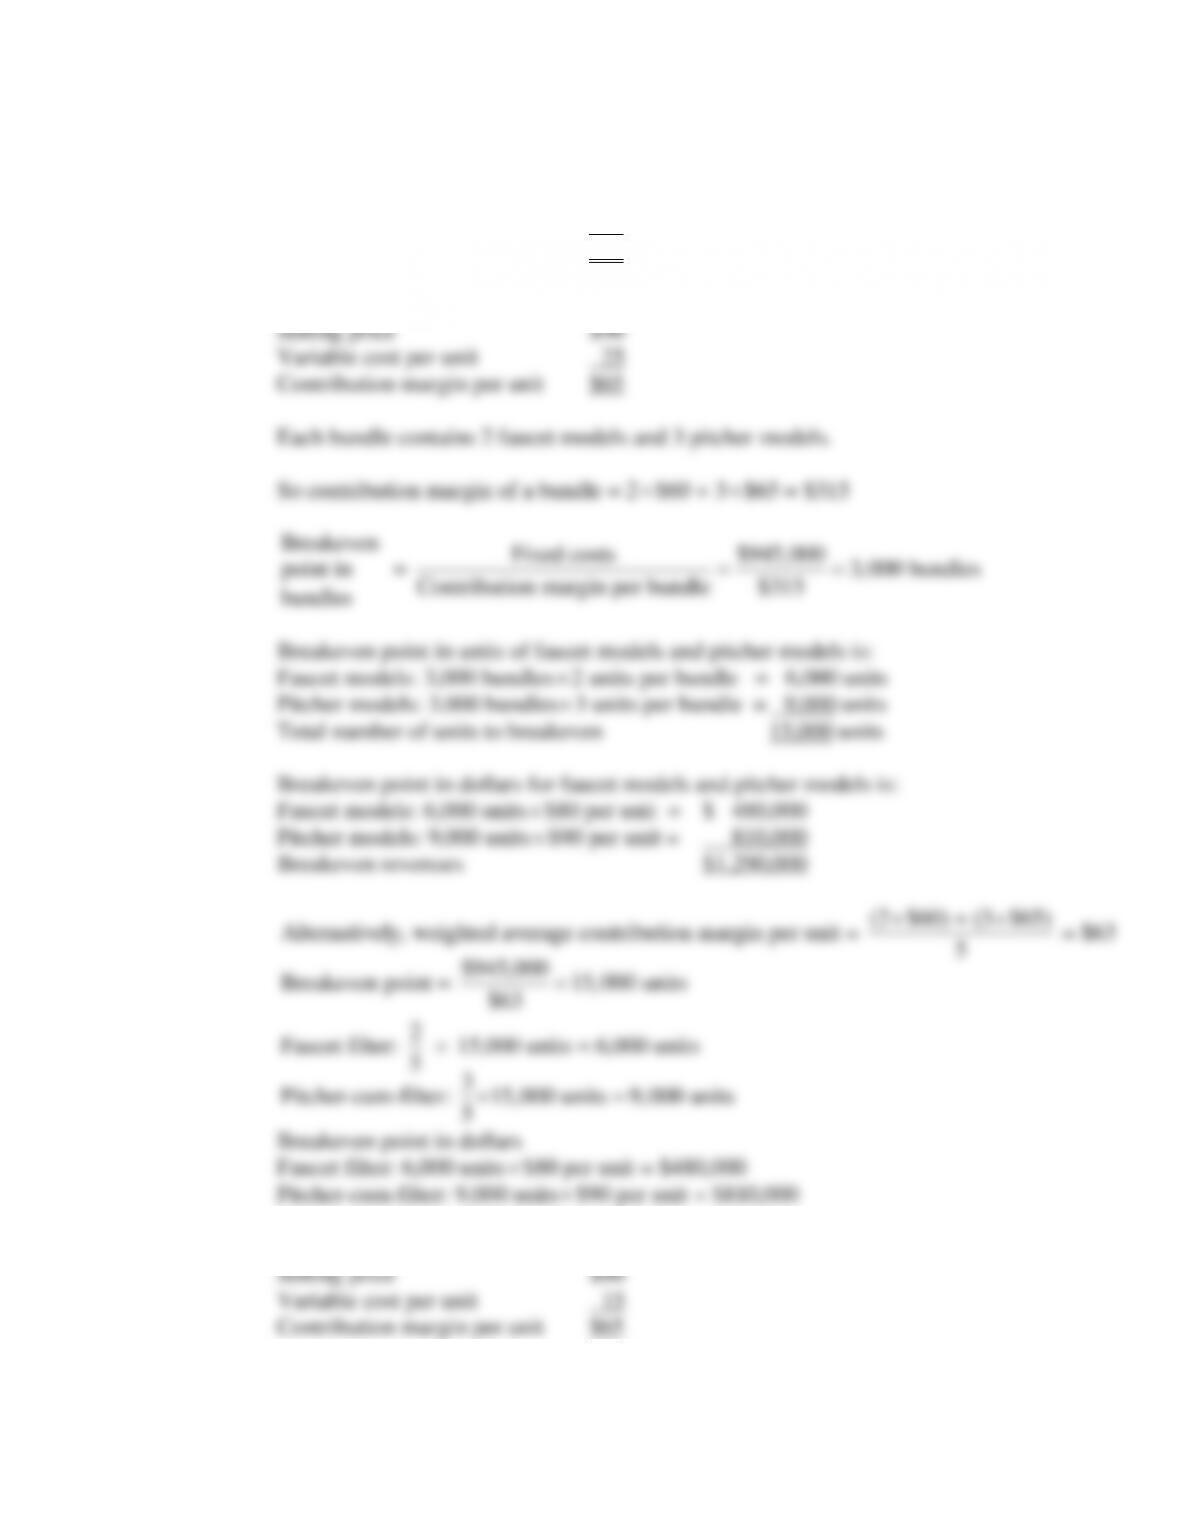
1. Faucet filter:
Selling price $80
Variable cost per unit 20
Contribution margin per unit $60
Pitcher-cum-filter:
2. Faucet filter:
3-44
Pitcher-cum-filter:
Selling price $90
Variable cost per unit 16
Contribution margin per unit $74
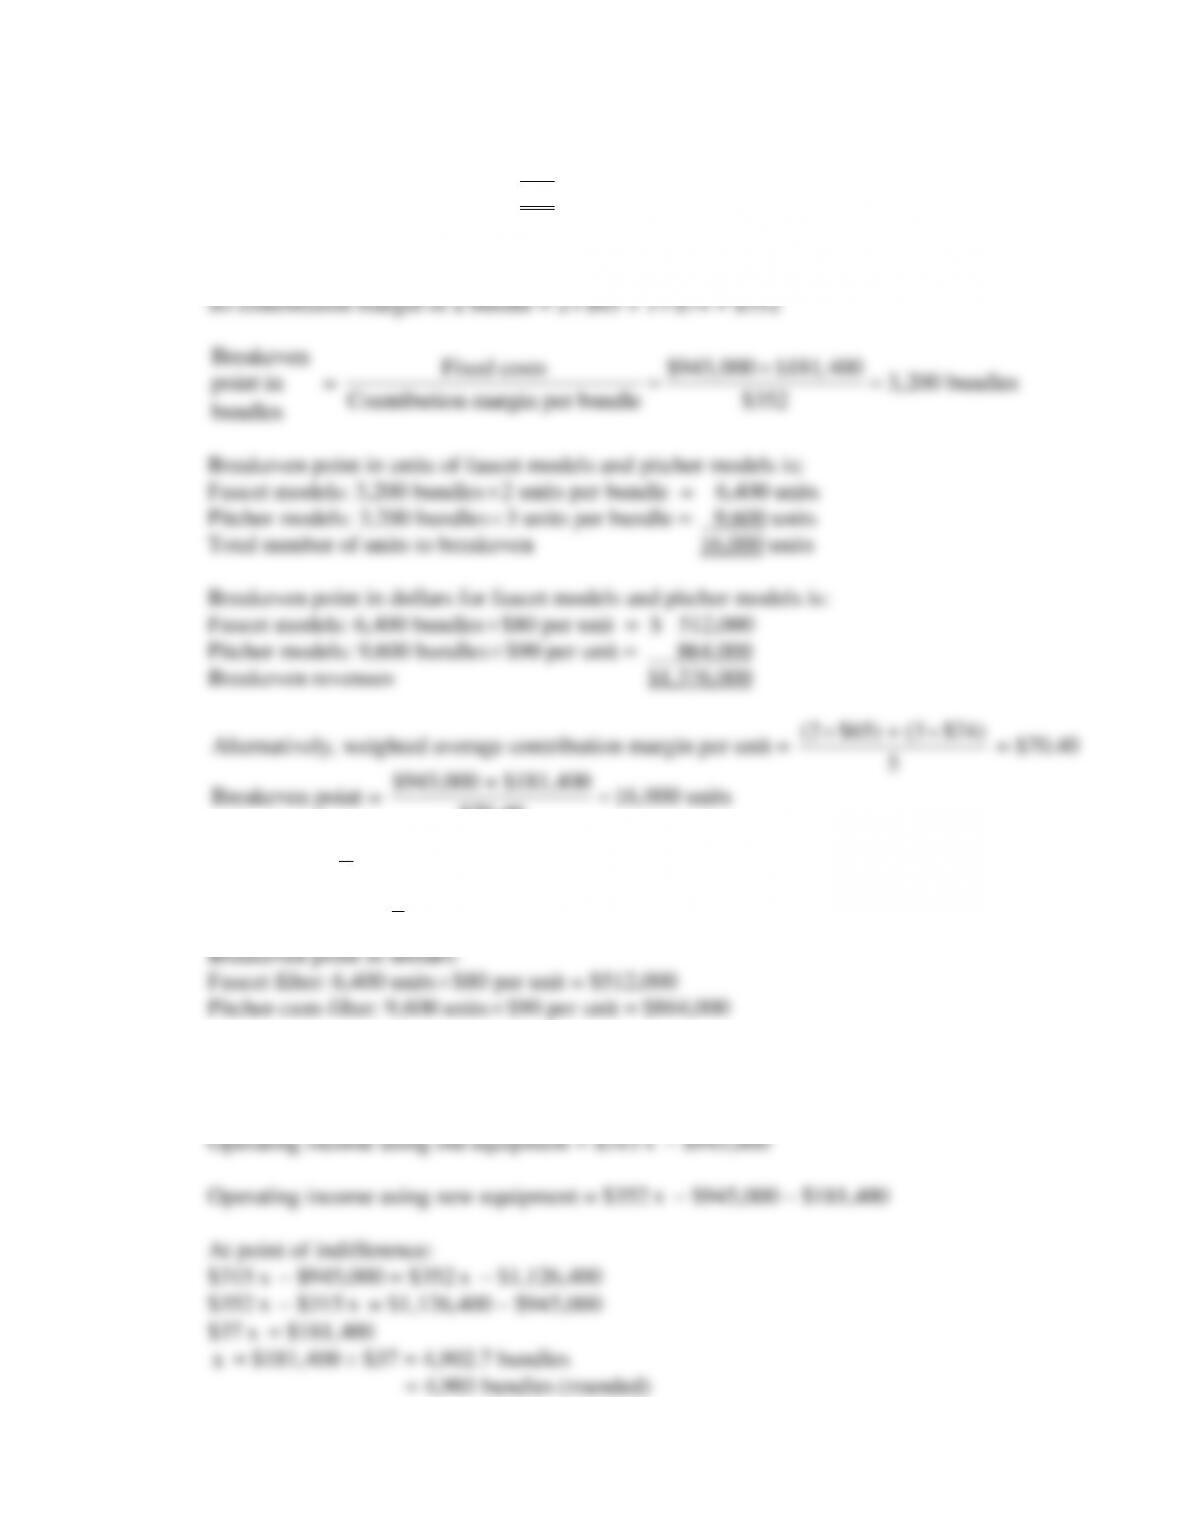
Each bundle contains 2 faucet models and 3 pitcher models.
3-45
Faucet models = 4,903 bundles
2 units per bundle = 9,806 units
Pitcher models = 4,903 bundles
3 units per bundle = 14,709 units
Total number of units 24,515 units
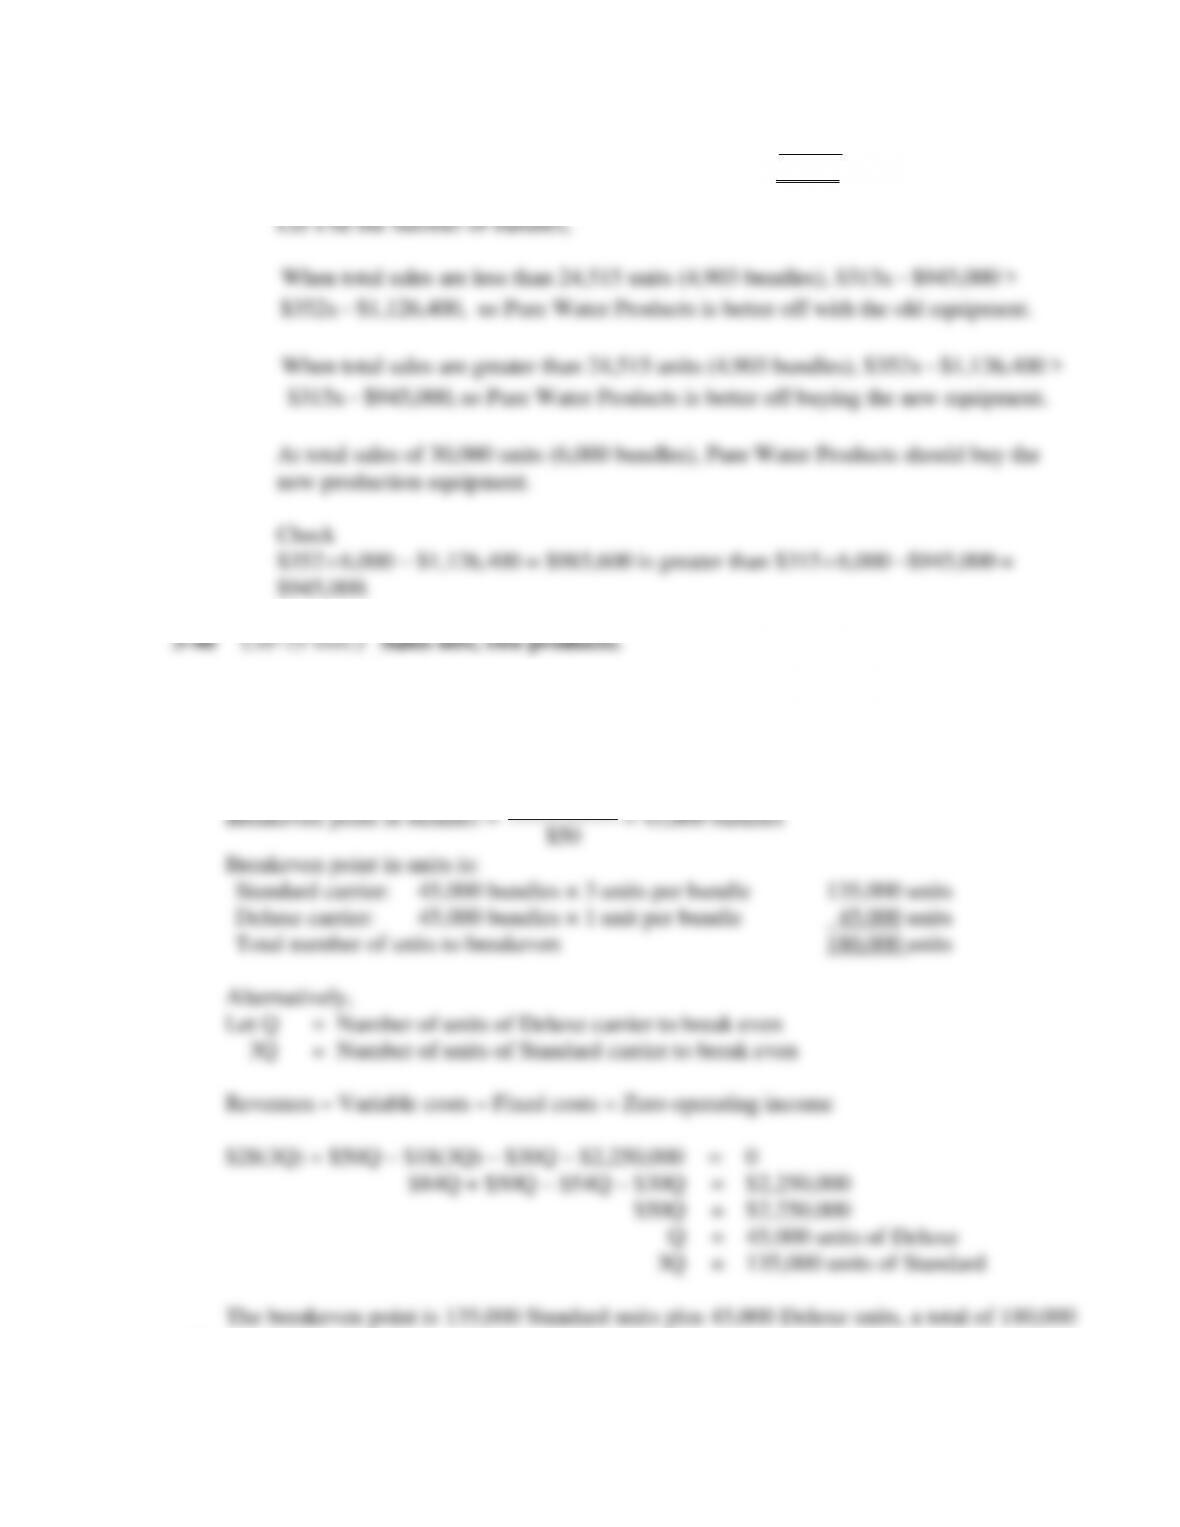
1. Sales of standard and deluxe carriers are in the ratio of 187,500 : 62,500. So for every 1
unit of deluxe, 3 (187,500 ÷ 62,500) units of standard are sold.
Contribution margin of the bundle = 3 $10 + 1 $20 = $30 + $20 = $50
$2,250,000
$50
Breakeven point in units is:
Standard carrier:
45,000 bundles × 3 units per bundle
135,000 units
Deluxe carrier:
45,000 bundles × 1 unit per bundle
45,000 units
Total number of units to breakeven
180,000 units
Alternatively,
Let Q = Number of units of Deluxe carrier to break even
3Q = Number of units of Standard carrier to break even
Revenues – Variable costs – Fixed costs = Zero operating income
$28(3Q) + $50Q – $18(3Q) – $30Q – $2,250,000 = 0
$84Q + $50Q – $54Q – $30Q = $2,250,000
$50Q = $2,250,000
Q = 45,000 units of Deluxe
3Q = 135,000 units of Standard
The breakeven point is 135,000 Standard units plus 45,000 Deluxe units, a total of 180,000
units.
3-46
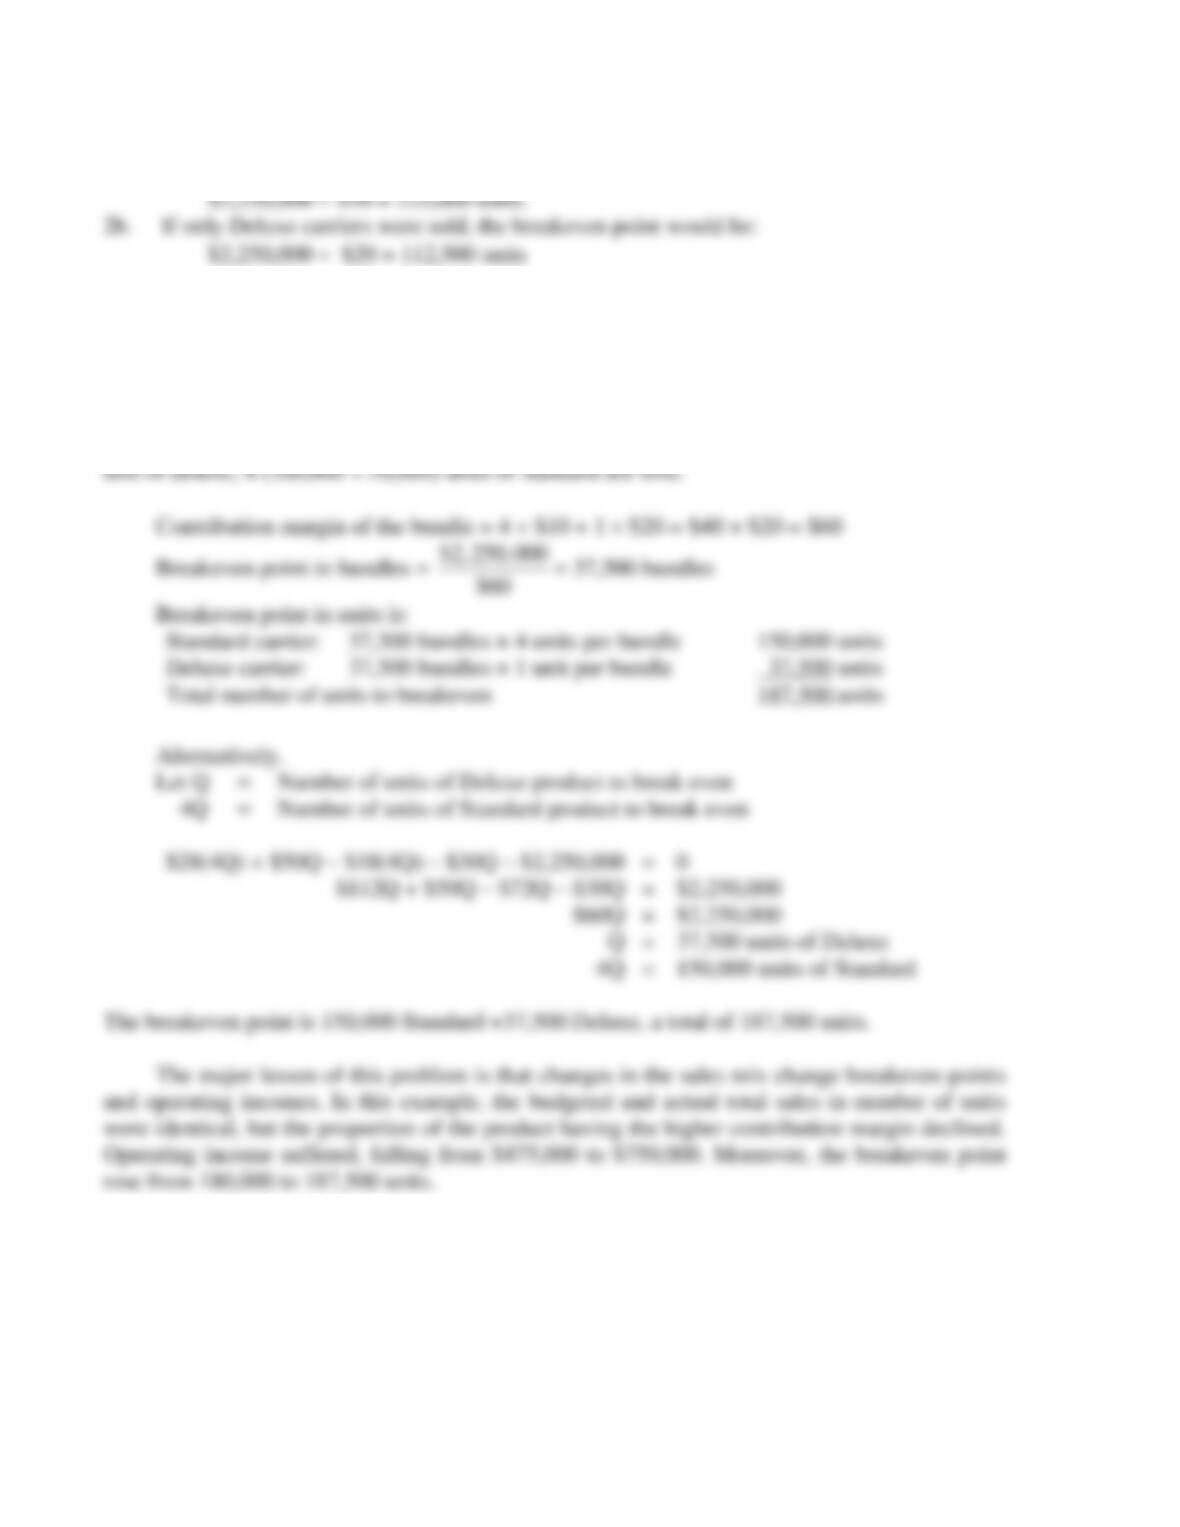
2a. Unit contribution margins are: Standard: $28 – $18 = $10; Deluxe: $50 – $30 = $20
If only Standard carriers were sold, the breakeven point would be:
3. Operating income = Contribution margin of Standard + Contribution margin of Deluxe – Fixed costs
= 200,000($10) + 50,000($20) – $2,250,000
= $2,000,000 + $1,000,000 – $2,250,000
= $750,000
Sales of standard and deluxe carriers are in the ratio of 200,000 : 50,000. So for every 1
3-47
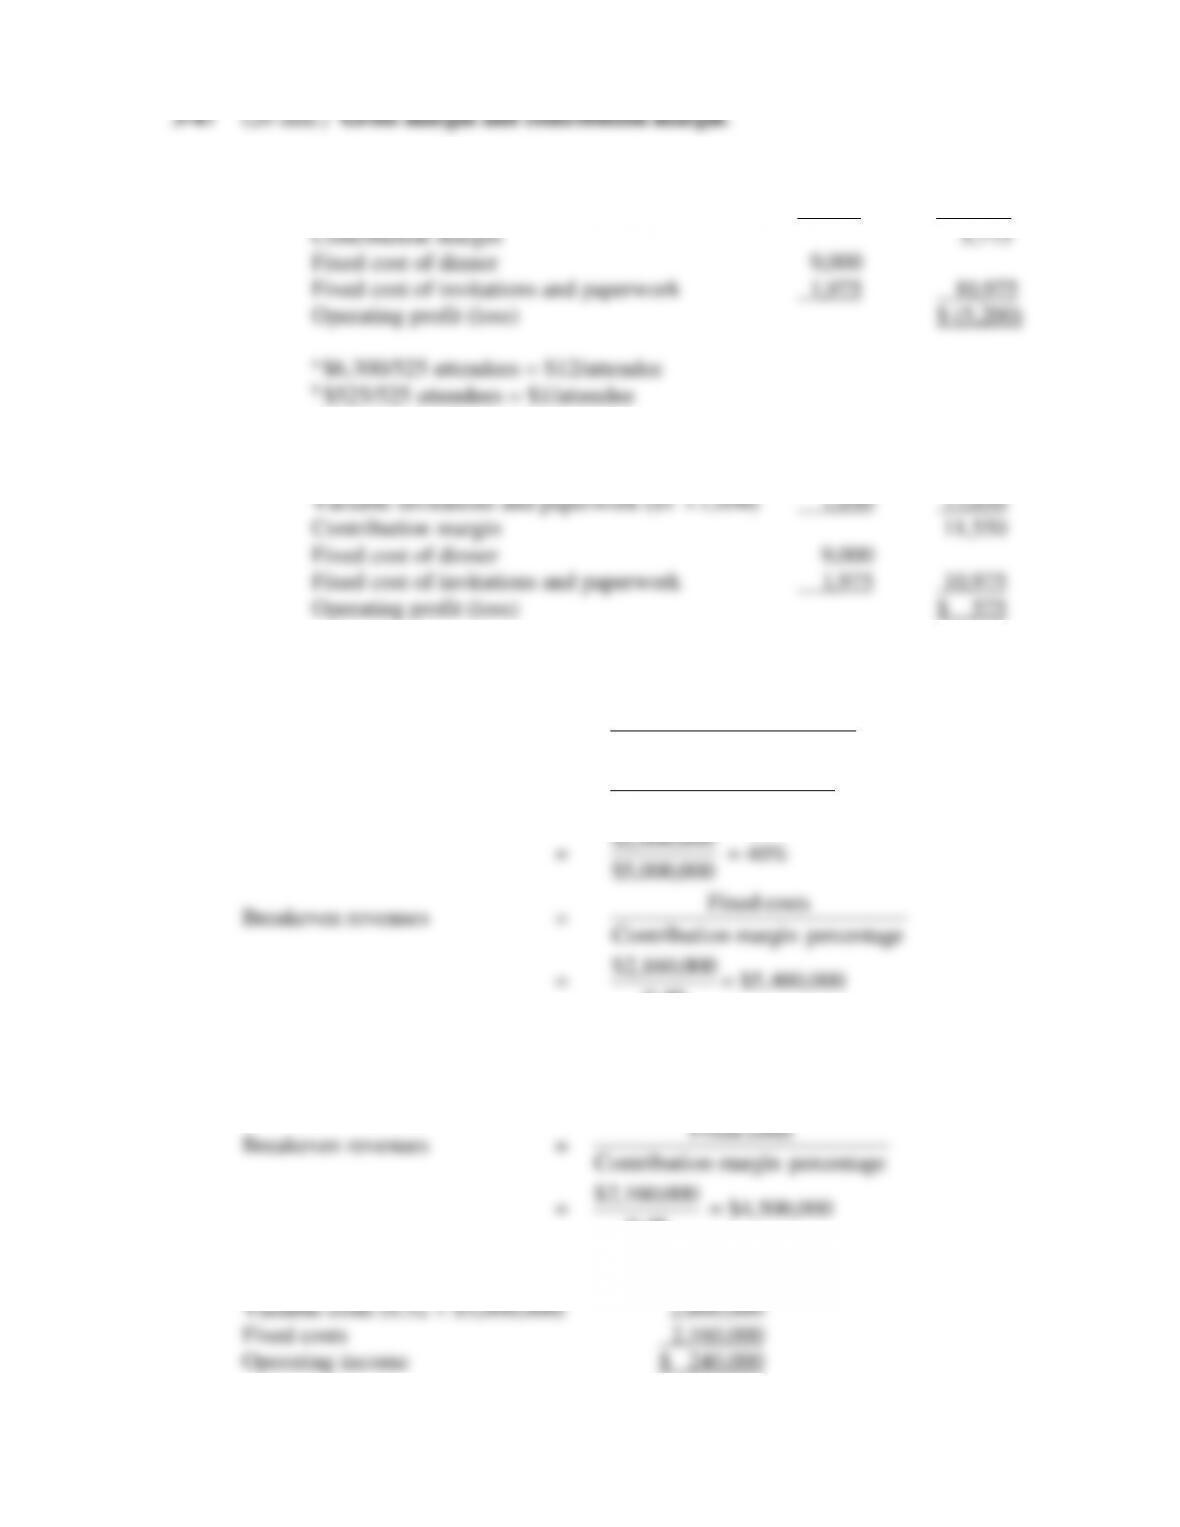
1. Ticket sales ($24
525 attendees) $12,600
Variable cost of dinner ($12a
525 attendees) $6,300
Variable invitations and paperwork ($1b
525) 525 6,825
2. Ticket sales ($24
1,050 attendees) $25,200
Variable cost of dinner ($12
1,050 attendees) $12,600
3-48 (30 min.) Ethics, CVP analysis.
1. Contribution margin percentage =
Revenues osts
Revenues
−Variable c
=
$5, , $3, ,000 000 000 000−
$5,000,000
$2,000,000
0.40
2. If variable costs are 52% of revenues, contribution margin percentage equals 48%
(100% − 52%)
costs Fixed
0.48
3. Revenues $5,000,000
3-48
4. Incorrect reporting of environmental costs with the goal of continuing operations is
unethical. In assessing the situation, the specific “Standards of Ethical Conduct for Management
Accountants” (described in Exhibit 1-7) that the management accountant should consider are
listed below.
Competence

3-49
3-49 (35 min.) Deciding where to produce.
Peoria
Moline
Selling price
$150.00
$150.00
Variable cost per unit
Manufacturing
$72.00
$88.00
Marketing and distribution
14.00
86.00
14.00
102.00
Contribution margin per unit (CMU)
64.00
48.00
Fixed costs per unit
Manufacturing
30.00
15.00
Marketing and distribution
19.00
49.00
14.50
29.50
Operating income per unit
$ 15.00
$ 18.50
CMU of normal production (as shown above)
$64
$48
CMU of overtime production
($64 – $3; $48 – $8)
61
40
1.
Annual fixed costs = Fixed cost per unit
Daily
production rate
Normal annual capacity
($49
400 units
240 days;
$29.50
320 units
240 days)
$4,704,000
$2,265,600
Breakeven volume = FC
CMU of normal
production ($4,704,000
$64; $2,265,600
48)
73,500
units
47,200
units
2.
Units produced and sold
96,000
96,000
Normal annual volume (units)
(400 × 240; 320 × 240)
96,000
76,800
Units over normal volume (needing overtime)
0
19,200
CM from normal production units (normal
annual volume
CMU normal production)
(96,000 × $64; 76,800 × 48)
$6,144,000
$3,686,400
CM from overtime production units
(0; 19,200
$40)
0
768,000
Total contribution margin
6,144,000
4,454,400
Total fixed costs
4,704,000
2,265,600
Operating income
$1,440,000
$2,188,800
Total operating income
$3,628,800
3. The optimal production plan is to produce 120,000 units at the Peoria plant and 72,000
3-50
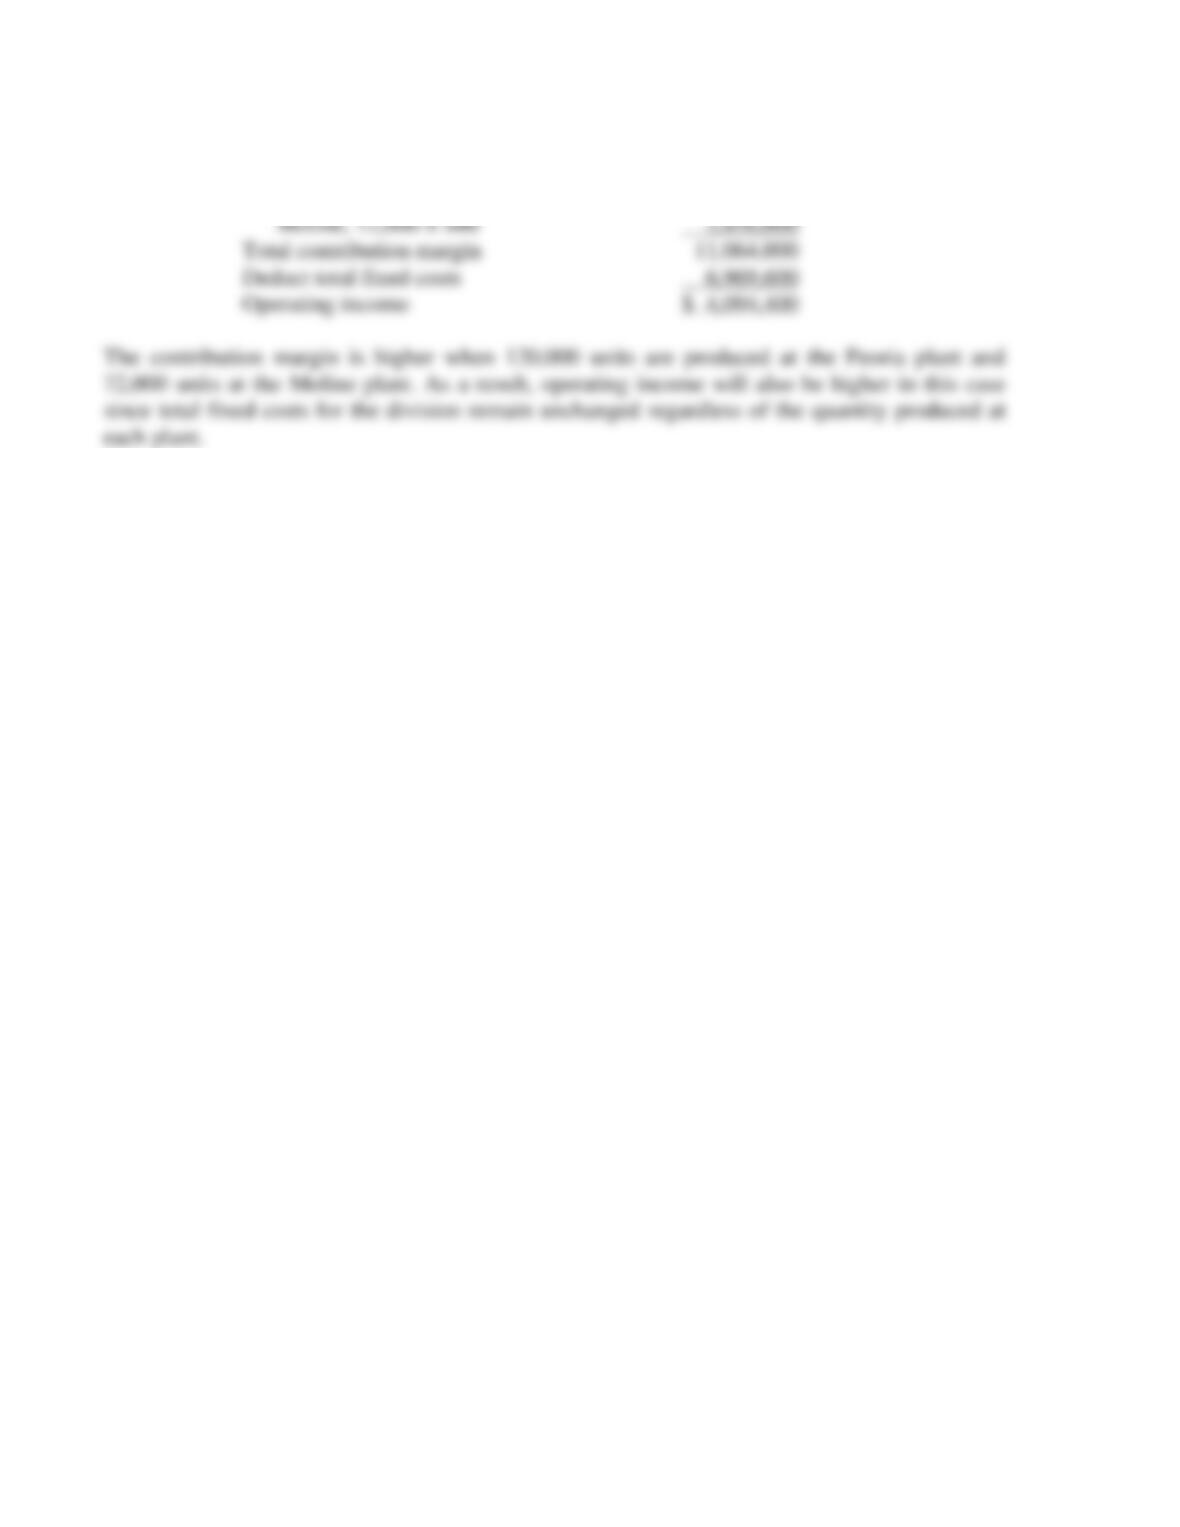
Contribution margin per plant:
Peoria, 96,000 × $64 $ 6,144,000
Peoria 24,000 × ($64 – $3) 1,464,000