3-21
Breakeven point in units =
Net fixed costs
Contribution margin per concert
=
$1,000
$74,000
= 74 concerts
Check
Donations
$ 40,000
Revenue ($2,500 × 74)
185,000
Total revenue
225,000
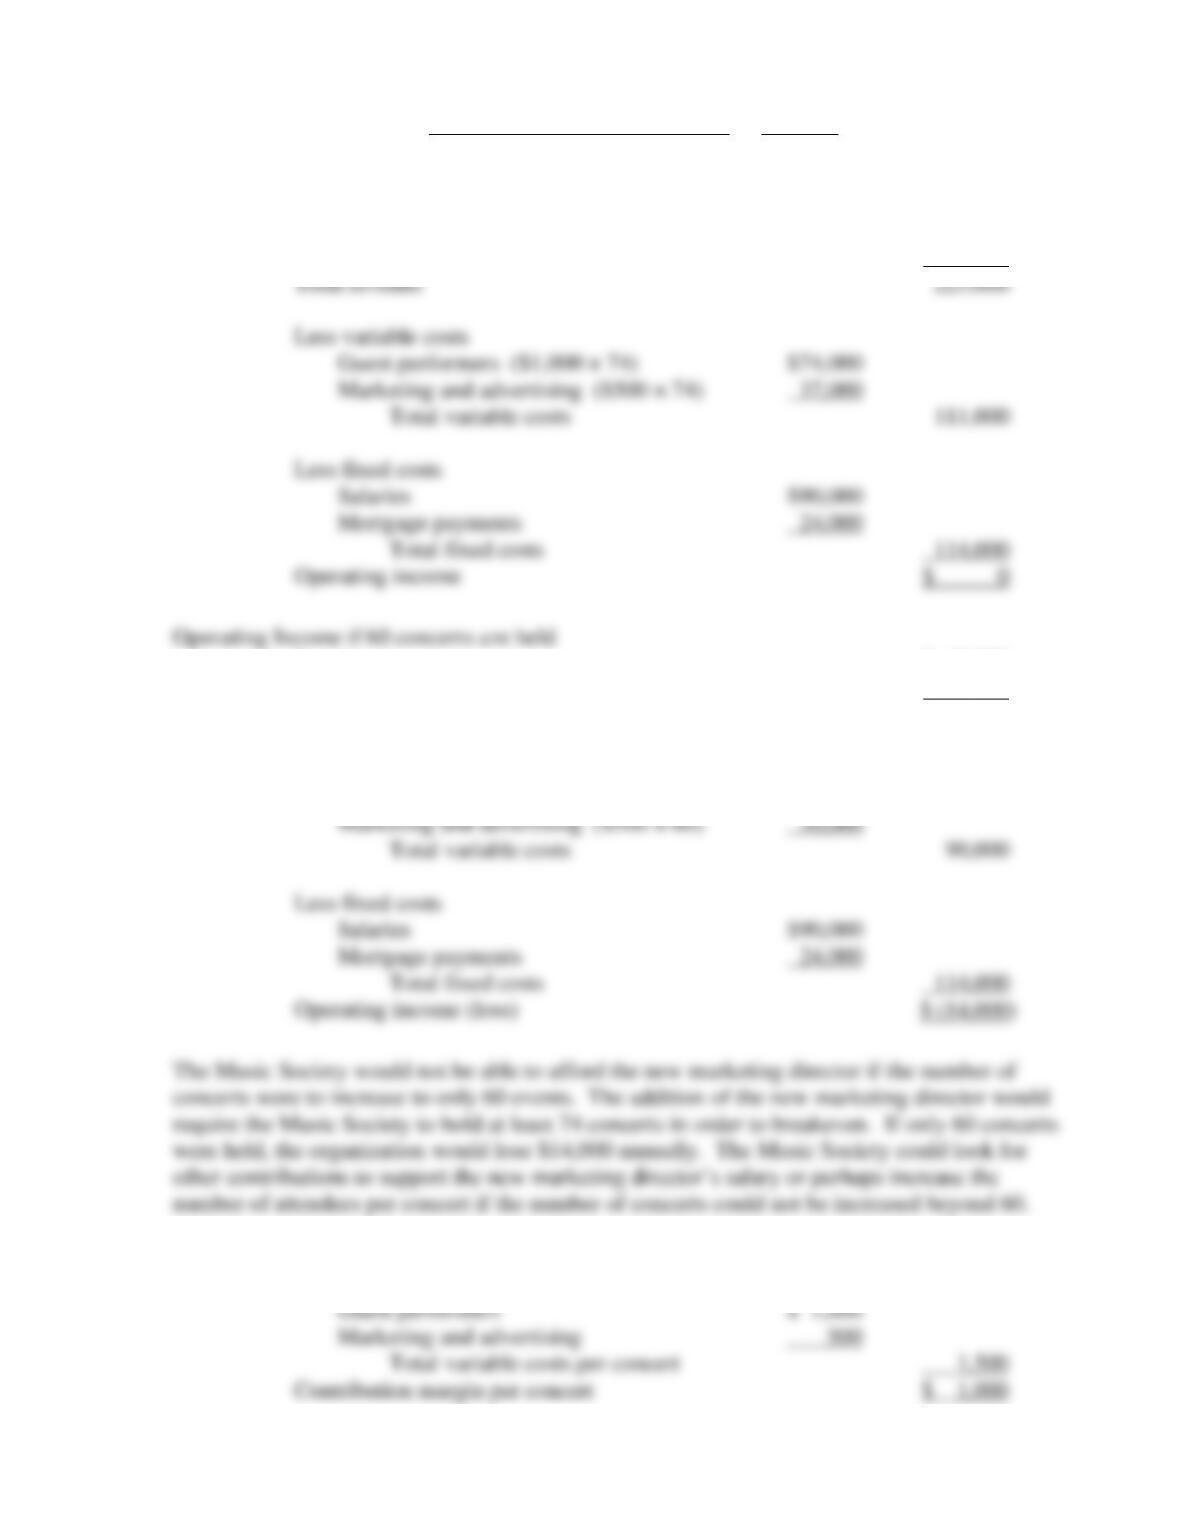
Less variable costs
Guest performers ($1,000 × 74)
$74,000
Marketing and advertising ($500 × 74)
37,000
Total variable costs
111,000
Less fixed costs
Salaries
$90,000
Mortgage payments
24,000
Total fixed costs
114,000
Operating income
$ 0
Operating Income if 60 concerts are held
Donations
$ 40,000
Revenue ($2,500 × 60)
150,000
Total revenue
190,000
Less variable costs
Guest performers ($1,000 × 60)
$60,000
Marketing and advertising ($500 × 60)
30,000
Total variable costs
90,000
Less fixed costs
Salaries
$90,000
Mortgage payments
24,000
Total fixed costs
114,000
Operating income (loss)
$ (14,000)
The Music Society would not be able to afford the new marketing director if the number of
concerts were to increase to only 60 events. The addition of the new marketing director would
require the Music Society to hold at least 74 concerts in order to breakeven. If only 60 concerts
were held, the organization would lose $14,000 annually. The Music Society could look for
other contributions to support the new marketing director’s salary or perhaps increase the
number of attendees per concert if the number of concerts could not be increased beyond 60.
3. Ticket sales per concert
$ 2,500
Variable costs per concert:
Guest performers
$ 1,000
Marketing and advertising
500
Total variable costs per concert
1,500
Contribution margin per concert
$ 1,000
3-22
Fixed costs
Salaries ($50,000 + $40,000)
$90,000
Mortgage payments ($2,000 × 12)
24,000
Total fixed costs
$114,000
Deduct donations
60,000
Net fixed costs
$ 54,000
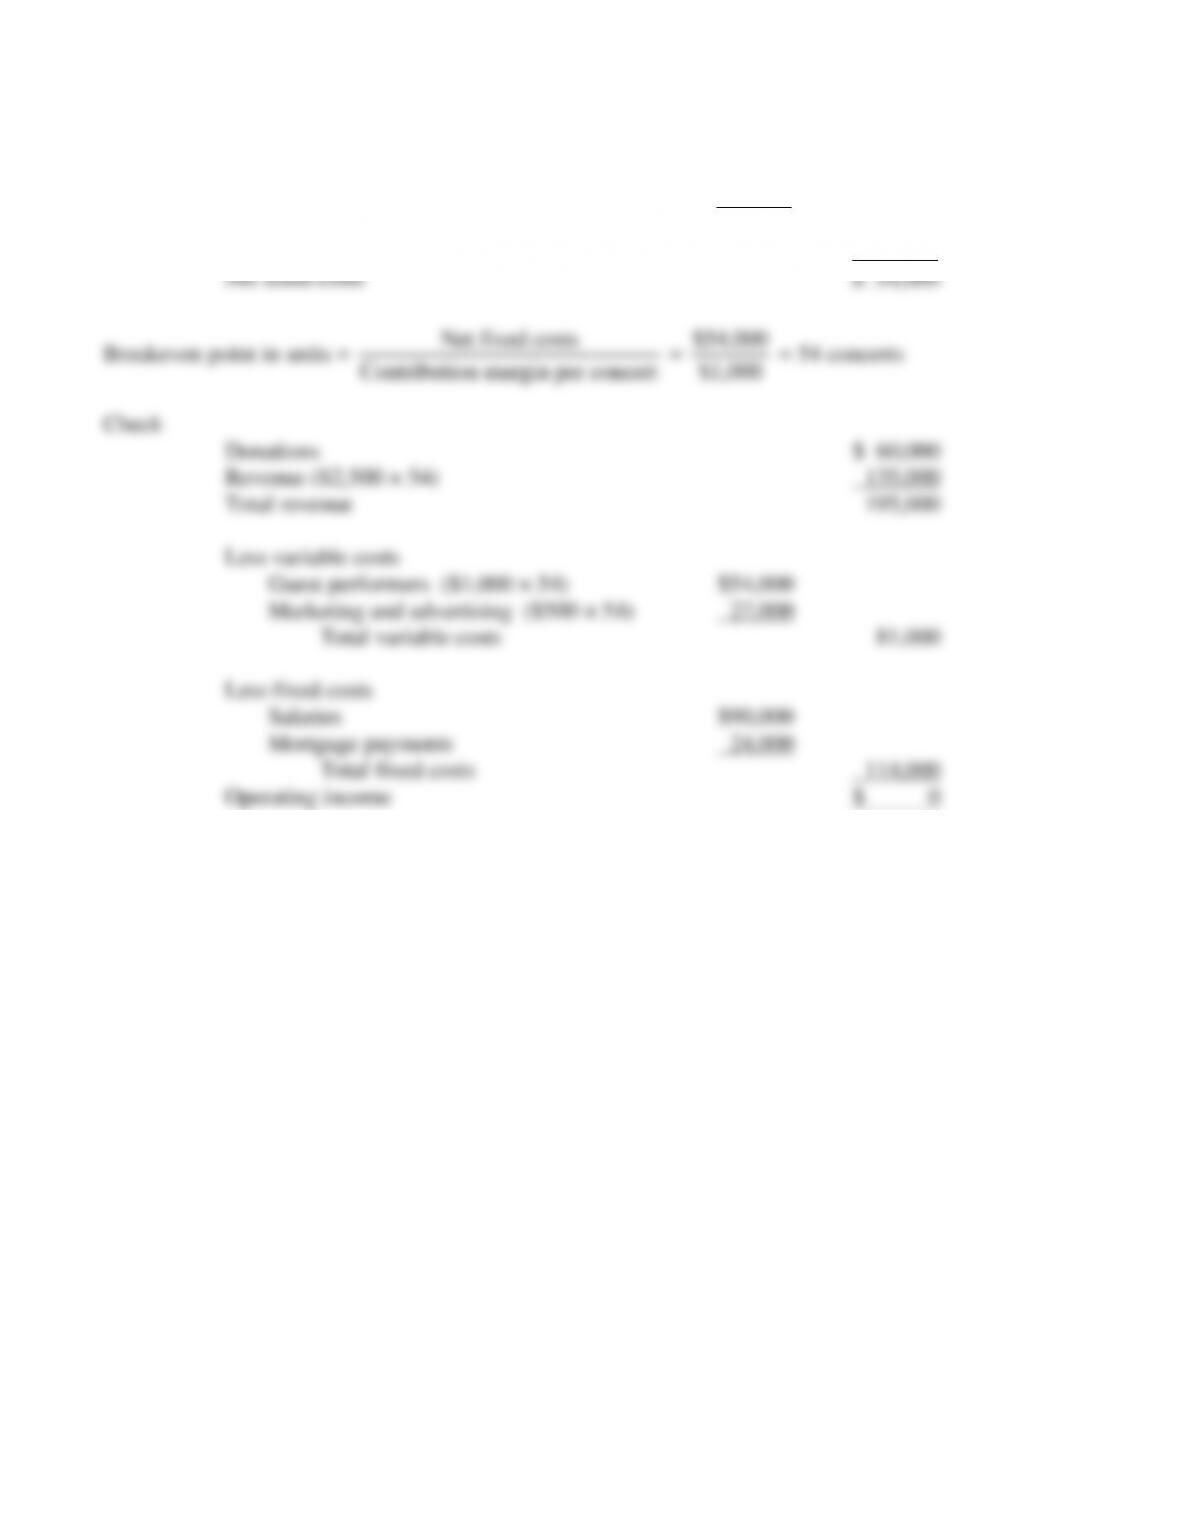
Breakeven point in units =
Net fixed costs
Contribution margin per concert
=
$54,000
$1,000
= 54 concerts
Check
Donations
$ 60,000
Revenue ($2,500 × 54)
135,000
Total revenue
195,000
Less variable costs
Guest performers ($1,000 × 54)
$54,000
Marketing and advertising ($500 × 54)
27,000
Total variable costs
81,000
Less fixed costs
Salaries
$90,000
Mortgage payments
24,000
Total fixed costs
114,000
Operating income
$ 0
3-23
3-30 (15 min.) Contribution margin, decision making.
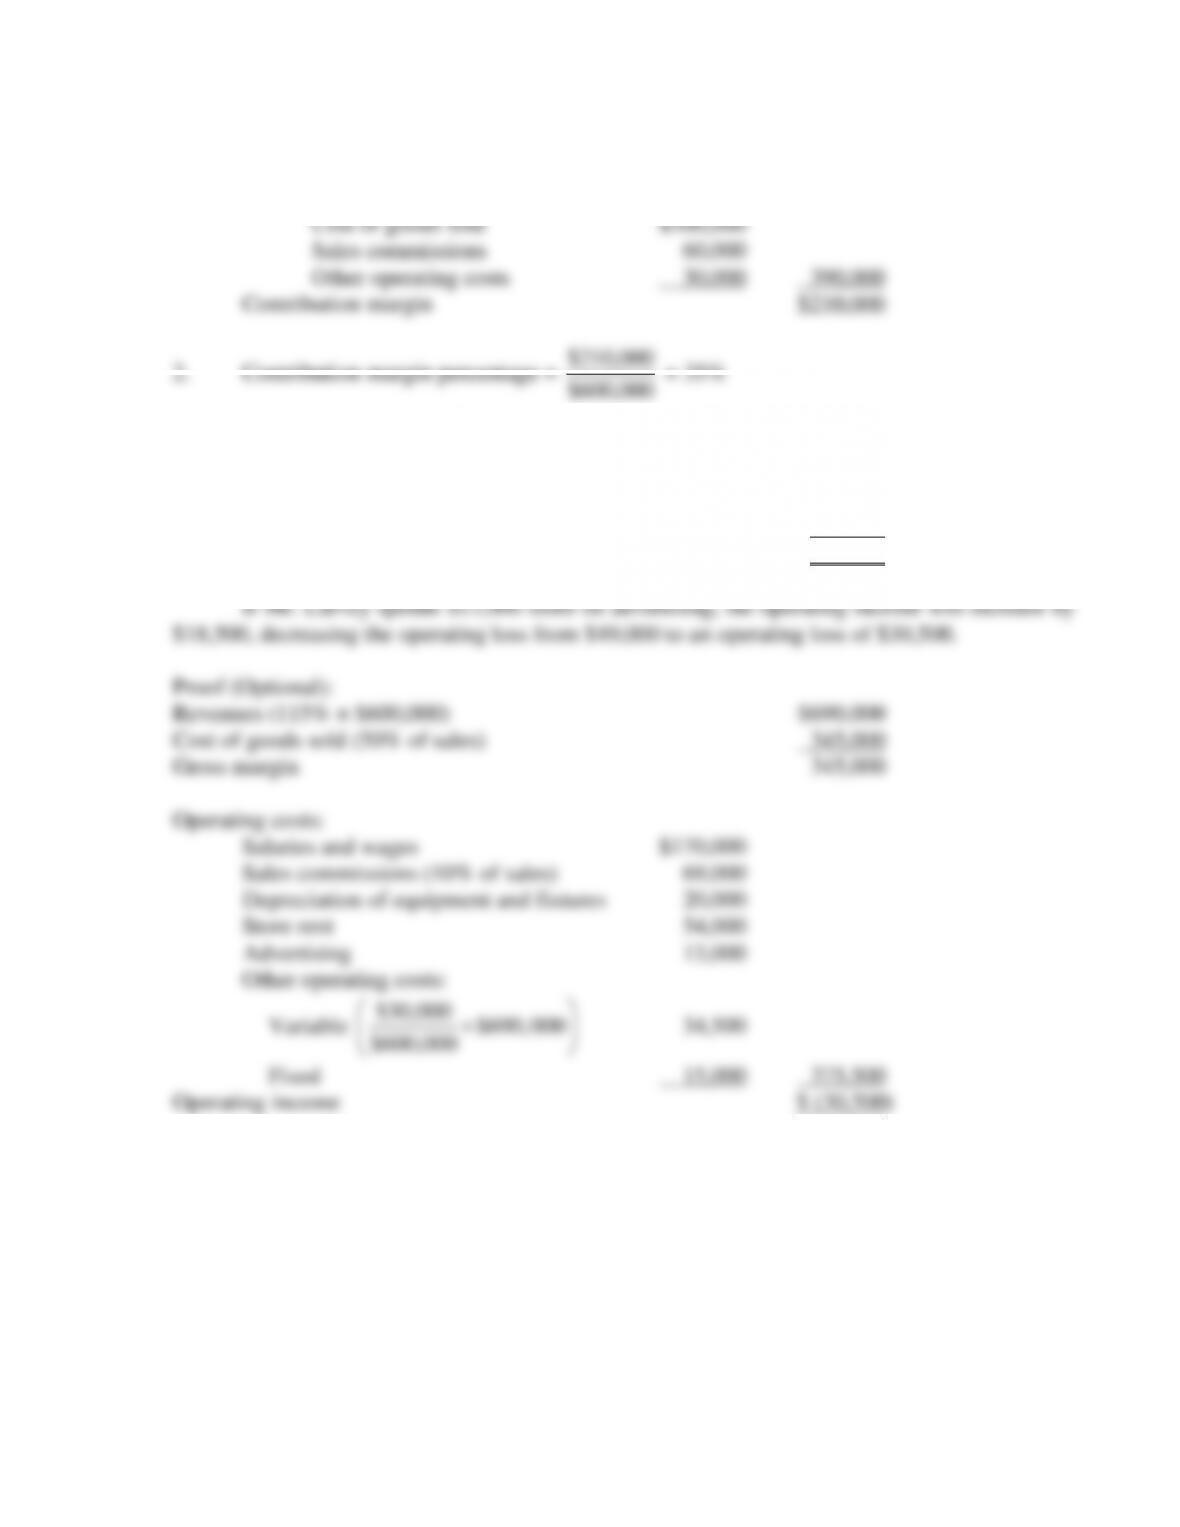
1. Revenues $600,000
Deduct variable costs:
$600,000
3. Incremental revenue (15% × $600,000) = $90,000
Incremental contribution margin
(35% × $90,000) $31,500
Incremental fixed costs (advertising) 13,000
Incremental operating income $18,500
3-24
1.
Mirabella Cosmetics
Operating Income Statement, June 2011
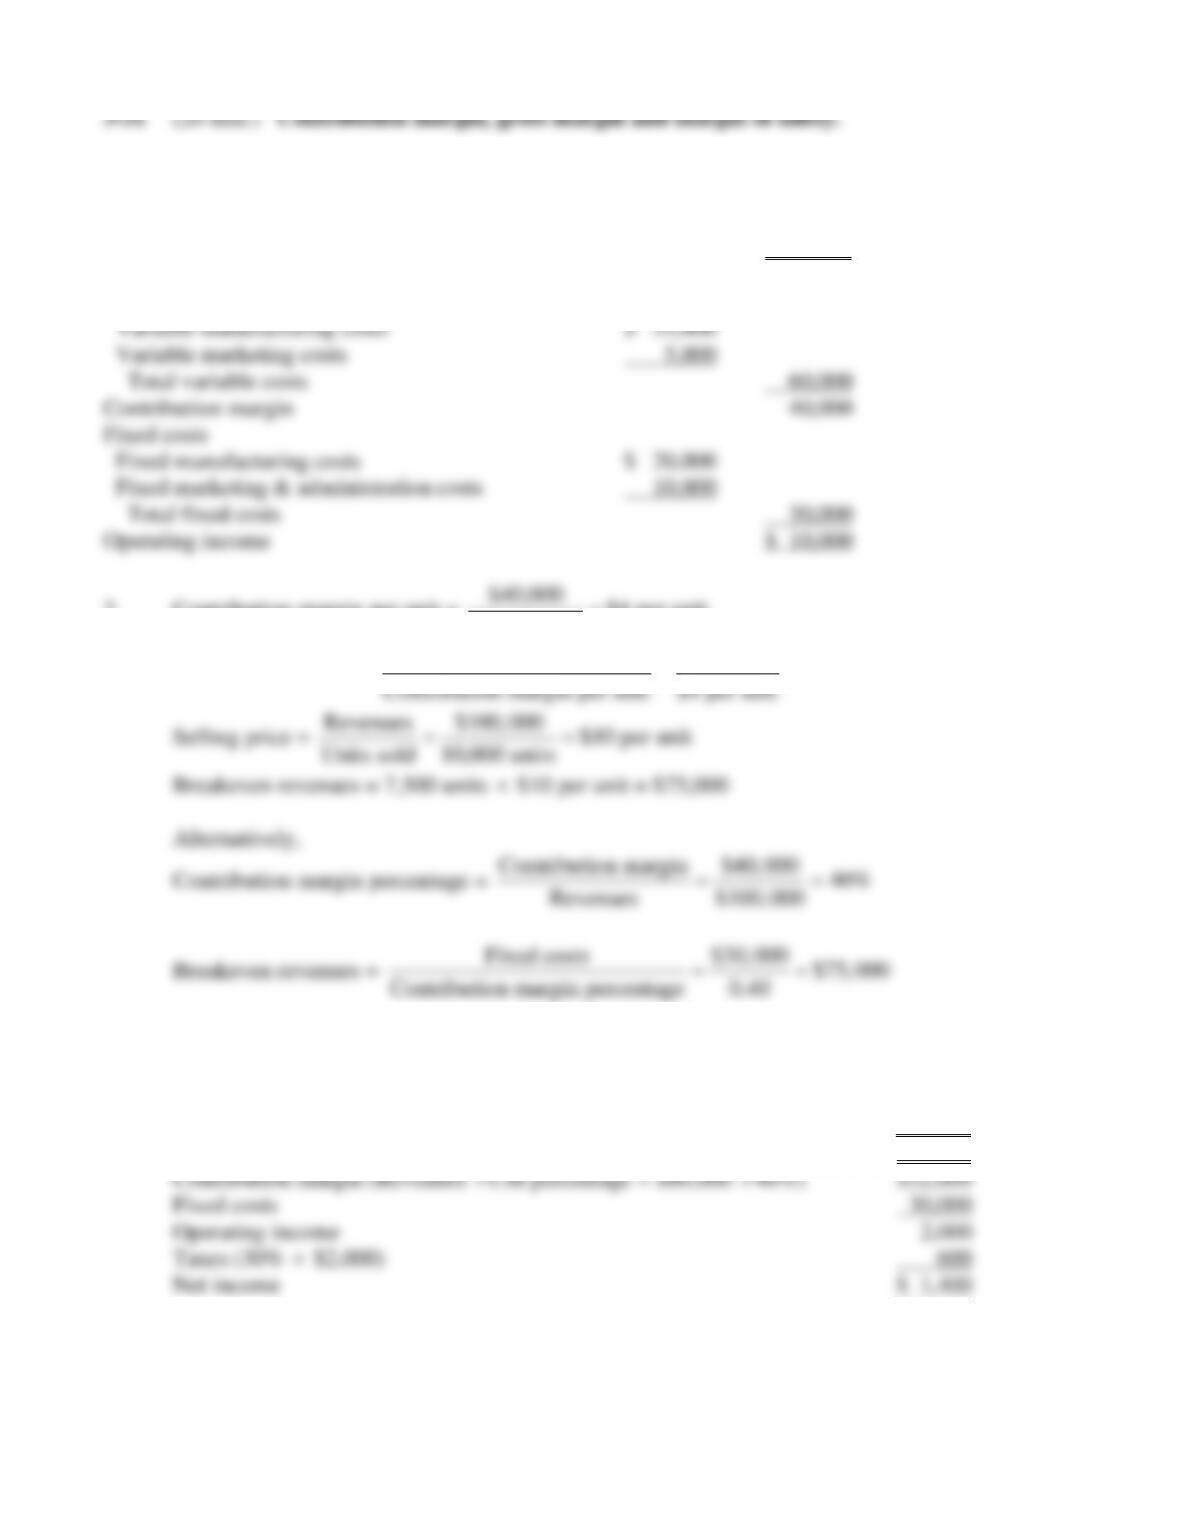
Units sold
10,000
Revenues
$100,000
Variable costs
Variable manufacturing costs
$ 55,000
Variable marketing costs
5,000
Total variable costs
60,000
Contribution margin
40,000
Fixed costs
Fixed manufacturing costs
$ 20,000
Fixed marketing & administration costs
10,000
Total fixed costs
30,000
Operating income
$ 10,000
2. Contribution margin per unit =
$40,000 $4 per unit
10,000 units =
Breakeven quantity =
Fixed costs $30,000 7,500 units
Contribution margin per unit $4 per unit
==
Revenues $100,000 $10 per unit
Contribution margin percentage 0.40
3. Margin of safety (in units) = Units sold – Breakeven quantity
= 10,000 units – 7,500 units = 2,500 units
4. Units sold 8,000
Revenues (Units sold
Selling price = 8,000
$10) $80,000
3-25
3-32 (30 min.) Uncertainty and expected costs.
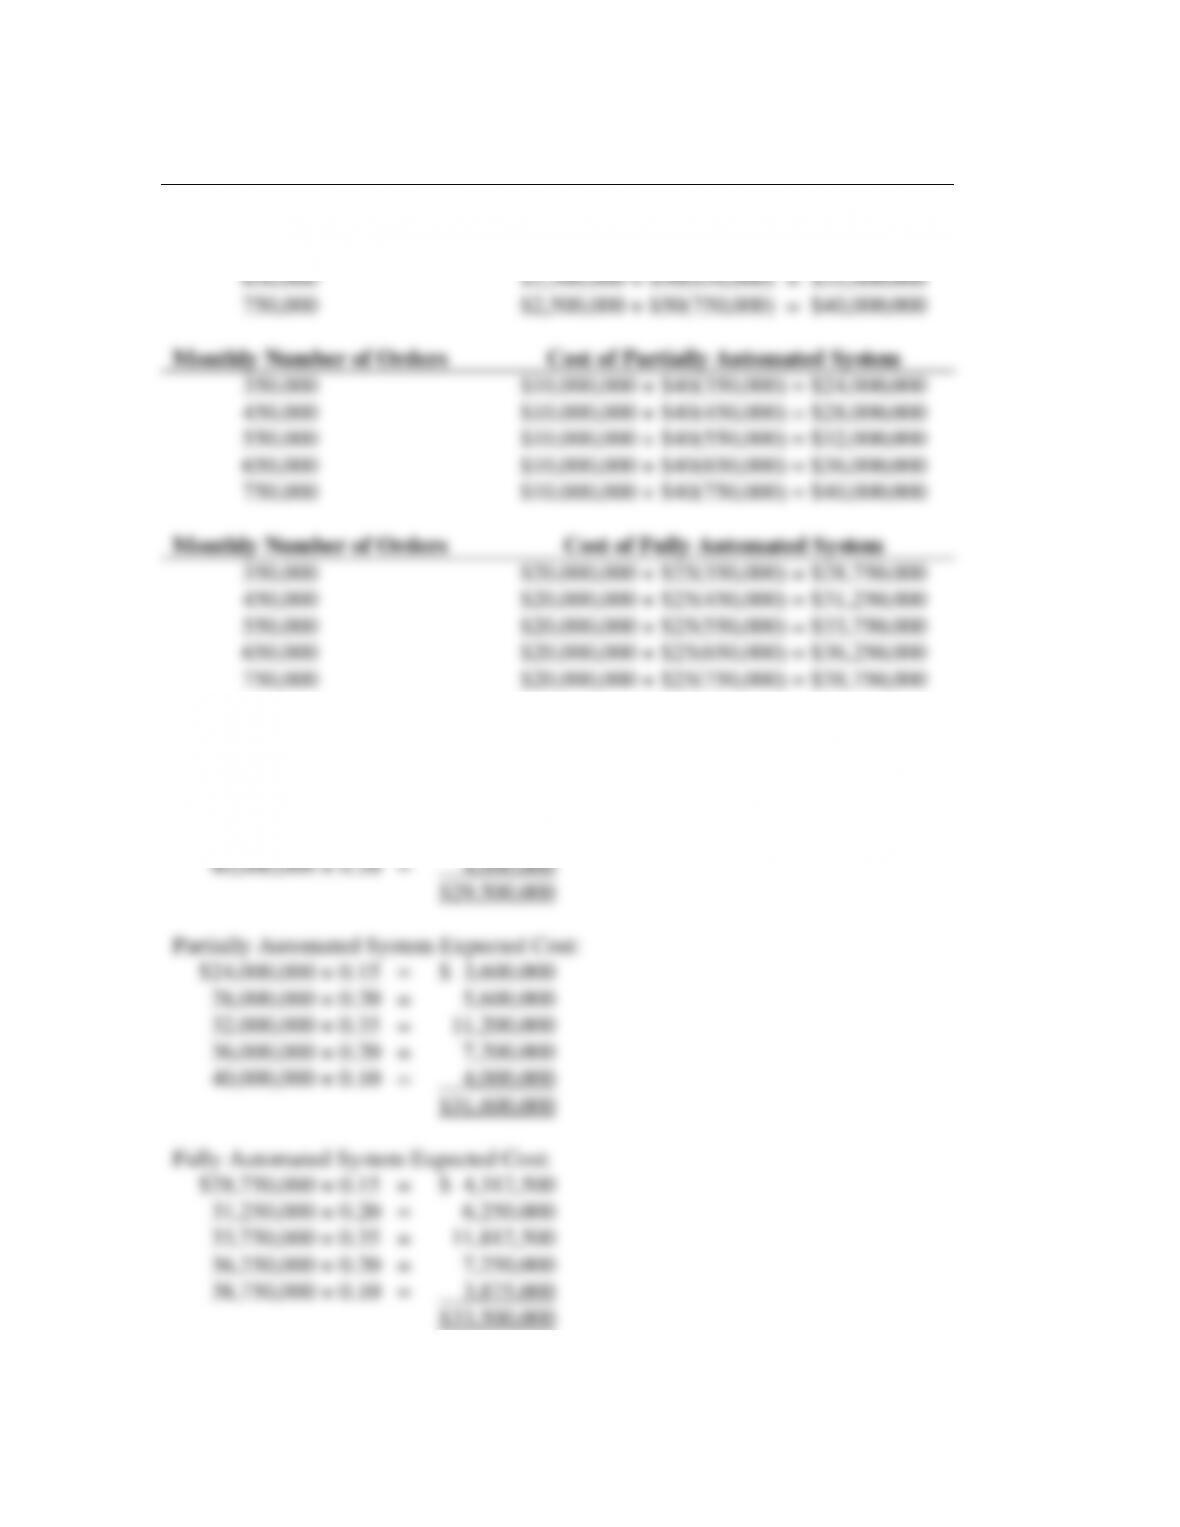
1. Monthly Number of Orders
Cost of Current System
350,000 $2,500,000 + $50(350,000) = $20,000,000
450,000 $2,500,000 + $50(450,000) = $25,000,000
550,000 $2,500,000 + $50(550,000) = $30,000,000
2. Current System Expected Cost:
$20,000,000 × 0.15 = $ 3,000,000
25,000,000 × 0.20 = 5,000,000
30,000,000 × 0.35 = 10,500,000
35,000,000 × 0.20 = 7,000,000
3. Foodmart should consider the impact of the different systems on its relationship with
suppliers. The interface with Foodmart’s system may require that suppliers also update their
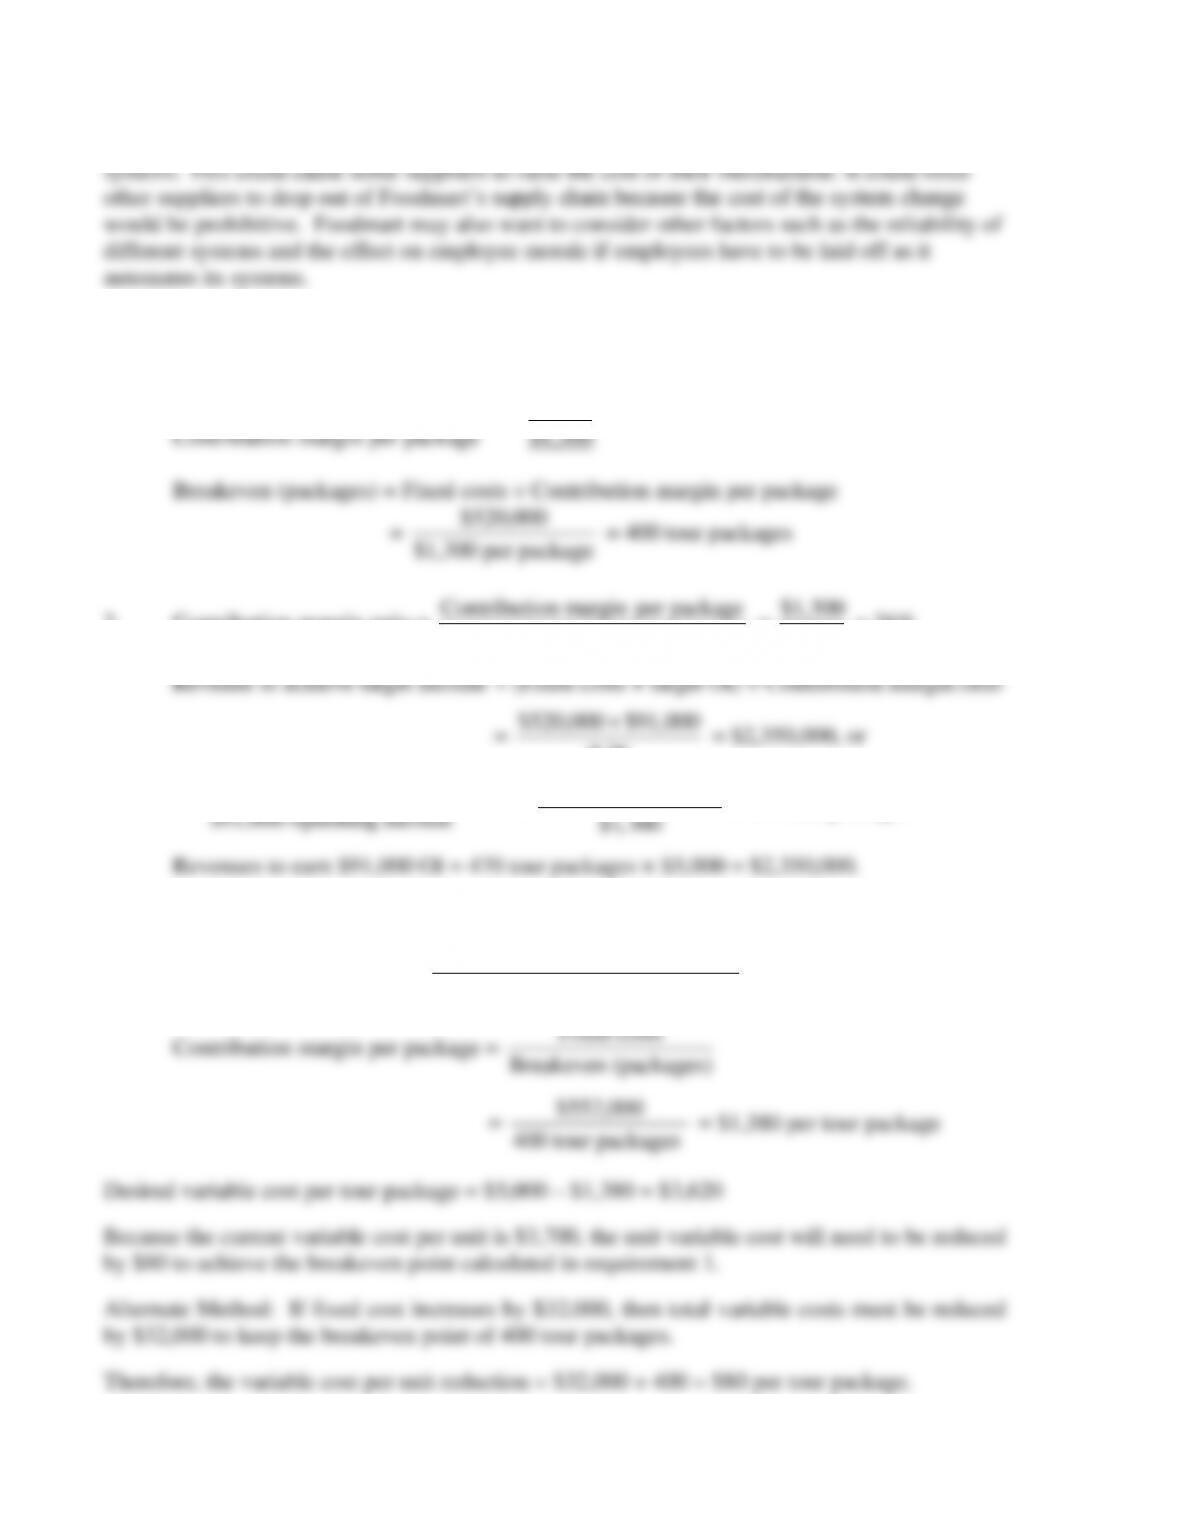
3-33 (15–20 min.) CVP analysis, service firm.
1. Revenue per package $5,000
Variable cost per package 3,700
2. Contribution margin ratio =
price Selling
packageper margin on Contributi
=
$1,300
$5,000
= 26%
3-27
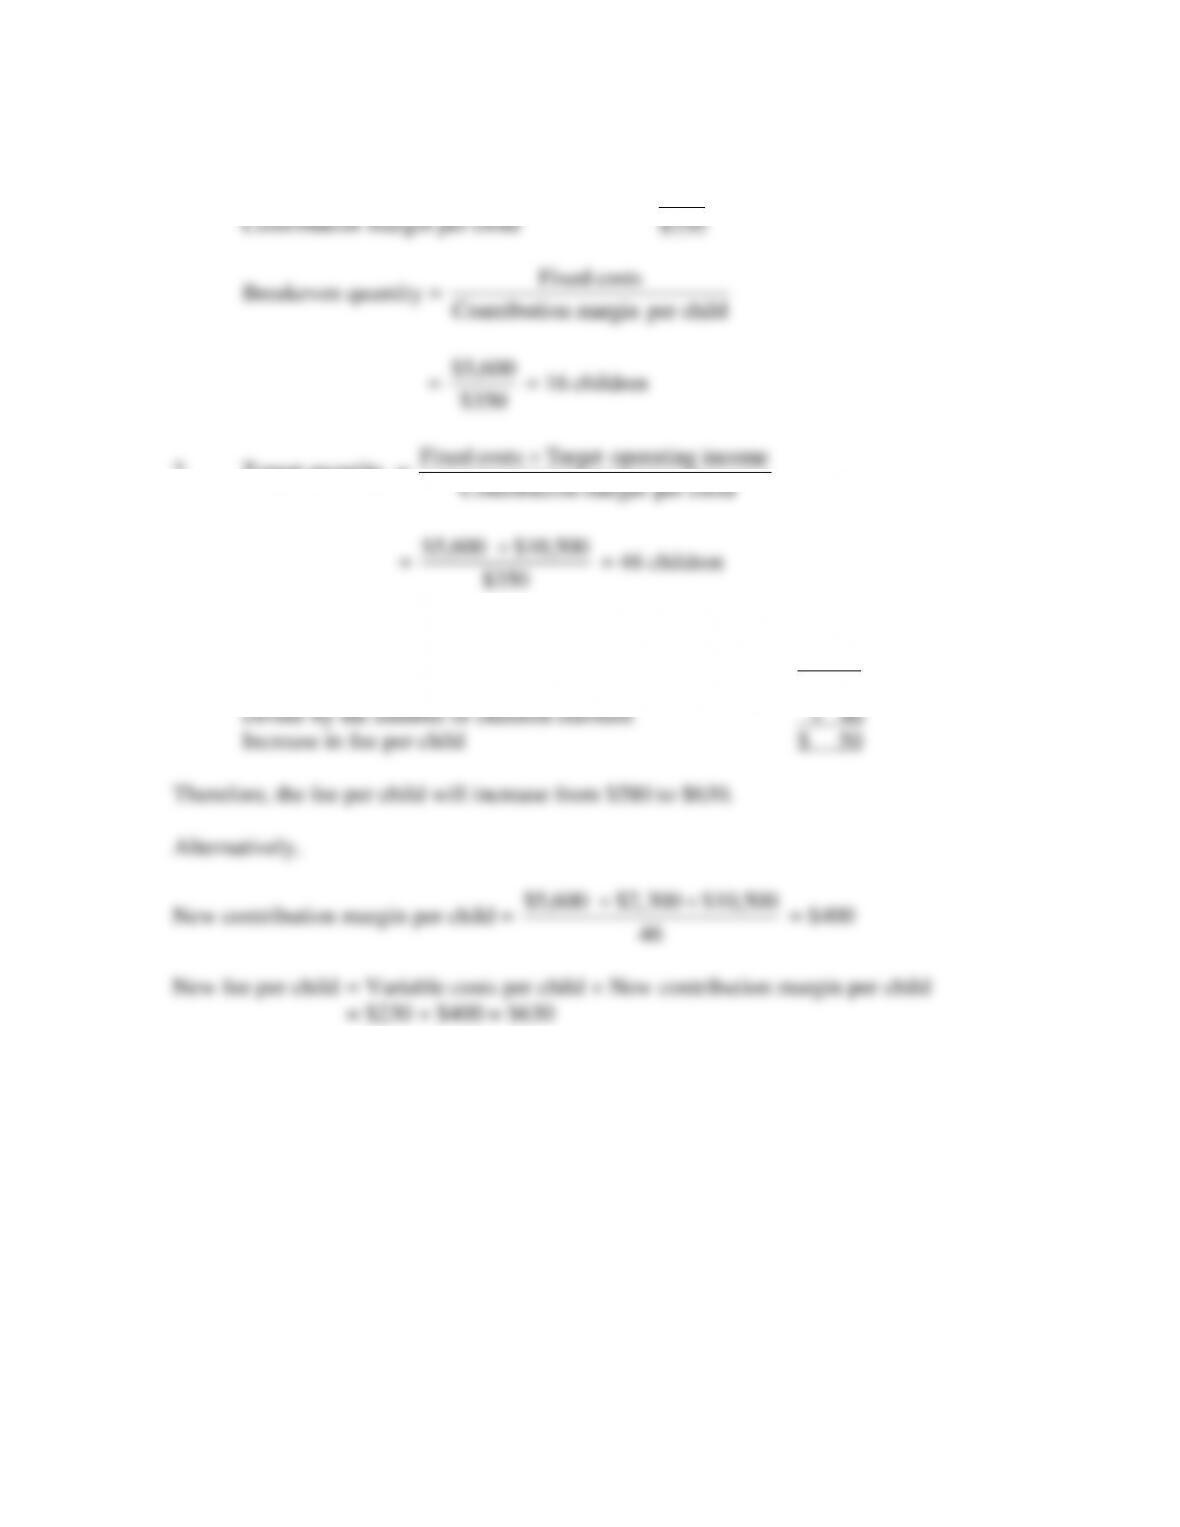
3-34 (30 min.) CVP, target operating income, service firm.
1. Revenue per child $580
Variable costs per child 230
2. Target quantity =
childper margin on Contributi
income operatingTarget costs Fixed +
$350
3. Increase in rent ($3,150 – $2,150) $1,000
Field trips 1,300
Total increase in fixed costs $2,300
3-28
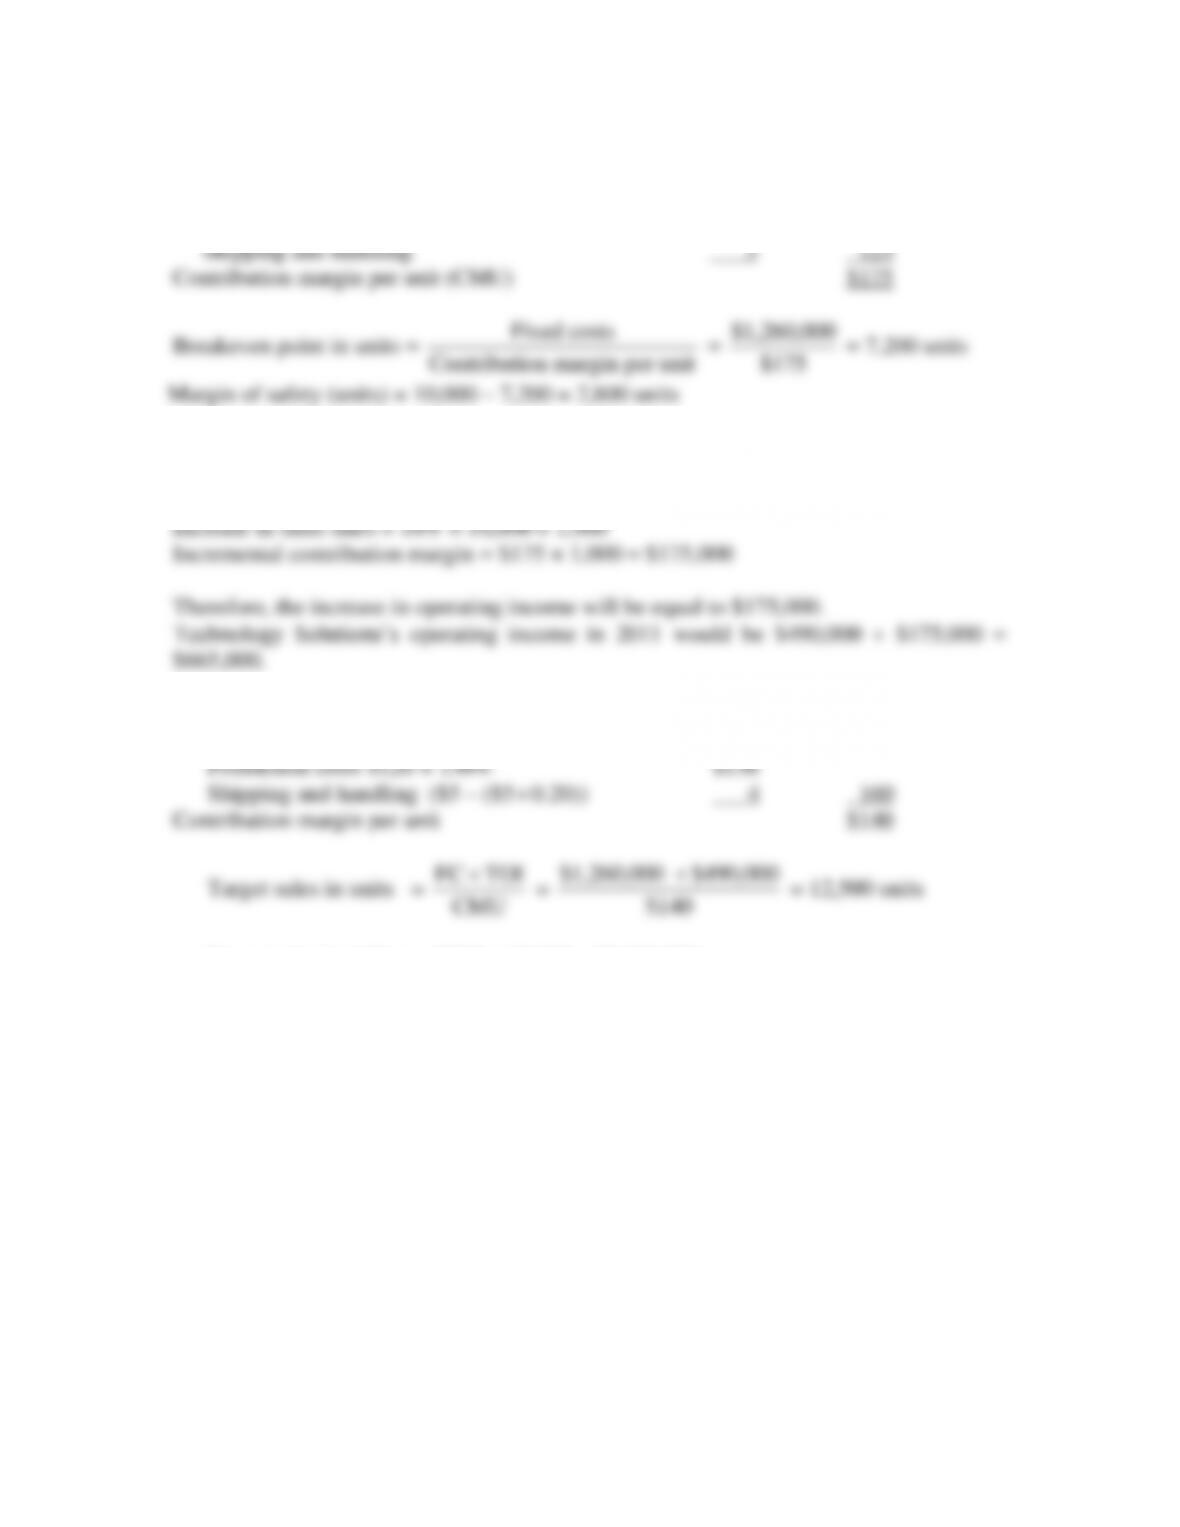
3-35 (20–25 min.) CVP analysis.
1. Selling price $300
Variable costs per unit:
Production costs $120
2. Since fixed costs remain the same, any incremental increase in sales will increase
contribution margin and operating income dollar for dollar.
3. Selling price $300
Variable costs:
3-29
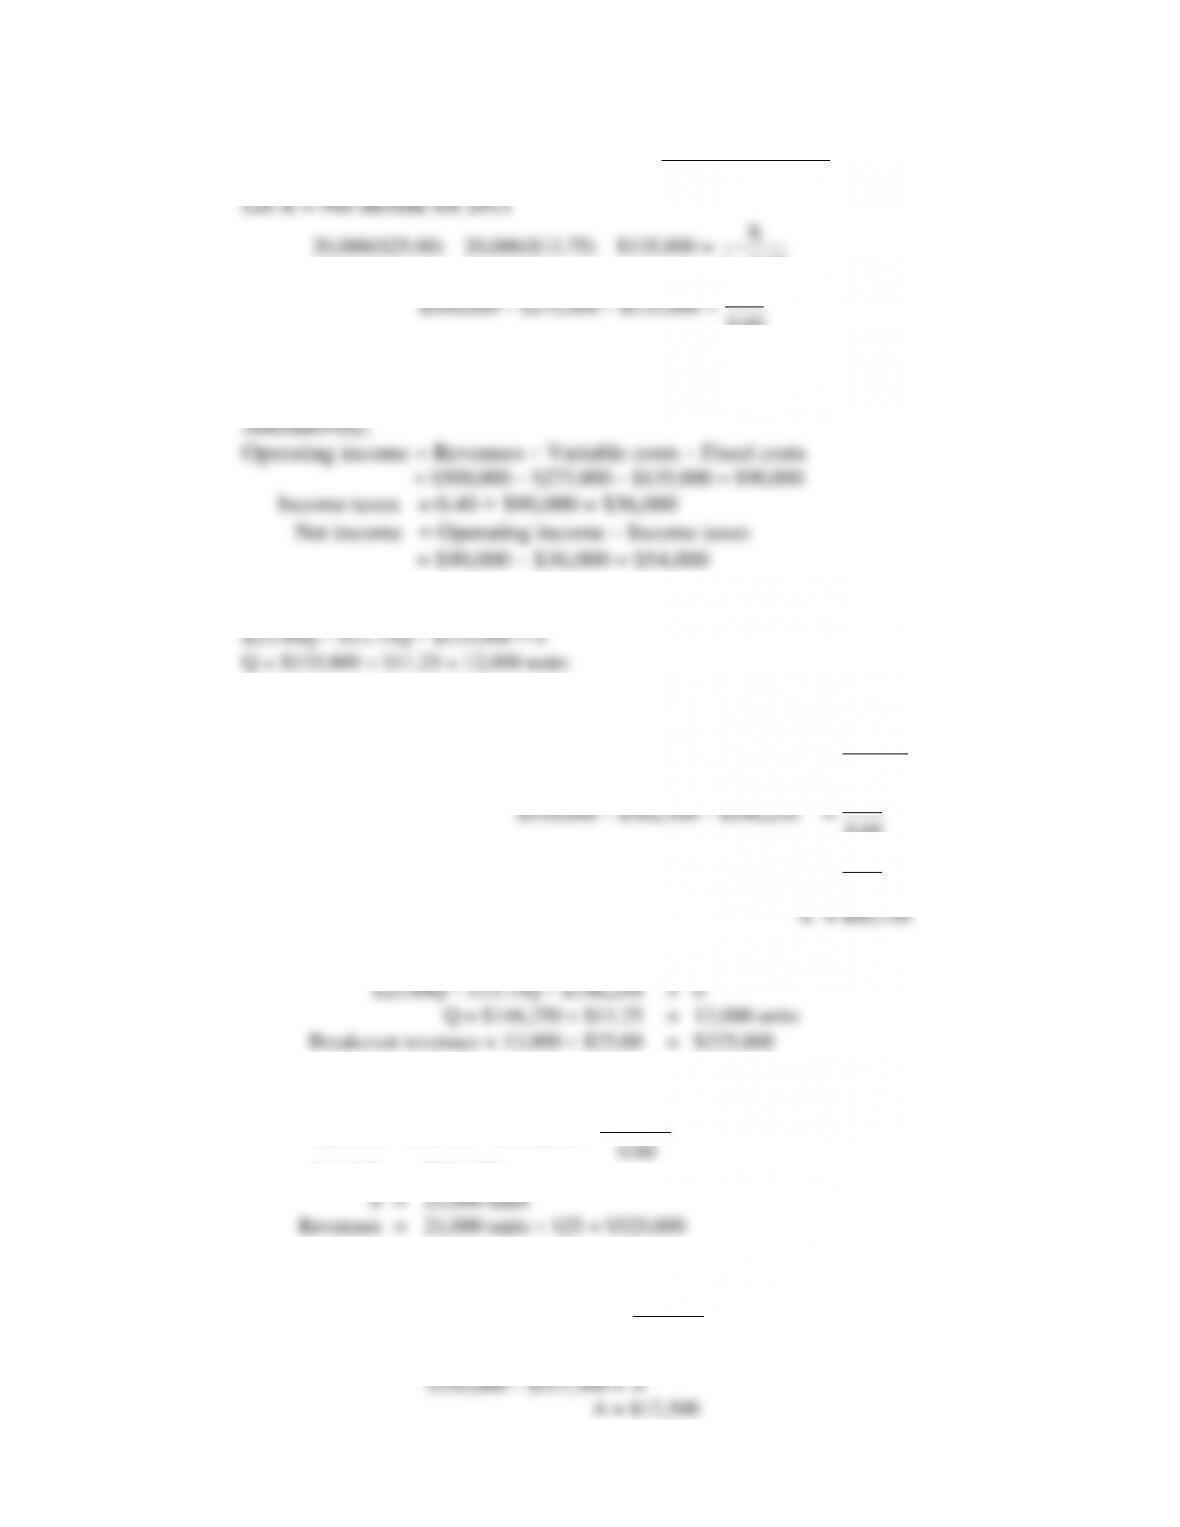
3-36 (30–40 min.) CVP analysis, income taxes.
1. Revenues – Variable costs – Fixed costs =
rateTax 1
incomenet Target
−
1 0.40−
0.60
$300,000 – $165,000 – $81,000 = X
X = $54,000
2. Let Q = Number of units to break even
3. Let X = Net income for 2012
22,000($25.00) – 22,000($13.75) – ($135,000 + $11,250) =
X
1 0.40−
X
0.60
$101,250 =
X
0.60
4. Let Q = Number of units to break even with new fixed costs of $146,250
5. Let S = Required sales units to equal 2011 net income
$54,000
0.60
$11.25S = $236,250
6. Let A = Amount spent for advertising in 2012
$550,000 – $302,500 – ($135,000 + A) =
$60,000
0.60
$550,000 – $302,500 – $135,000 – A = $100,000
X
3-30
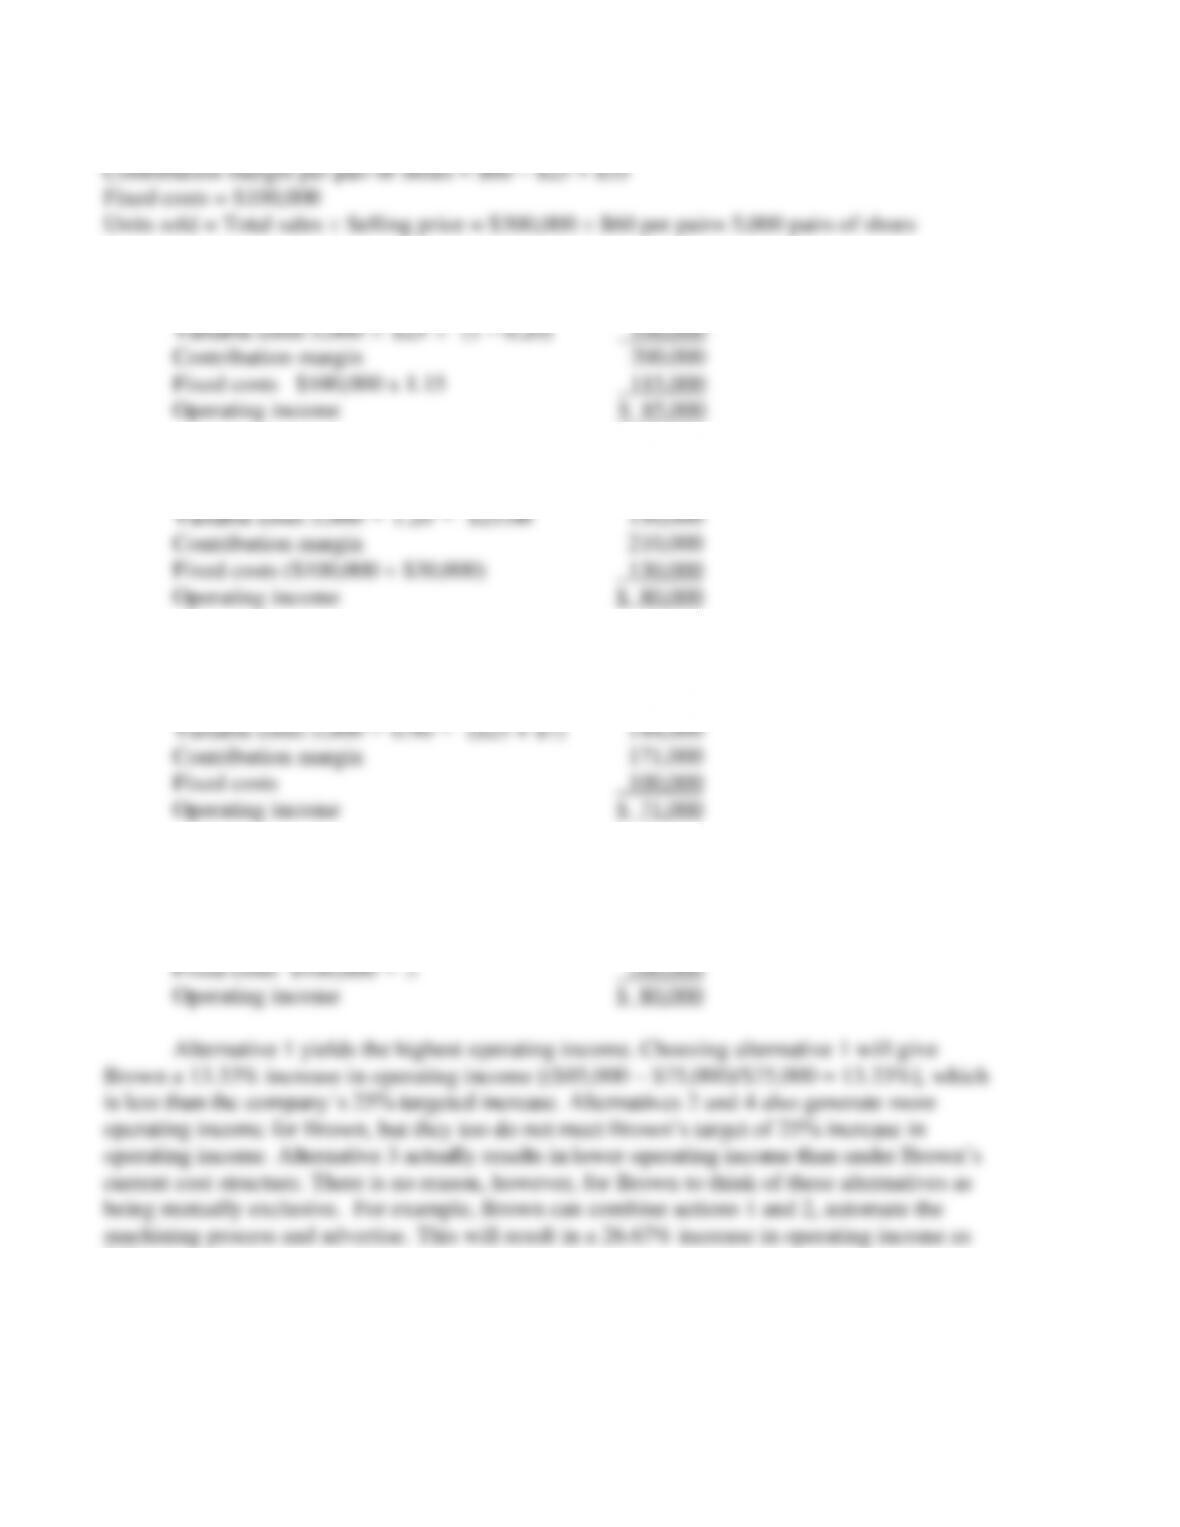
3-37 (25 min.) CVP, sensitivity analysis.
1. Variable costs decrease by 20%; Fixed costs increase by 15%
Sales revenues 5,000
$60 $300,000
2. Increase advertising (fixed costs) by $30,000; Increase sales 20%
Sales revenues 5,000
1.20
$60.00 $360,000
3. Increase selling price by $10.00; Sales decrease 10%; Variable costs increase by $7
Sales revenues 5,000
0.90
($60 + $10) $315,000
4. Double fixed costs; Increase sales by 60%
Sales revenues 5,000
1.60
$60 $480,000
Variable costs 5,000
1.60
$25 200,000
Contribution margin 280,000
follows: