23-1
CHAPTER 23
23-1 Examples of financial and nonfinancial measures of performance are:
Financial: ROI, residual income, economic value added, and return on sales.
23-2 The three steps in designing an accounting-based performance measure are:
2. Choose the details of each performance measure in Step 1, including the time horizon and
measurement of various aspects of the measure
23-3 The DuPont method highlights that ROI is increased by any action that increases return
on sales or investment turnover. ROI increases with:
2. decreases in costs, or
23-4 Yes. Residual income (RI) is not identical to return on investment (ROI). ROI is a
23-5 Economic value added (EVA) is a specific type of residual income measure that is
added (EVA)
operating income
( )
cost of capital current liabilities
23-6 Definitions of investment used in practice when computing ROI are:
2. Total assets employed
4. Stockholders’ equity
23-2
23-7 Current cost is the cost of purchasing an asset today identical to the one currently held if
an identical asset can currently be purchased; it is the cost of purchasing an asset that provides
23-8 Special problems arise when evaluating the performance of divisions in multinational
companies because
a. The economic, legal, political, social, and cultural environments differ significantly
23-9 In some cases, the subunit’s performance may not be a good indicator of a manager’s
performance. For example, companies often put the most skillful division manager in charge of
the weakest division in an attempt to improve the performance of the weak division. Such an
23-10 Moral hazard describes situations in which an employee prefers to exert less effort (or to
23-11 No, rewarding managers on the basis of their performance measures only, such as ROI,
subjects them to uncontrollable risk because managers’ performance measures are also affected
by random factors over which they have no control. A manager may put in a great deal of effort
23-3
23-12 Benchmarking or relative performance evaluation is the process of evaluating a
manager’s performance against the performance of other similar operations. The ideal
23-13 When employees have to perform multiple tasks as part of their jobs, incentive problems
can arise when one task is easy to monitor and measure while the other task is more difficult to
23-14 Disclosures required by the Securities and Exchange Commission are:
a. A summary compensation table showing the salary, bonus, stock options, other stock
23-15 The four levers of control in an organization are diagnostic control systems, boundary
systems, belief systems and interactive control systems.
• Diagnostic control systems are the set of critical performance variables that help
managers track progress toward the strategic goal. These measures are periodically
23-4
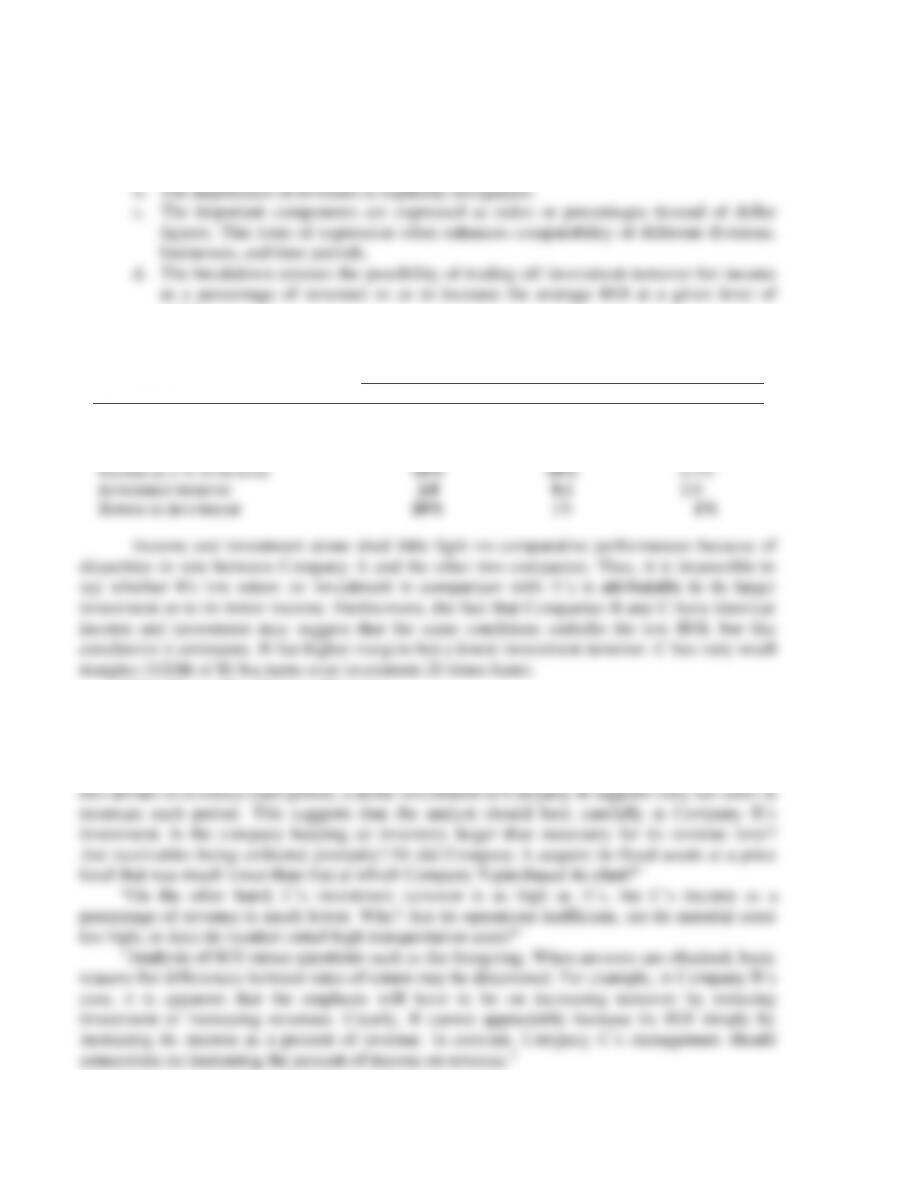
23-16 (30 min.) ROI, comparisons of three companies.
1. The separate components highlight several features of return on investment not revealed
by a single calculation:
a. The importance of investment turnover as a key to income is stressed.
output.
2. (Filled-in blanks are in bold face.)
Companies in Same Industry
A
B
C
Revenue
Income
Investment
Income as a % of revenue
Investment turnover
Return on investment
$1,000,000
$ 100,000
$ 500,000
10%
2.0
20%
$ 500,000
$ 50,000
$5,000,000
10%
0.1
1%
$10,000,000
$ 50,000
$ 5,000,000
0.5%
2.0
1%
Income and investment alone shed little light on comparative performances because of
disparities in size between Company A and the other two companies. Thus, it is impossible to
say whether B’s low return on investment in comparison with A’s is attributable to its larger
investment or to its lower income. Furthermore, the fact that Companies B and C have identical
income and investment may suggest that the same conditions underlie the low ROI, but this
conclusion is erroneous. B has higher margins but a lower investment turnover. C has very small
margins (1/20th of B) but turns over investment 20 times faster.
I.M.A. Report No. 35 (page 35) states:
“Introducing revenues to measure level of operations helps to disclose specific areas for
more intensive investigation. Company B does as well as Company A in terms of income
margin, for both companies earn 10% on revenues. But Company B has a much lower turnover
of investment than does Company A. Whereas a dollar of investment in Company A supports
23-5
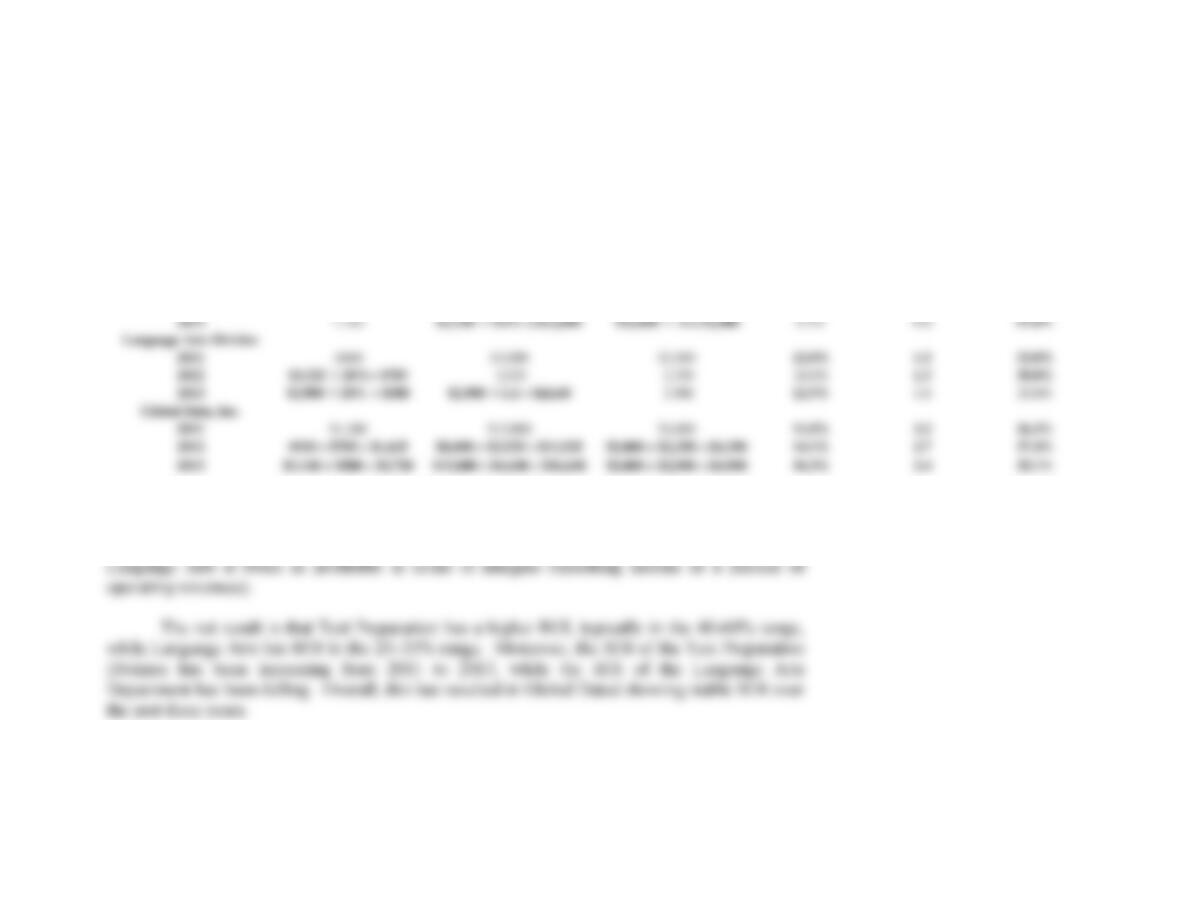
23-17 (30 min.) Analysis of return on invested assets, comparison of two divisions, DuPont method.
1.
Operating Income
Operating Revenues
Total Assets
Operating
Income
Operating
Revenues
Operating
Revenues
Total Assets
Operating
Income
Total Assets
Test Preparation Division
2011
$720
$9,000
$1,800
8.0%
5.0
40.0%
2012
920
$920
11.5% = $8,000
$920
46% = $2,000
11.5%
4.0
46.0%
2013
1,140
$1,140
9.5% = $12,000
$12,000
6 = $2,000
9.5%
6.0
57.0%
Language Arts Division
2011
$660
$3,000
$2,000
22.0%
1.5
33.0%
2012
$3,525
20%= $705
3,525
2,350
20.0%
1.5
30.0%
2013
$2,900
20% = $580
$2,900
1.6 = $4,640
2,900
12.5%
1.6
20.0%
Global Data, Inc.
2011
$1,380
$12,000
$3,800
11.5%
3.2
36.3%
2012
$920 + $705 = $1,625
$8,000 + $3,525 = $11,525
$2,000 + $2,350 = $4,350
14.1%
2.7
37.4%
2013
$1,140 + $580 = $1,720
$12,000 + $4,640 = $16,640
$2,000 + $2,900 = $4,900
10.3%
3.4
35.1%
2. Based on revenues, Test Preparation is more than twice the size of Language Arts. In
addition, the Test Preparation Division turns over its assets at more than twice the rate of the
Language Arts Department (operating revenues as a multiple of total assets). However,
23-6
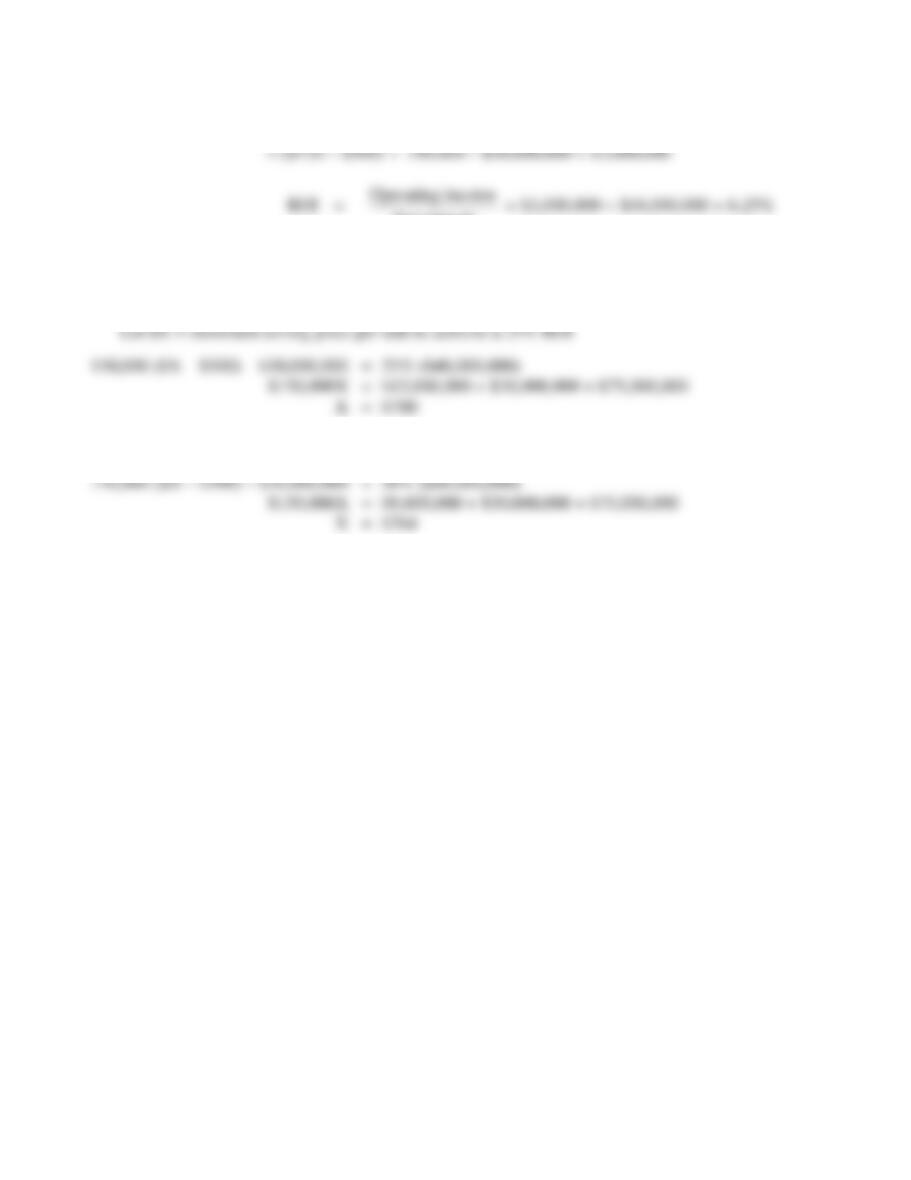
23-18 (10–15 min.) ROI and RI.
1. Operating income = (Contribution margin per unit
150,000 units) – Fixed costs
Investment
2. Operating income = ROI Investment
[No. of pairs sold (Selling price – Var. cost per unit)] – Fixed costs = ROI Investment
3. Let $X = minimum selling price per unit to achieve a 20% rate of return
23-7
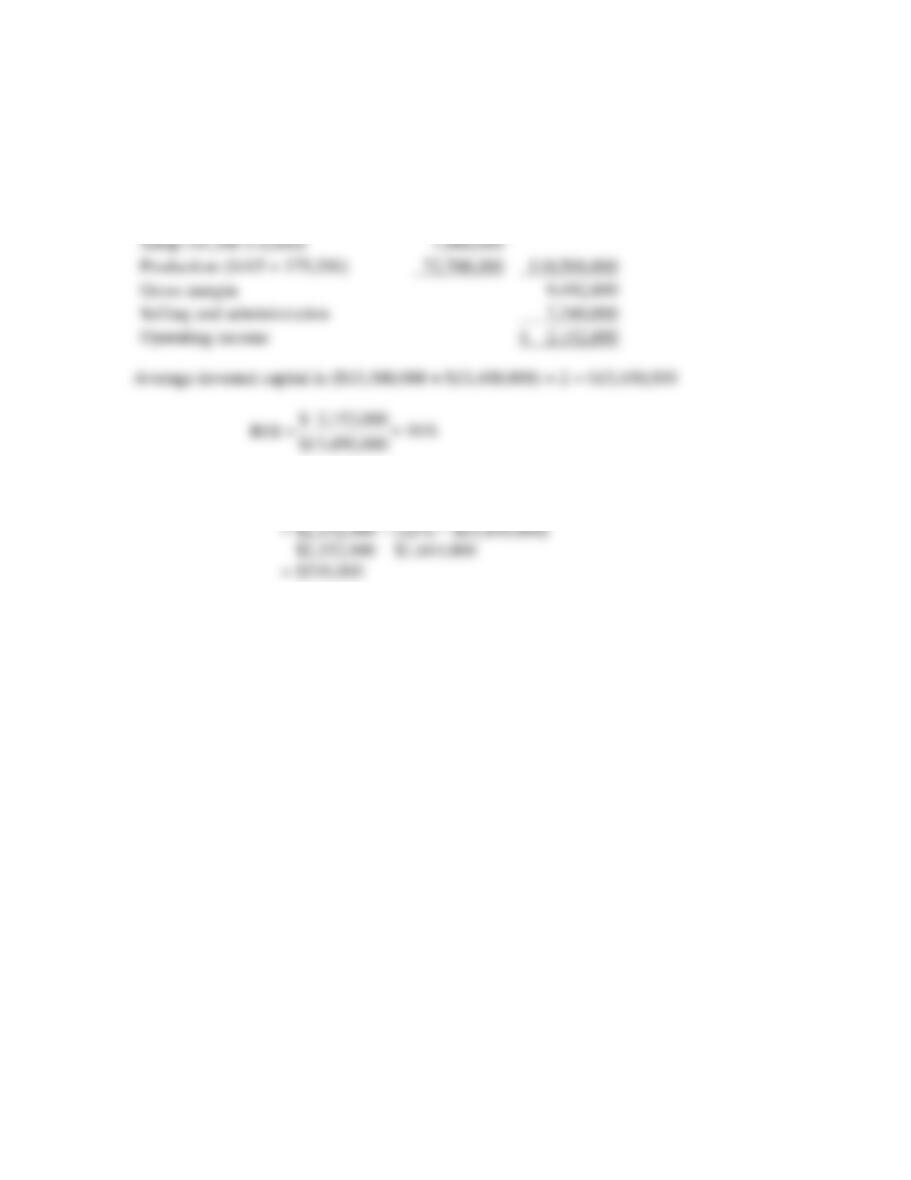
23-19 (20 min.) ROI and RI with manufacturing costs.
1. The operating income is:
Sales revenue ($12,000 × 10,000)
$120,000,000
Less:
Direct materials ($3,000 × 10,000)
$30,000,000
Setup ($1,300 × 6,000)
7,800,000
Production ($415 × 175,200)
72,708,000
110,508,000
Gross margin
9,492,000
Selling and administration
7,340,000
Operating income
$ 2,152,000
$13,450,000
2. Residual income = Operating income − (12% × Invested capital)
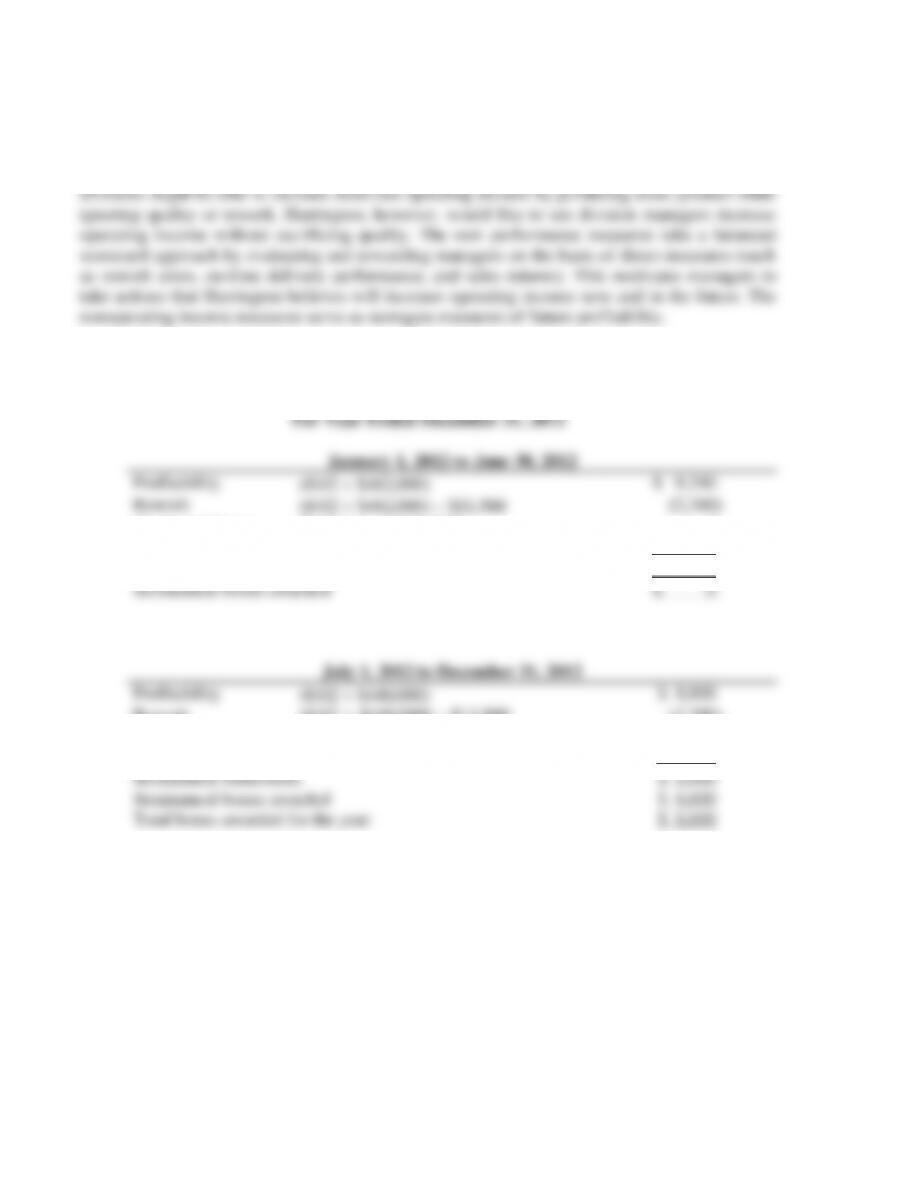
23-20 (25 min.) Financial and nonfinancial performance measures, goal congruence.
1. Operating income is a good summary measure of short-term financial performance. By
itself, however, it does not indicate whether operating income in the short run was earned by
taking actions that would lead to long-run competitive advantage. For example, Summit’s
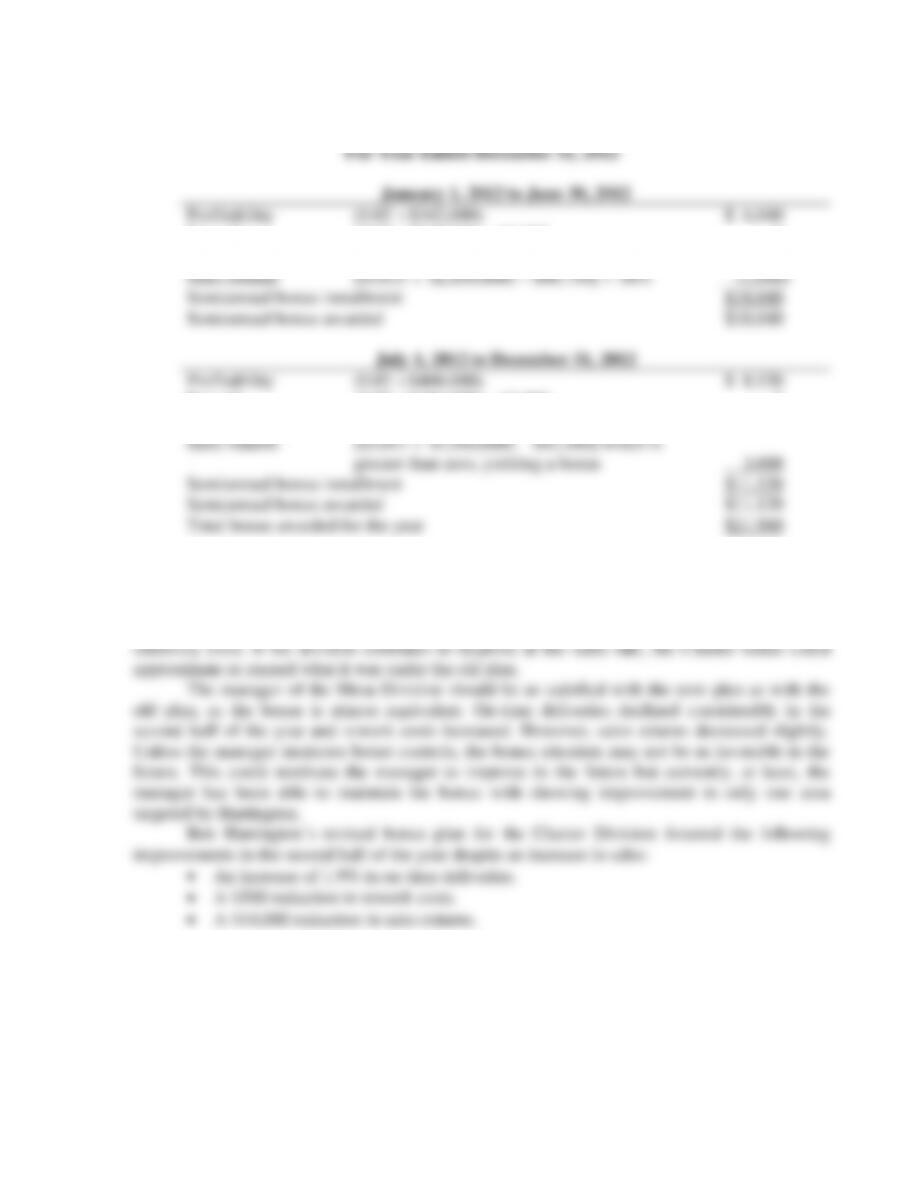
2. The semiannual installments and total bonus for the Charter Division are calculated as
follows: Charter Division Bonus Calculation
23-9
The semiannual installments and total bonus for the Mesa Division are calculated as follows:
Mesa Division Bonus Calculation
23-10
However, operating income as a percent of sales has decreased (11% to 10%).
The Mesa Division’s bonus has remained at the status quo as a result of the following
effects:
• An increase of 2.0 % in operating income as a percent of sales (12% to 14%).
• A decrease of 3.6% in on-time deliveries.