23-21
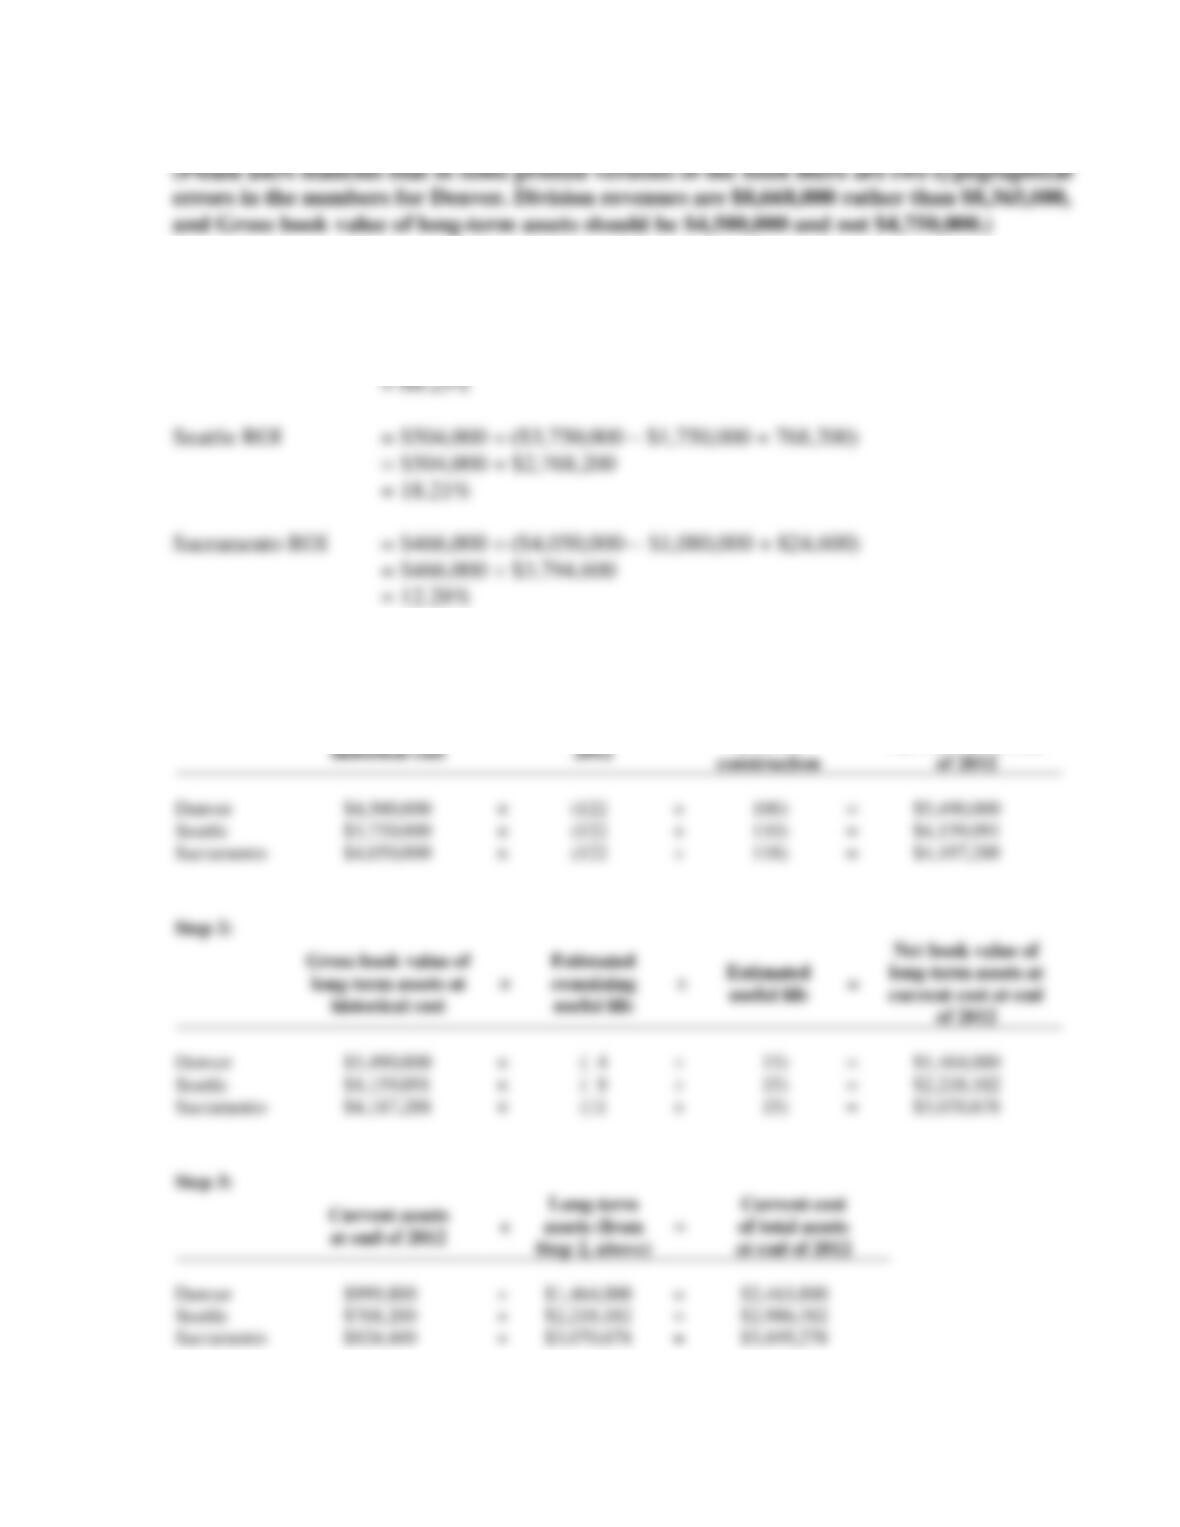
23-29 (40–50 min.) ROI, measurement alternatives for performance measures
1. ROI = Operating income ÷ Net book value of total assets
Denver ROI = $723,000 ÷ ($4,500,000 – $3,300,000 + 999,800)
= $723,000 ÷ $2,199,800
2.
Step 1:
Gross book value of
long-term assets at
historical cost
×
Construction
cost index in
2012
÷
Construction
cost index in
year of
construction
=
Gross book value of
long-term assets at
current cost at end
of 2012
Denver
$4,500,000
×
(122
÷
100)
=
$5,490,000
Seattle
$3,750,000
×
(122
÷
110)
=
$4,159,091
Sacramento
$4,050,000
×
(122
÷
118)
=
$4,187,288
Step 2:
Gross book value of
long-term assets at
historical cost
×
Estimated
remaining
useful life
÷
Estimated
useful life
=
Net book value of
long-term assets at
current cost at end
of 2012
Denver
$5,490,000
×
( 4
÷
15)
=
$1,464,000
Seattle
$4,159,091
×
( 8
÷
15)
=
$2,218,182
Sacramento
$4,187,288
×
(11
÷
15)
=
$3,070,678
Step 3:
Current assets
at end of 2012
+
Long-term
assets (from
Step 2, above)
=
Current cost
of total assets
at end of 2012
Denver
$999,800
+
$1,464,000
=
$2,463,800
Seattle
$768,200
+
$2,218,182
=
$2,986,382
Sacramento
$824,600
+
$3,070,678
=
$3,895,278
23-22
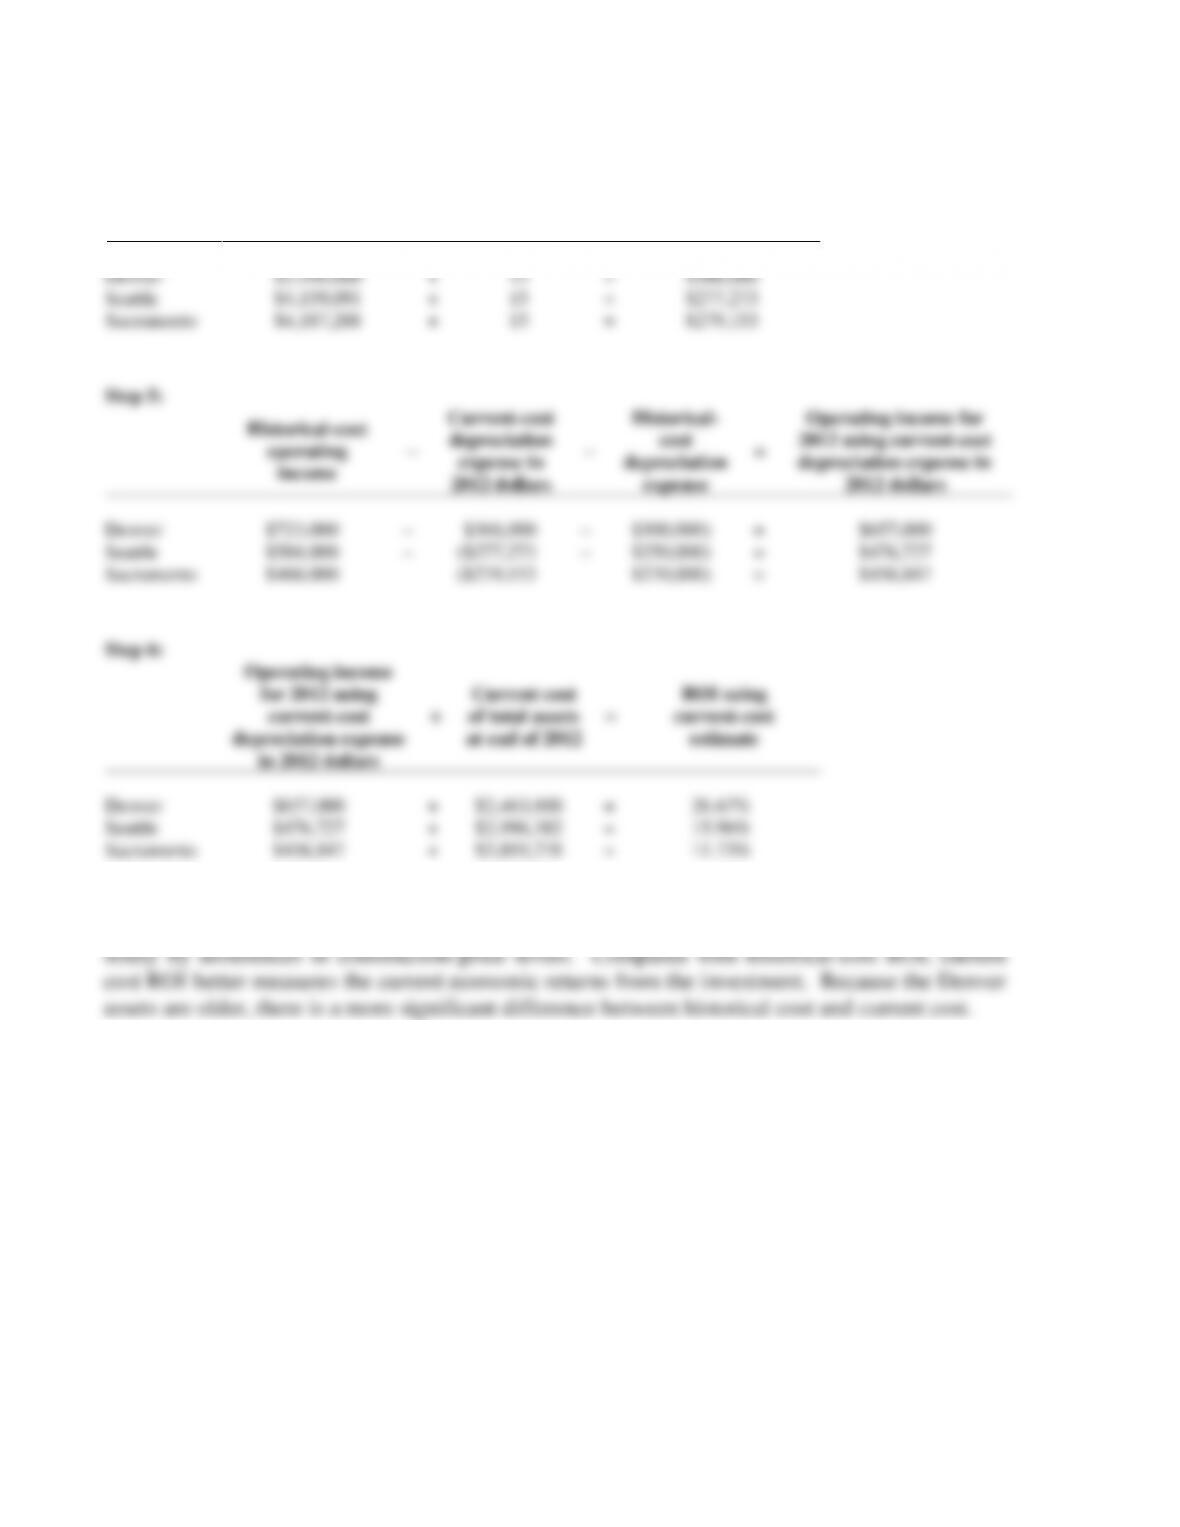
Step 4:
Gross book value of
long-term assets at
current cost at
end of 2012
+
Estimated
total
useful life
=
Current-cost
depreciation
expense in 2012
collars
Denver
$5,490,000
+
15
=
$366,000
Seattle
$4,159,091
+
15
=
$277,273
Sacramento
$4,187,288
+
15
=
$279,153
Step 5:
Historical-cost
operating
income
–
Current-cost
depreciation
expense in
2012 dollars
–
Historical-
cost
depreciation
expense
=
Operating income for
2012 using current-cost
depreciation expense in
2012 dollars
Denver
$723,000
–
$366,000
–
$300,000)
=
$657,000
Seattle
$504,000
–
($277,273
–
$250,000)
=
$476,727
Sacramento
$466,000
–
($279,153
–
$270,000)
=
$456,847
Step 6:
Operating income
for 2012 using
current-cost
depreciation expense
in 2012 dollars
÷
Current cost
of total assets
at end of 2012
=
ROI using
current-cost
estimate
Denver
$657,000
+
$2,463,800
=
26.67%
Seattle
$476,727
+
$2,986,382
=
15.96%
Sacramento
$456,847
+
$3,895,278
=
11.73%
3. Adjusting assets to recognize current costs negates differences in the investment base caused
23-23
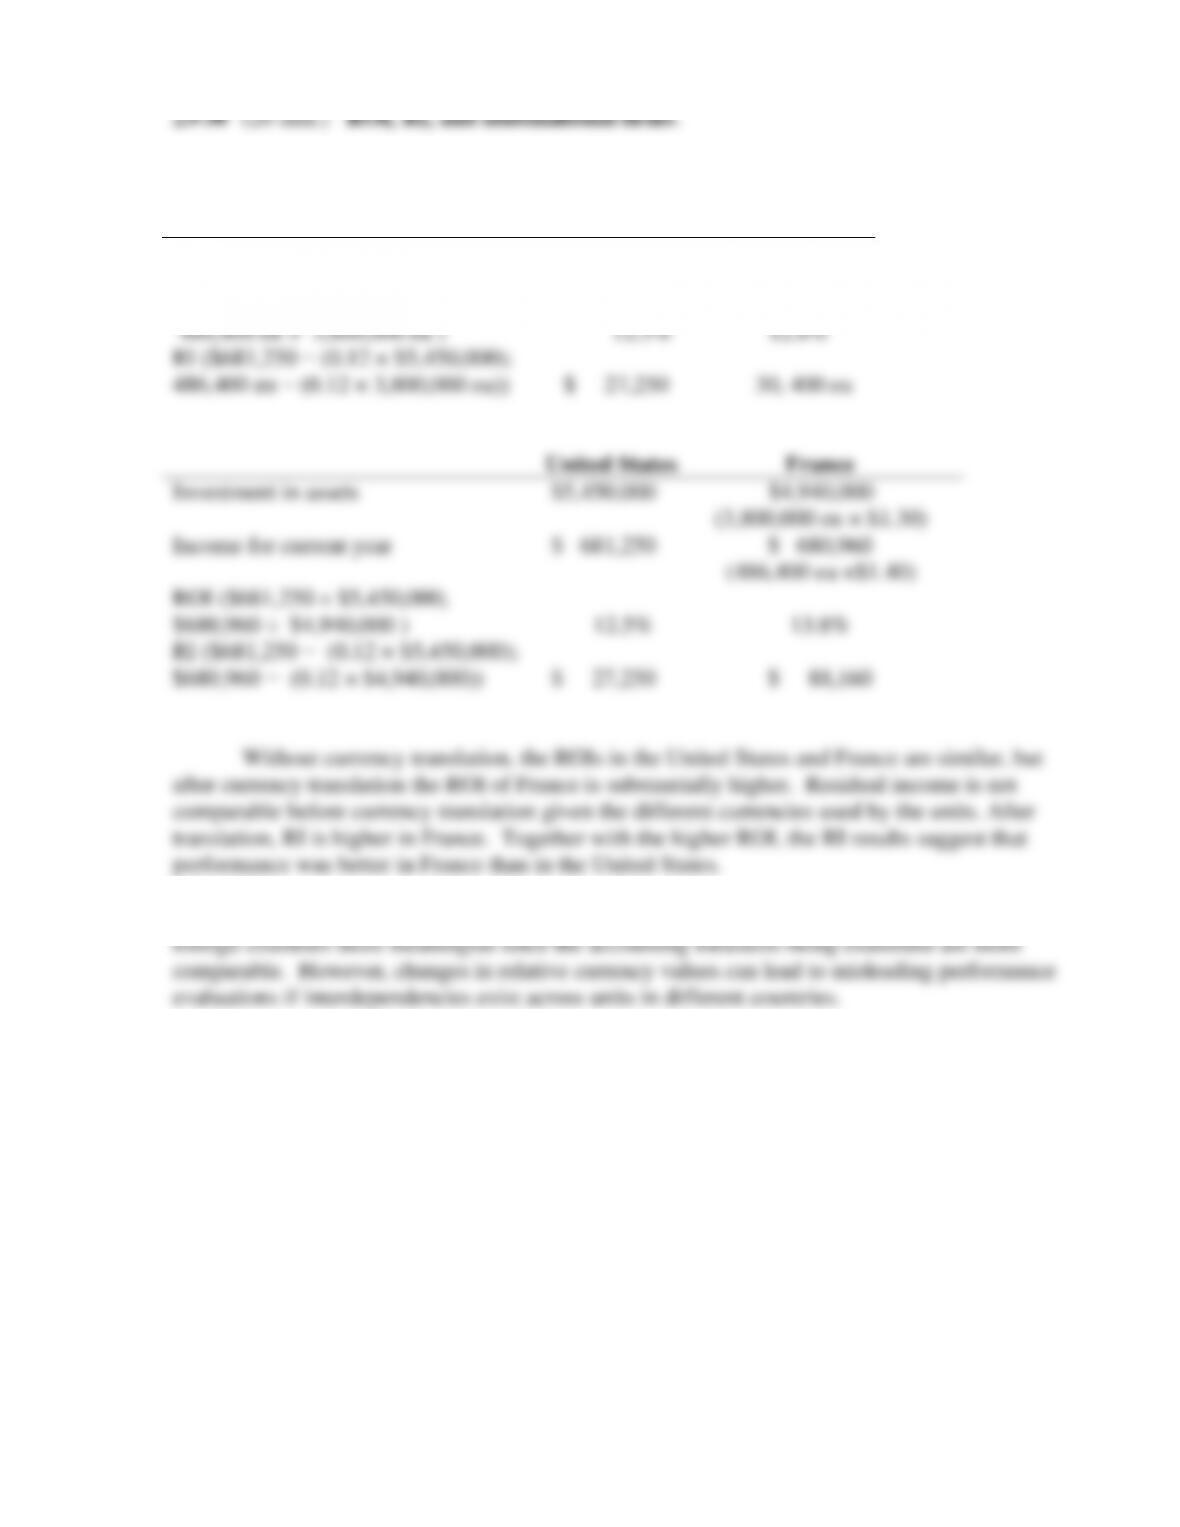
1. Calculation of ROI and RI before currency translation:
United States
France
Investment in assets
$5,450,000
3,800,000 eu
Income for current year
$ 681,250
486,400 eu
ROI ($681,250 ÷ $5,450,000;
486,400 eu ÷ 3,800,000 eu )
12.5%
12.8%
RI ($681,250 − (0.12 × $5,450,000);
486,400 eu − (0.12 × 3,800,000 eu))
$ 27,250
30, 400 eu
United States
France
Investment in assets
$5,450,000
$4,940,000
(3,800,000 eu × $1.30)
Income for current year
$ 681,250
$ 680,960
(486,400 eu ×$1.40)
ROI ($681,250 ÷ $5,450,000;
$680,960 ÷ $4,940,000 )
12.5%
13.8%
RI ($681,250 − (0.12 × $5,450,000);
$680,960 − (0.12 × $4,940,000))
$ 27,250
$ 88,160
2. Adjusting for differences in currency values makes the comparison of performance between
23-24
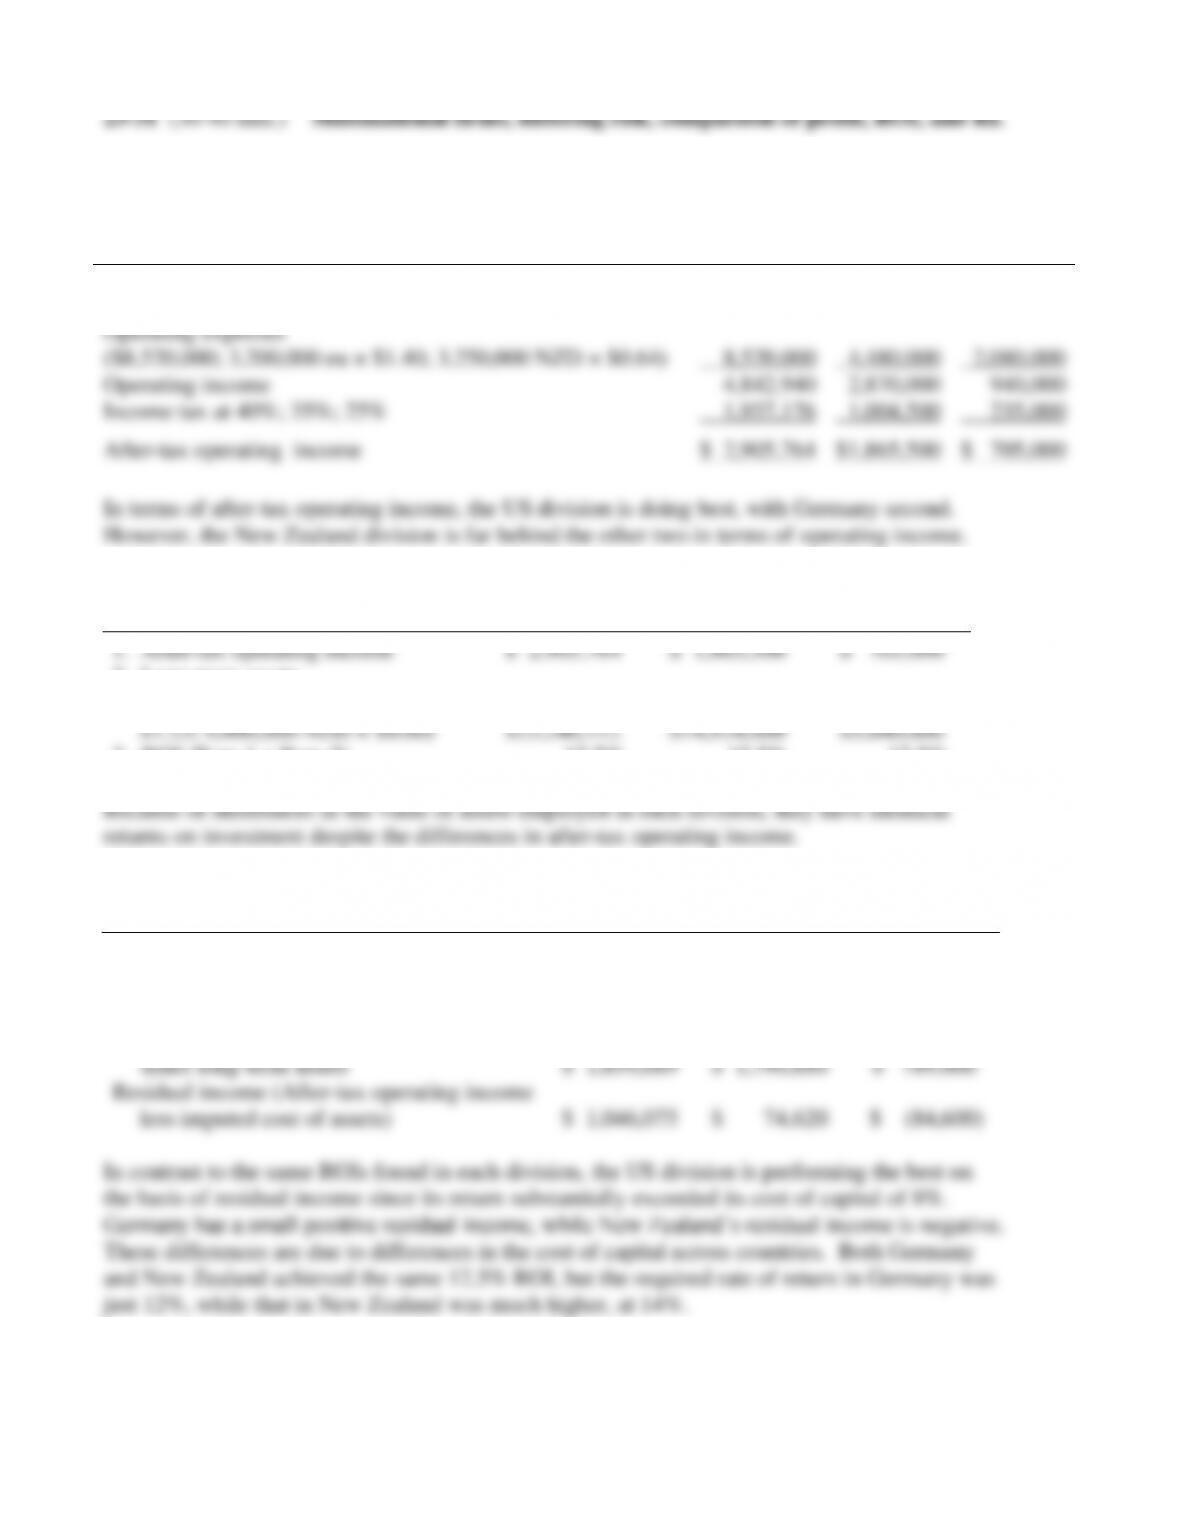
1. Comparisons of after-tax operating income using translated values:
US
Germany
NZ
Operating revenues
($13,362,940; 5,250,000 eu × $1.40; 4,718,750 NZD × $0.64)
$13,362,940
$7,350,000
$3,020,000
Operating expenses
($8,520,000; 3,200,000 eu × $1.40; 3,250,000 NZD × $0.64)
8,520,000
4,480,000
2,080,000
Operating income
4,842,940
2,870,000
940,000
Income tax at 40%; 35%; 25%
1,937,176
1,004,500
235,000
After-tax operating income
$ 2,905,764
$1,865,500
$ 705,000
In terms of after-tax operating income, the US division is doing best, with Germany second.
However, the New Zealand division is far behind the other two in terms of operating income.
2. Comparison of ROI for each division.
US
Germany
NZ
1. After-tax operating income
$ 2,905,764
$ 1,865,500
$ 705,000
2. Long-term assets
($23,246,112; 11,939,200 eu ×
$1.25; 9,400,000 NZD × $0.60)
$23,246,112
$14,924,000
$5,640,000
3. ROI (Row 1 ÷ Row 2)
12.5%
12.5%
12.5%
3.
US
Germany
NZ
After-tax operating income
$ 2,905,764
$ 1,865,500
$ 705,000
Long-term assets
$23,246,112
$14,924,000
$5,640,000
Cost of capital (given)
8%
12%
14%
Imputed cost of assets (cost of capital
times long-term assets
$ 1,859,689
$ 1,790,880
$ 789,600
Residual income (After-tax operating income
less imputed cost of assets)
$ 1,046,075
$ 74,620
$ (84,600)
In contrast to the same ROIs found in each division, the US division is performing the best on
the basis of residual income since its return substantially exceeded its cost of capital of 8%.
Germany has a small positive residual income, while New Zealand’s residual income is negative.
These differences are due to differences in the cost of capital across countries. Both Germany
and New Zealand achieved the same 12.5% ROI, but the required rate of return in Germany was
just 12%, while that in New Zealand was much higher, at 14%.
23-25
US
Germany
NZ
1. Operating income
(from requirement 1)
$ 4,842,940
$ 2,870,000
$ 940,000
2. Long-term assets
$23,246,112
$14,924,000
$5,640,000
3. ROI (Row 1 ÷ Row 2)
20.83%
19.23%
16.67%
The ROI computed using pre-tax operating income is much higher than the 12.5% ROI
23-26
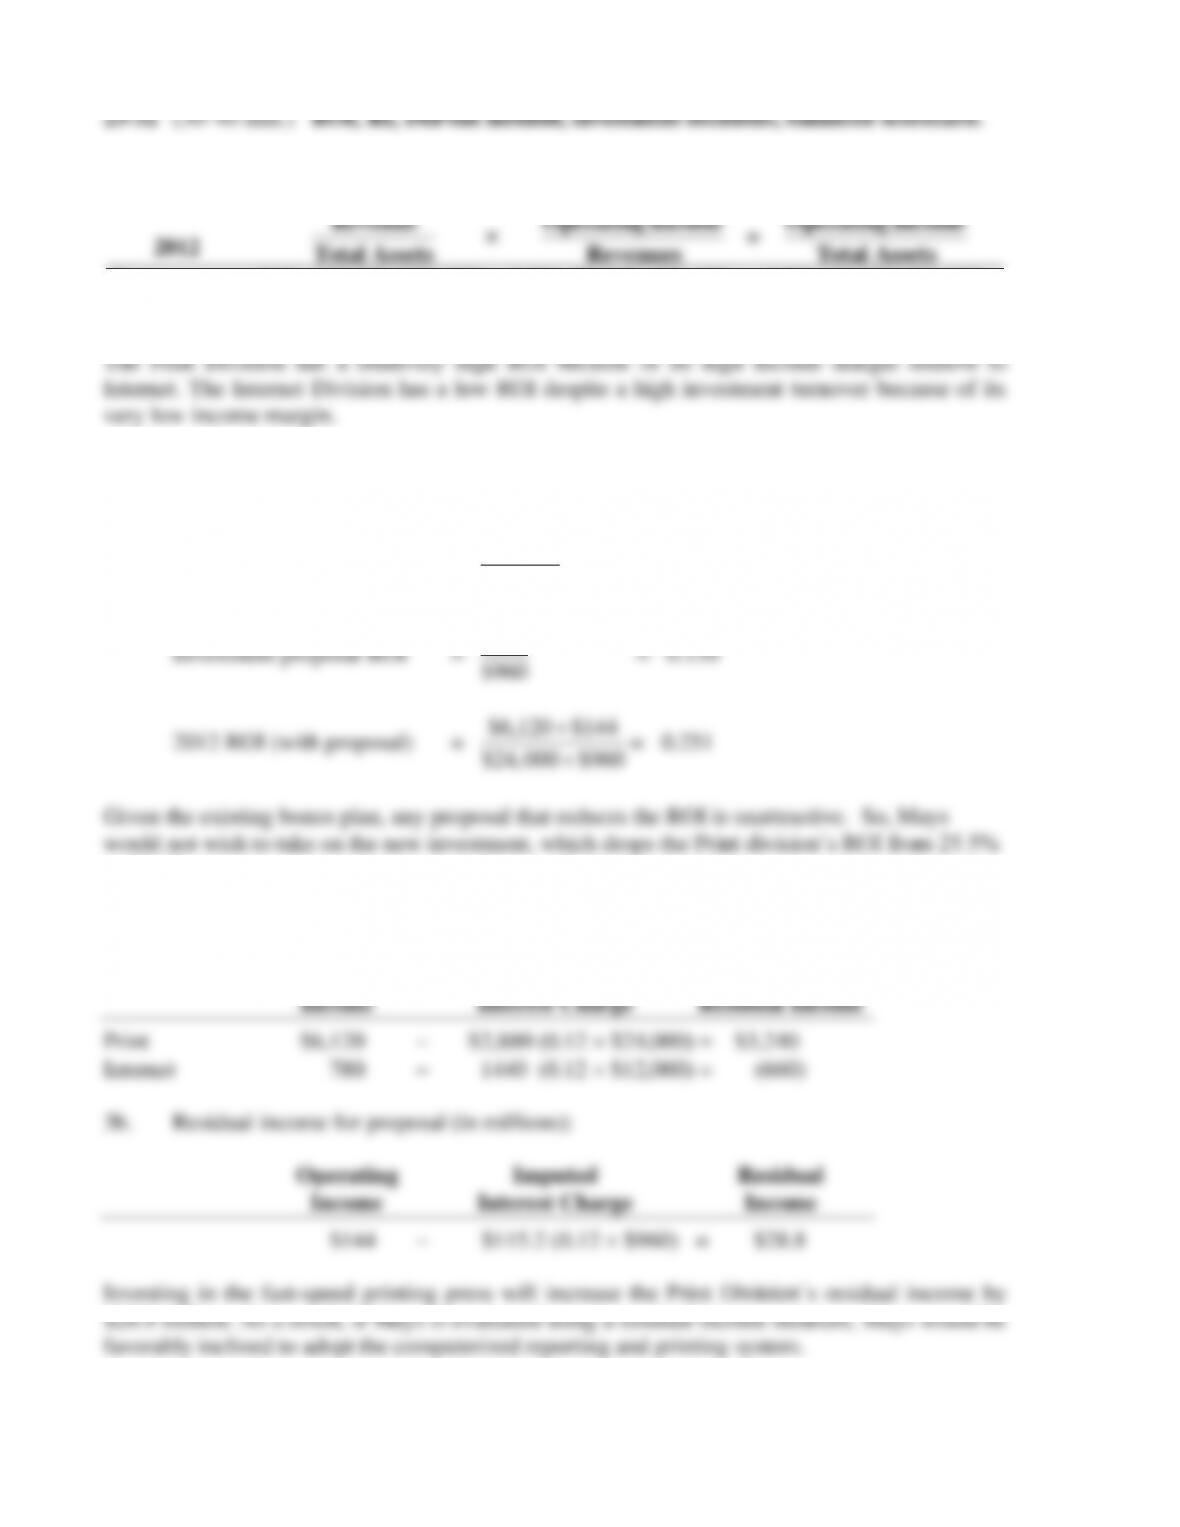
1.
2012
ROI =
AssetsTotal
Revenue
Revenues
Income Operating
=
AssetsTotal
Income Operating
Print
Internet
0.85 ($20,400
$24,000)
2.50 ($30,000
$12,000)
0.300 ($6,120 ÷ $20,400)
0.026 ($ 780 ÷ $30,000)
0.255 ($6,120
$24,000)
0.065 ($ 780
$12,000)
2. Although the proposed investment is small, relative to the total assets invested, it earns
less than the 2012 return on investment (0.255) (All dollar numbers in millions):
2012 ROI (before proposal) =
$6,120
$24,000
= 0.255
$144
$960
2012 ROI (with proposal) =
$6,120 $144
$24,000 $960
+
+
= 0.251
Given the existing bonus plan, any proposal that reduces the ROI is unattractive. So, Mays
would not wish to take on the new investment, which drops the Print division’s ROI from 25.5%
to 25.1%.
3a. Residual income for 2012 (before proposal, in millions):
Operating Imputed Division
23-27
4. As discussed in requirement 3b, Moreno could consider using RI. The use of RI
motivates managers to accept any project that makes a positive contribution to net income after
23-33 (20–30 min.) Division manager’s compensation, levers of control.
1 Consider each of the three proposals that Moreno is considering:
a. Compensate managers on the basis of division RI.
The benefit of this arrangement is that managers would be motivated to put in extra effort
to increase RI because managers’ rewards would increase with increases in RI. But
performance-based bonus in compensation arrangements is to balance the benefits of incentives
against the extra costs of imposing uncontrollable risk on the manager.
Finally, rewarding a manager only on the basis of division RI will induce managers to
maximize the division’s RI even if taking such actions are not in the best interests of the
company as a whole.