23-11
1. Bleefl would be better off if the machine is replaced. Its cost of capital is 6% and the IRR of
the investment is 11%, indicating that this is a positive net present value project.
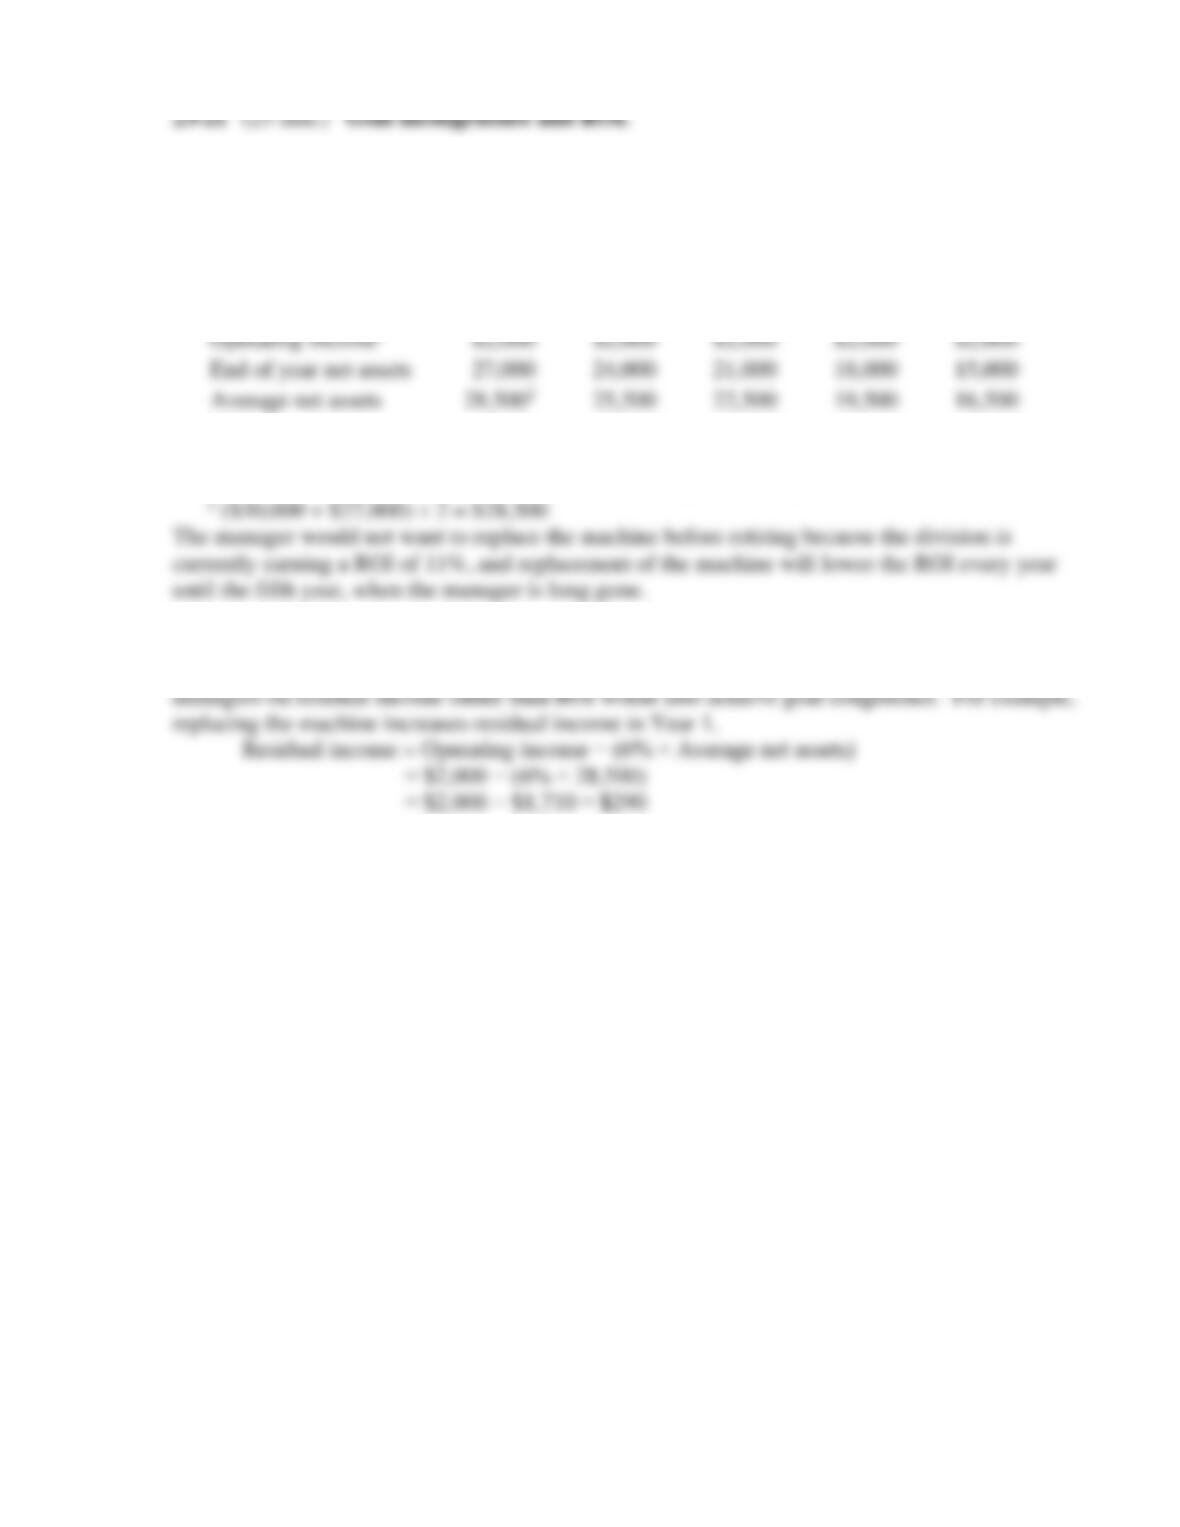
2. The ROIs for the first five years are:
Year 1
Year 2
Year 3
Year 4
Year 5
Operating income1
$2,000
$2,000
$2,000
$2,000
$2,000
End of year net assets
27,000
24,000
21,000
18,000
15,000
Average net assets
28,5002
25,500
22,500
19,500
16,500
ROI
7.02%
7.84%
8.89%
10.26%
12.12%
1Income is cash savings of $5,000 less $3,000 annual depreciation expense.
3. Bleefl could use long term rather than short term ROI, or use ROI and some other long term
measures to evaluate the Patio Furniture division to create goal congruence. Evaluating the
23-12
23-22 (25 min.) ROI, RI, EVA®.
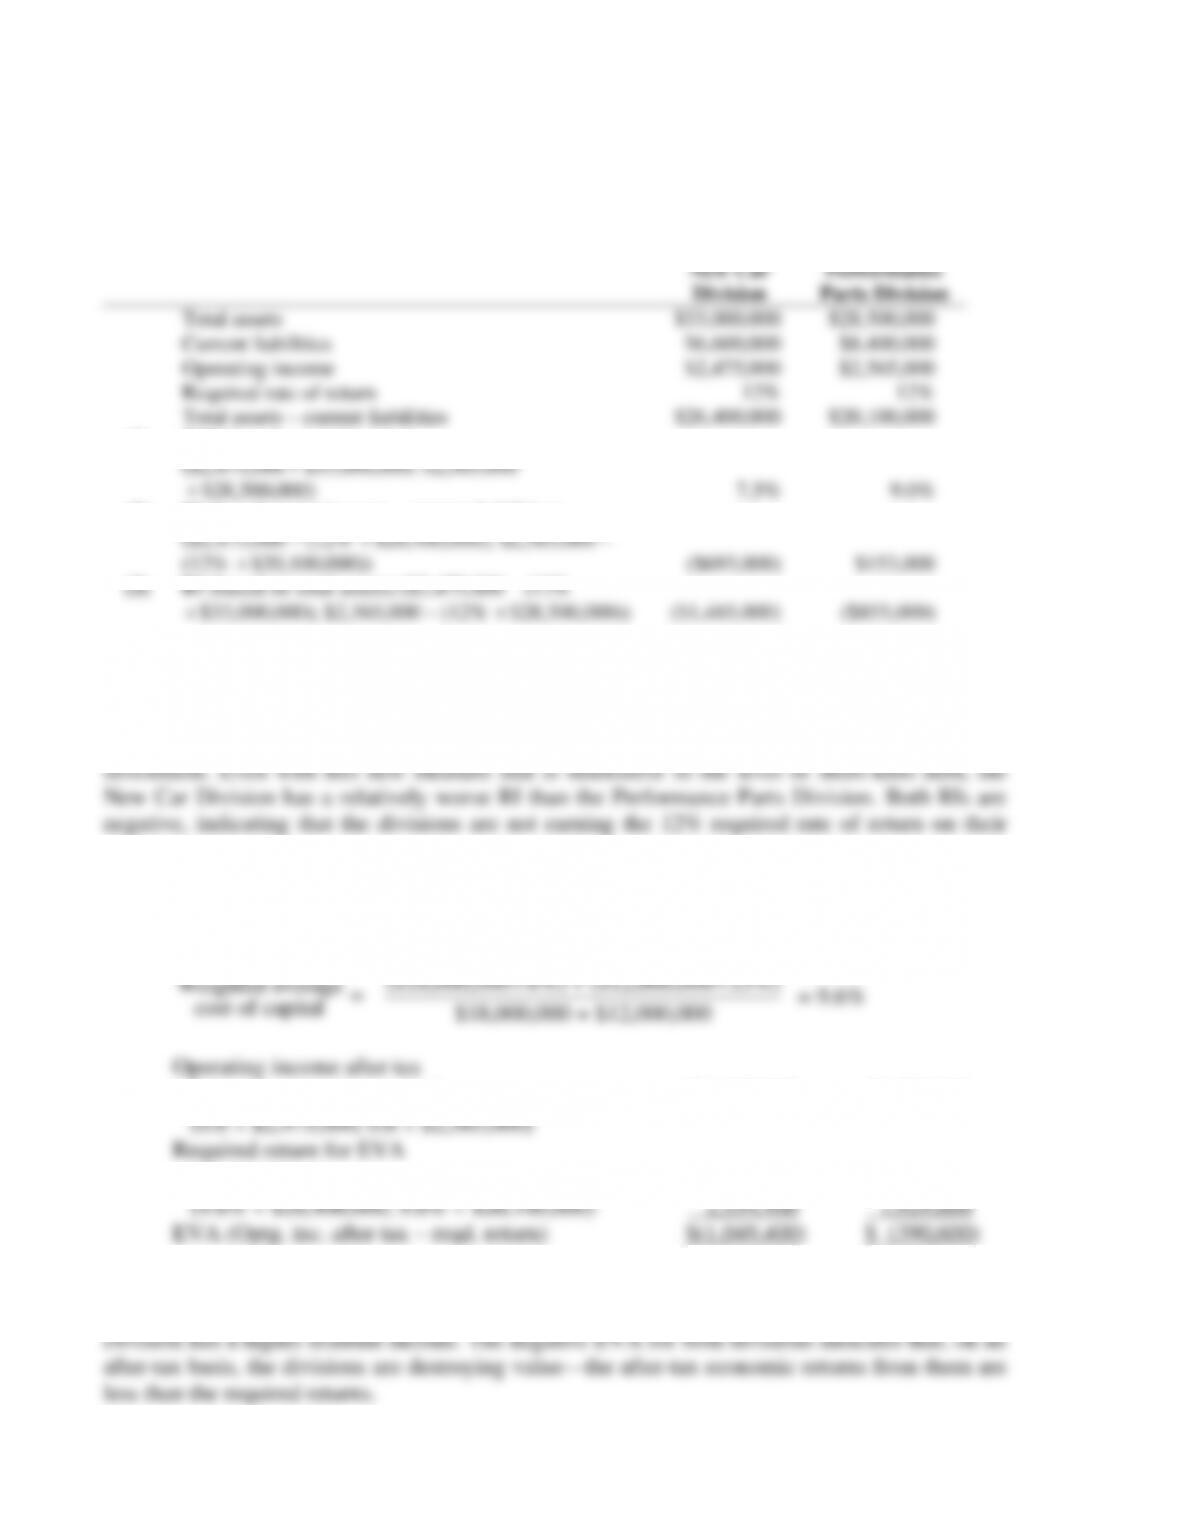
1. The required division ROIs using total assets as a measure of investment is shown in the
row labeled (1) in Solution Exhibit 23-22.
SOLUTION EXHIBIT 23-22
New Car
Division
Performance
Parts Division
Total assets
$33,000,000
$28,500,000
Current liabilities
$6,600,000
$8,400,000
Operating income
$2,475,000
$2,565,000
Required rate of return
12%
12%
Total assets – current liabilities
$26,400,000
$20,100,000
(1)
ROI (based on total assets)
($2,475,000
$33,000,000; $2,565,000
$28,500,000)
7.5%
9.0%
(2)
RI (based on total assets – current liabilities)
($2,475,000 – (12%
$26,400,000); $2,565,000 –
(12%
$20,100,000))
($693,000)
$153,000
(3)
RI (based on total assets) ($2,475,000 – (12%
$33,000,000); $2,565,000 – (12%
$28,500,000))
($1,485,000)
($855,000)
2. The required division RIs using total assets minus current liabilities as a measure of
investment is shown in the row labeled (2) in the table above.
3. The row labeled (3) in the table above shows division RIs using assets as a measure of
assets.
4. After-tax cost of debt financing = (1– 0.4) 10% = 6%
After-tax cost of equity financing = 15%
Weighted average
($18,000,000 6%) + ($12,000,000 15%)
0.6 operating income before tax $ 1,485,000 $1,539,000
9.6% Investment
5. Both the residual income and the EVA calculations indicate that the Performance Parts
Division is performing nominally better than the New Car Division. The Performance Parts
23-13
23-23 (25–30 min.) ROI, RI, measurement of assets.
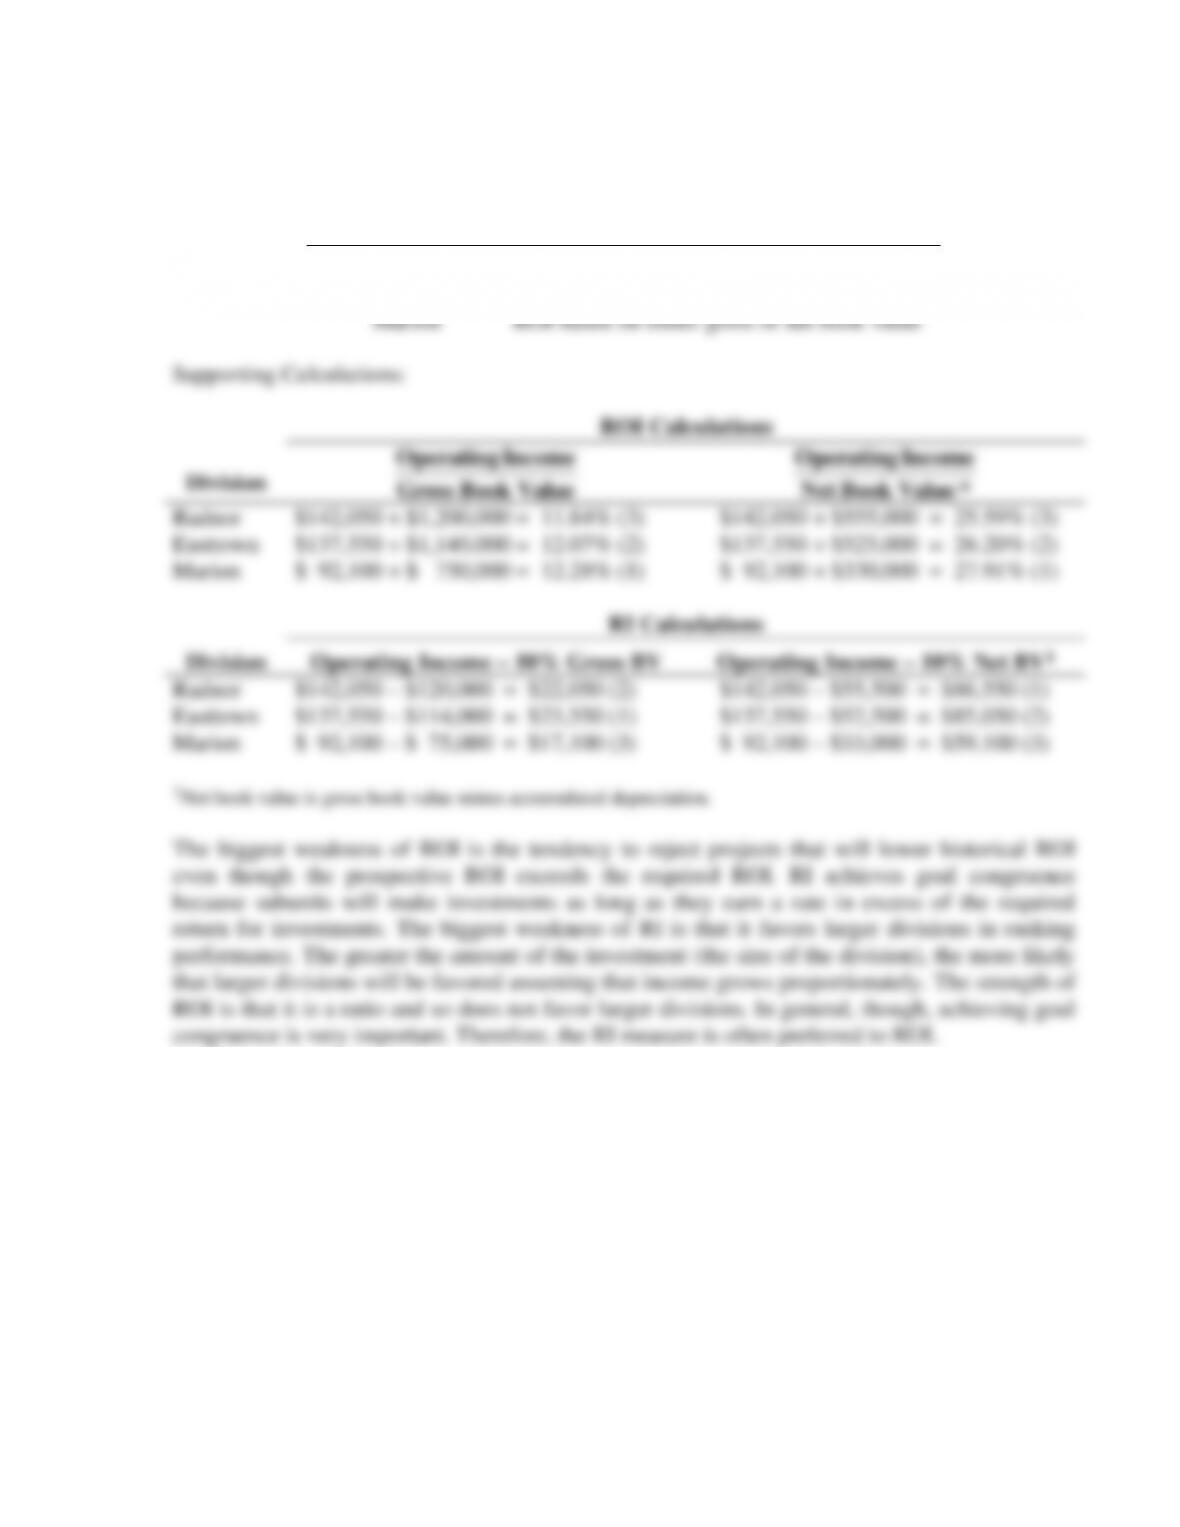
The method for computing profitability preferred by each manager follows:
Manager of
Method Chosen
Radnor
Easttown
Marion
RI based on net book value
RI based on gross book value
ROI based on either gross or net book value
Supporting Calculations:
ROI Calculations
Division
Value Book Gross
Income Operating
*Value BookNet
Income Operating
Radnor
Easttown
Marion
$142,050 ÷ $1,200,000 = 11.84% (3)
$137,550 ÷ $1,140,000 = 12.07% (2)
$ 92,100 ÷ $ 750,000 = 12.28% (1)
$142,050 ÷ $555,000 = 25.59% (3)
$137,550 ÷ $525,000 = 26.20% (2)
$ 92,100 ÷ $330,000 = 27.91% (1)
RI Calculations
Division
Operating Income – 10% Gross BV
Operating Income – 10% Net BV1
Radnor
Easttown
Marion
$142,050 – $120,000 = $22,050 (2)
$137,550 – $114,000 = $23,550 (1)
$ 92,100 – $ 75,000 = $17,100 (3)
$142,050 – $55,500 = $86,550 (1)
$137,550 – $52,500 = $85,050 (2)
$ 92,100 – $33,000 = $59,100 (3)
1Net book value is gross book value minus accumulated depreciation.
The biggest weakness of ROI is the tendency to reject projects that will lower historical ROI
even though the prospective ROI exceeds the required ROI. RI achieves goal congruence
because subunits will make investments as long as they earn a rate in excess of the required
return for investments. The biggest weakness of RI is that it favors larger divisions in ranking
performance. The greater the amount of the investment (the size of the division), the more likely
that larger divisions will be favored assuming that income grows proportionately. The strength of
ROI is that it is a ratio and so does not favor larger divisions. In general, though, achieving goal
congruence is very important. Therefore, the RI measure is often preferred to ROI.
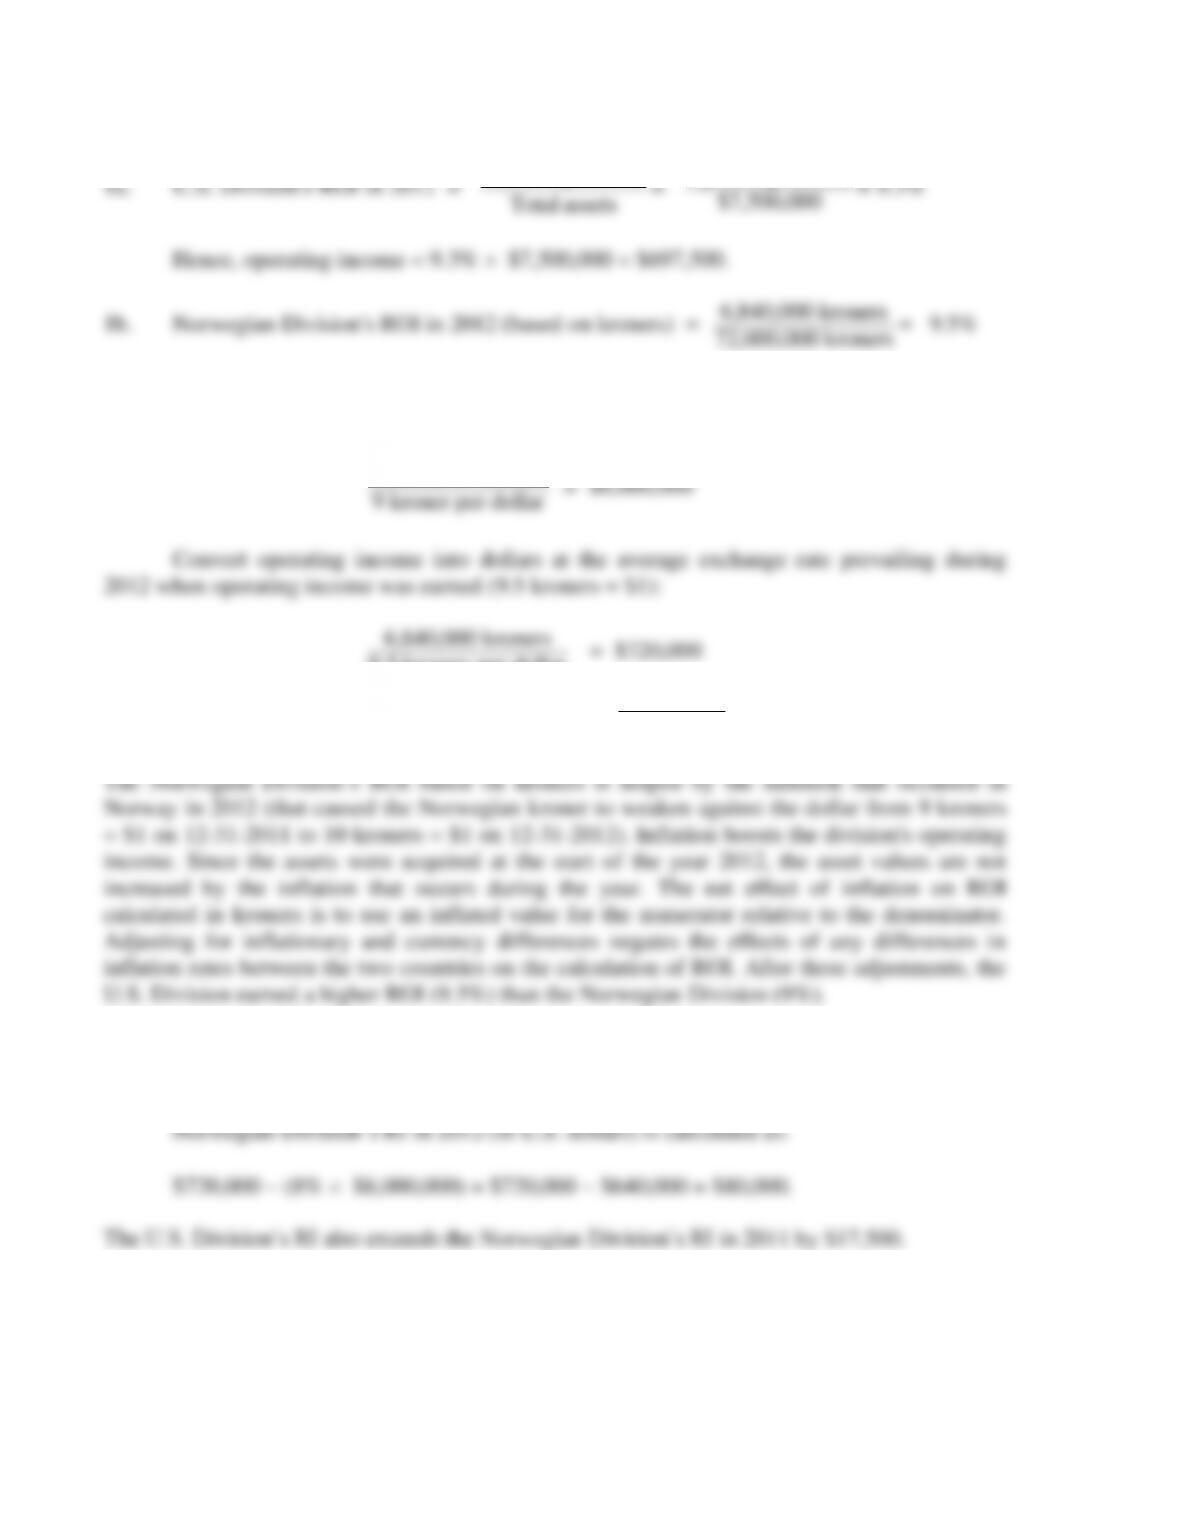
23-24 (20 min.) Multinational performance measurement, ROI, RI.
income Operating
Operating income
23-15
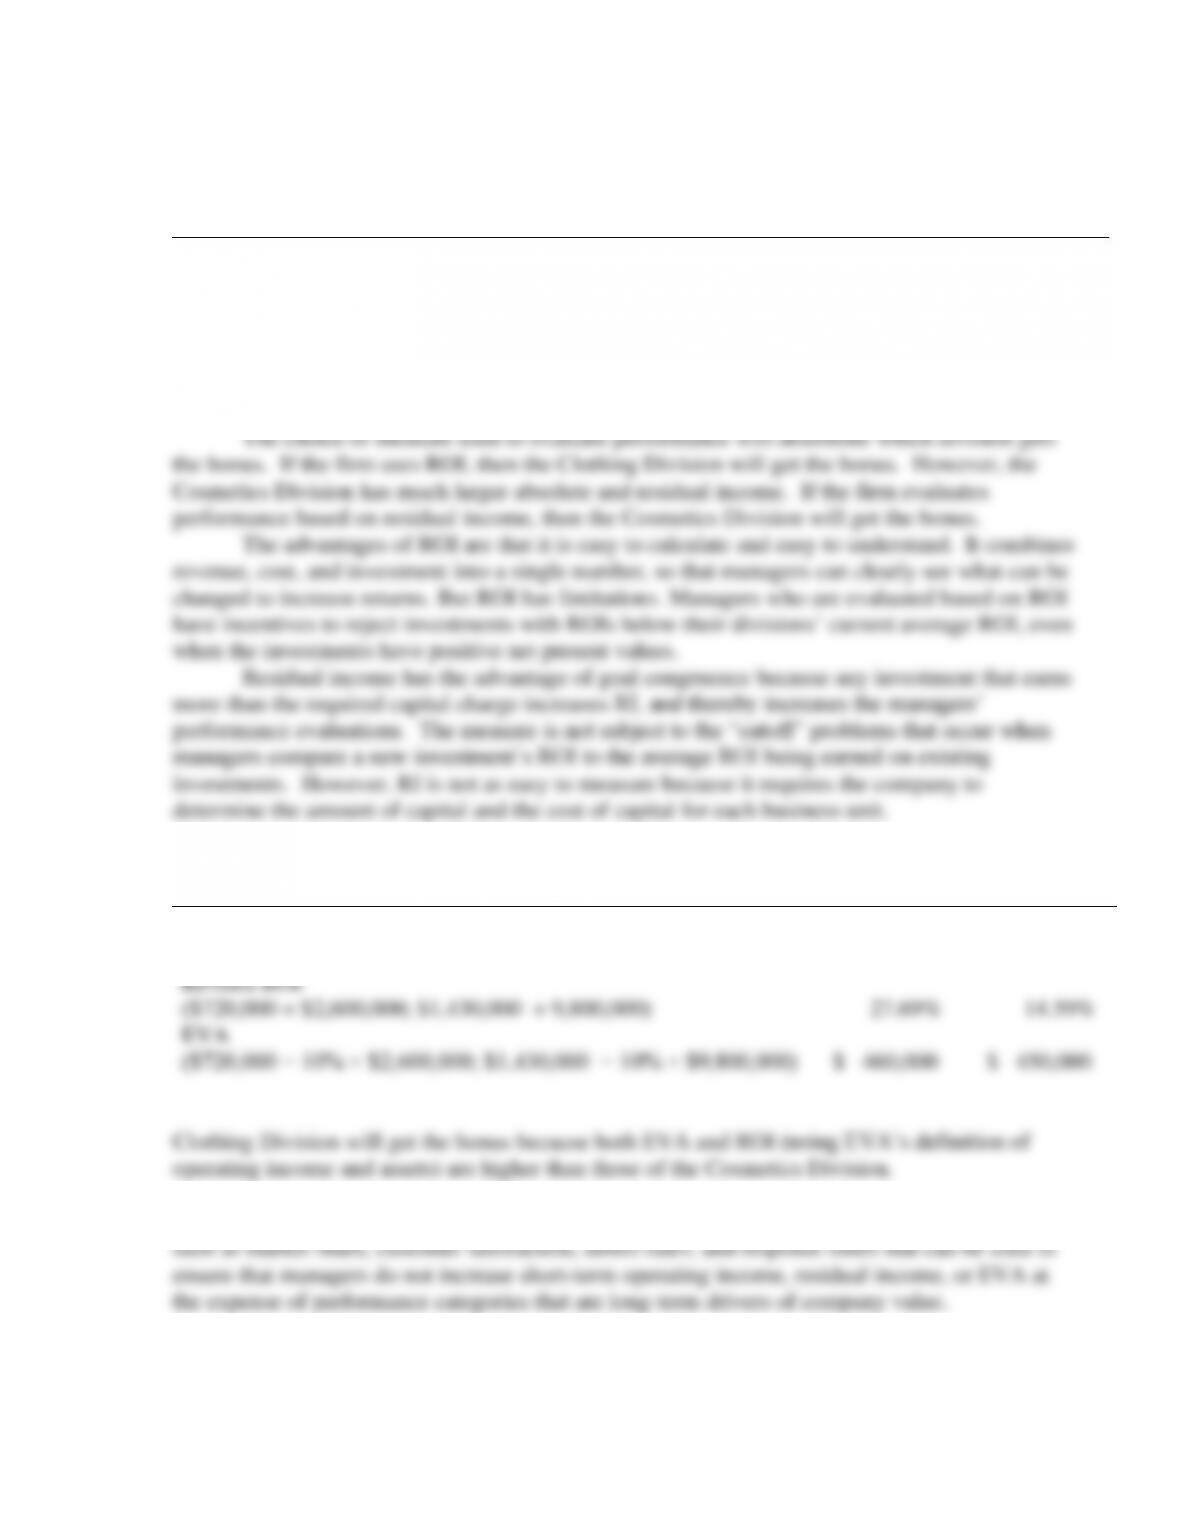
23-25 (20 min.) ROI, RI, EVA and Performance Evaluation.
1. ROI and residual income:
Clothing
Cosmetics
Operating income after tax
$ 600,000
$ 1,600,000
Net assets
$3,000,000
$10,000,000
ROI
($600,000 ÷ $3,000,000; $1,600,000 ÷ $10,000,000)
20.00%
16.00%
RI
($600,000 − 10% × 3,000,000; $1,600,000− 10% × $10,000,000)
$ 300,000
$ 600,000
2.
Clothing
Cosmetics
Adjusted operating income
$ 720,000
$1,430,000
Net assets less current liabilities
$2,600,000
$9,800,000
Revised ROI
($720,000 ÷ $2,600,000; $1,430,000 ÷ 9,800,000)
27.69%
14.59%
EVA
($720,000 − 10% × $2,600,000; $1,430,000 − 10% × $9,800,000)
$ 460,000
$ 450,000
3. Since this is a manufacturing firm, there are a variety of non-financial performance measures
23-16
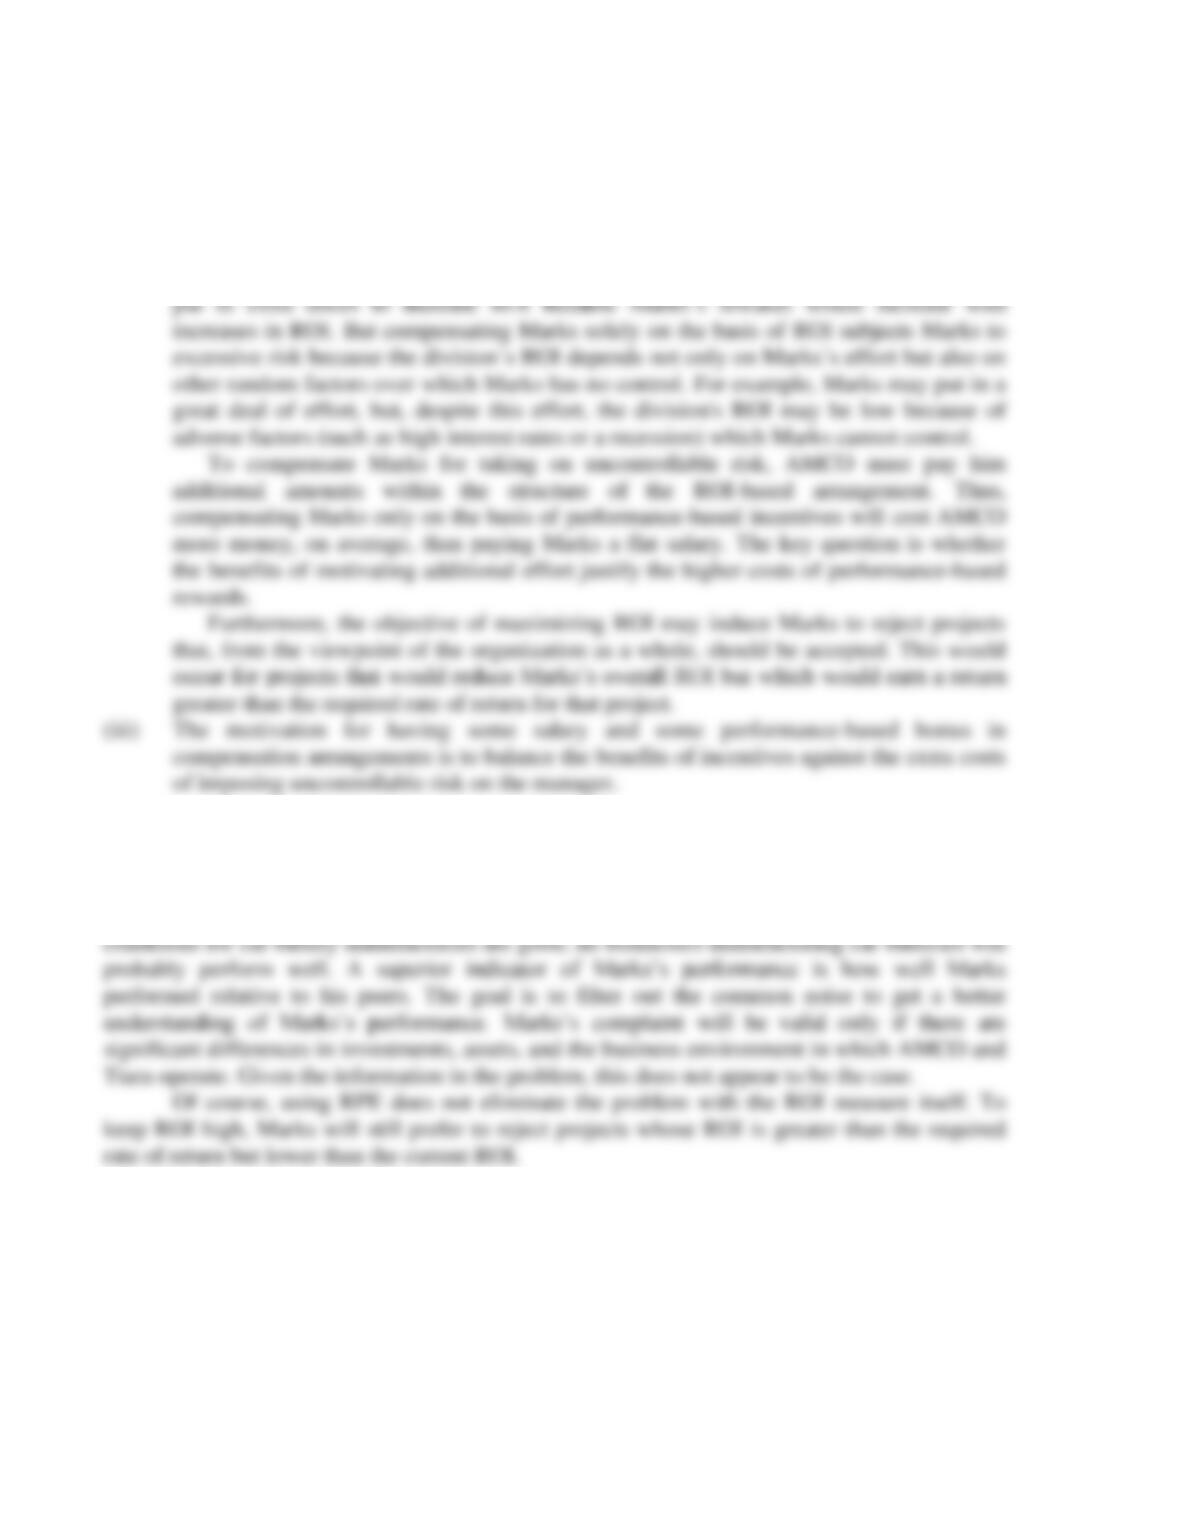
23-26 (20–30 min.) Risk sharing, incentives, benchmarking, multiple tasks.
1. An evaluation of the three proposals to compensate Marks, the general manager of the
Dexter Division follows:
(i) Paying Marks a flat salary will not subject Marks to any risk, but it will provide no
incentives for Marks to undertake extra physical and mental effort.
(ii) Rewarding Marks only on the basis of Dexter Division’s ROI would motivate Marks to
2. Marks’s complaint does not appear to be valid. The senior management of AMCO is
proposing to benchmark Marks’s performance using a relative performance evaluation (RPE)
system. RPE controls for common uncontrollable factors that similarly affect the performance of
managers operating in the same environments (for example, the same industry). If business
23-17
3. Superior performance measures change significantly with the manager’s performance and
not very much with changes in factors that are beyond the manager’s control. If Marks has no
authority for making capital investment decisions, then ROI is not a good measure of Marks’s
performance––it varies with the actions taken by others rather than the actions taken by Marks.
4. There are three main concerns with Marks’s plans. First, creating very strong sales
incentives imposes excessive risk on the sales force because a salesperson’s performance is
affected not only by his or her own effort, but also by random factors (such as a recession in the
industry) that are beyond the salesperson’s control. If salespersons are risk averse, the firm will
23-18
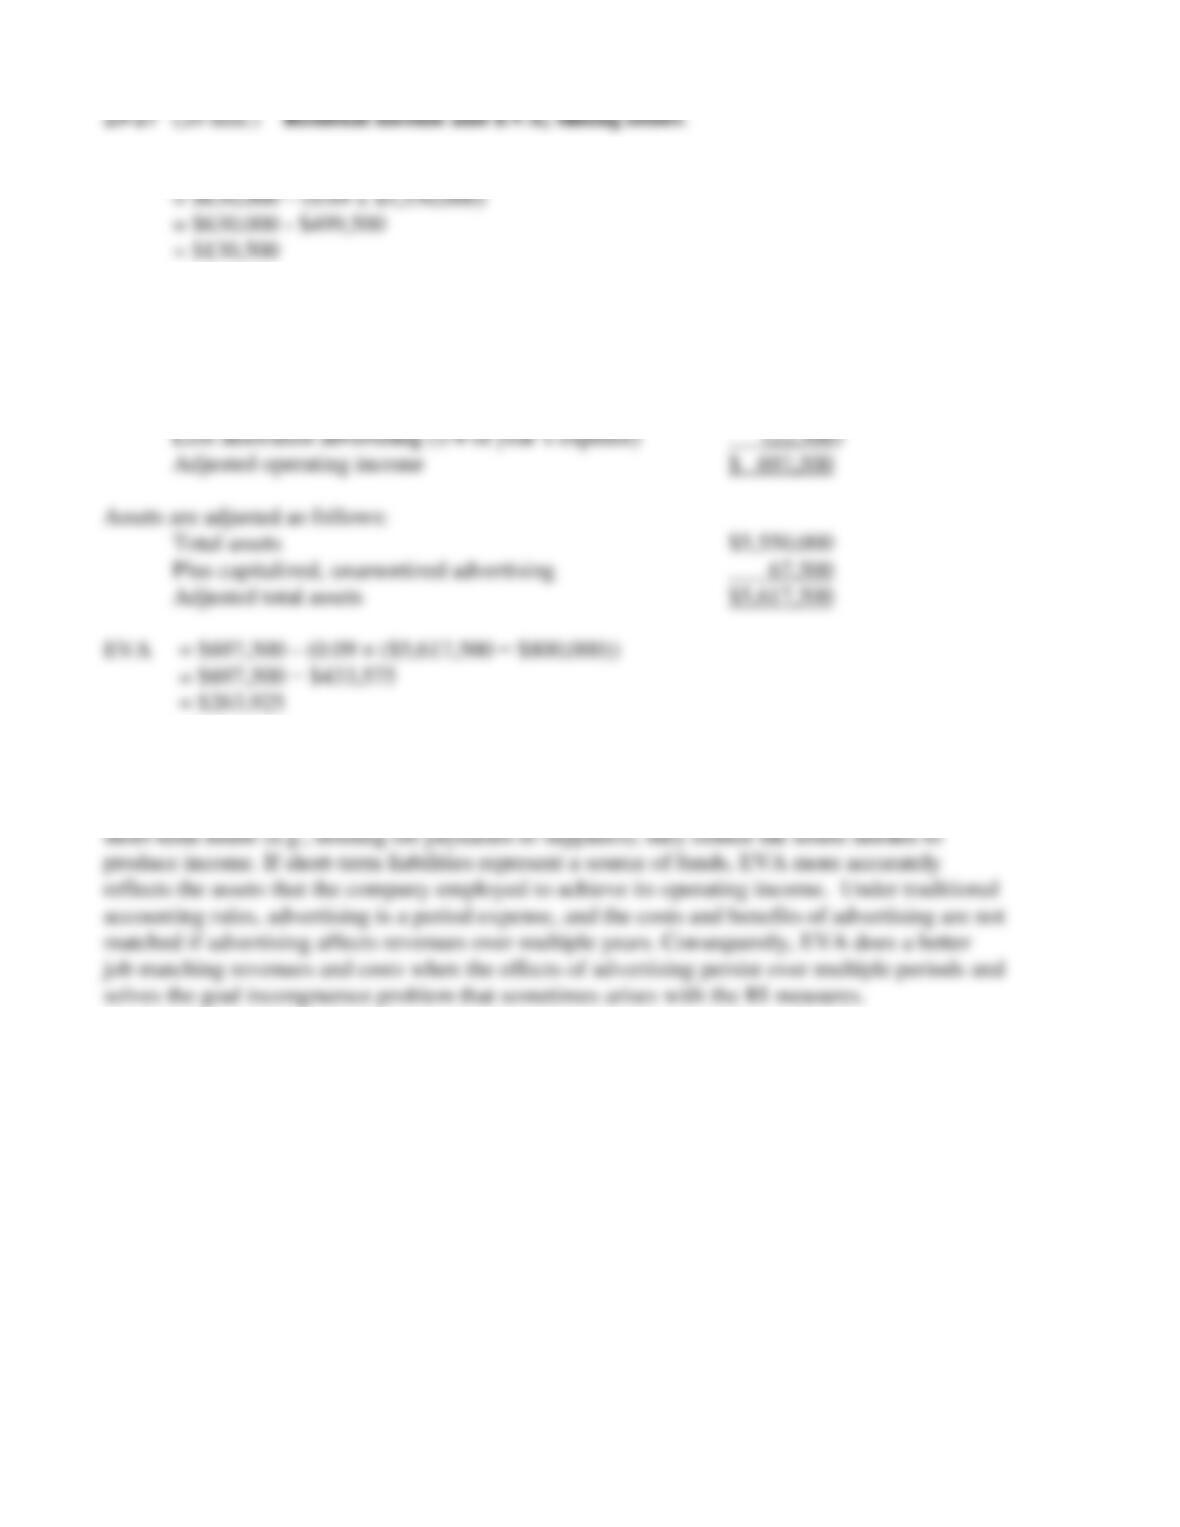
1. RI =Operating income – (WACC x Assets)
2. EVA = Adjusted operating income – (WACC x (Total assets – Current liabilities))
Operating income is adjusted as follows:
Operating income $ 630,000
Add back this period’s advertising expense 90,000
3. The differences between the RI and EVA results are due to two factors in this problem: the
definition of capital and the treatment of advertising. EVA subtracts current liabilities from total
assets when computing capital. Since some types of current liabilities represent sources of “free”
23-19
1. ROI using historical cost measures:
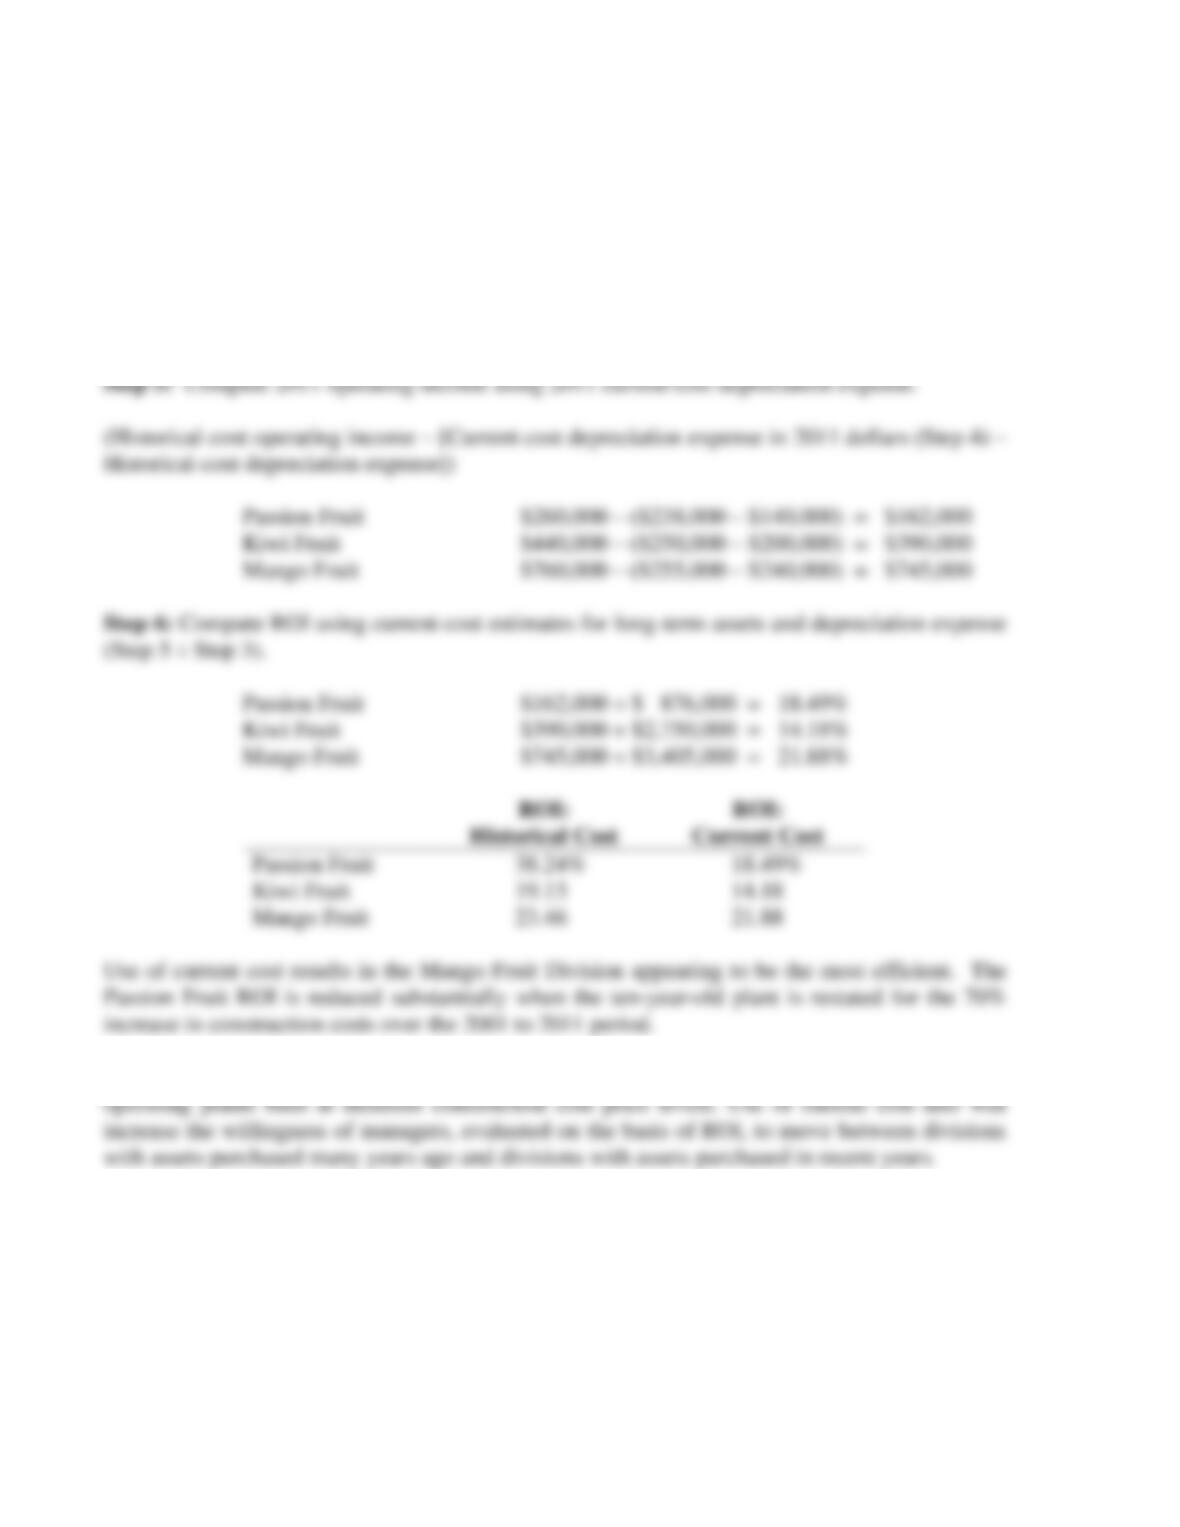
Passion Fruit $260,000 ÷ $ 680,000 = 38.24%
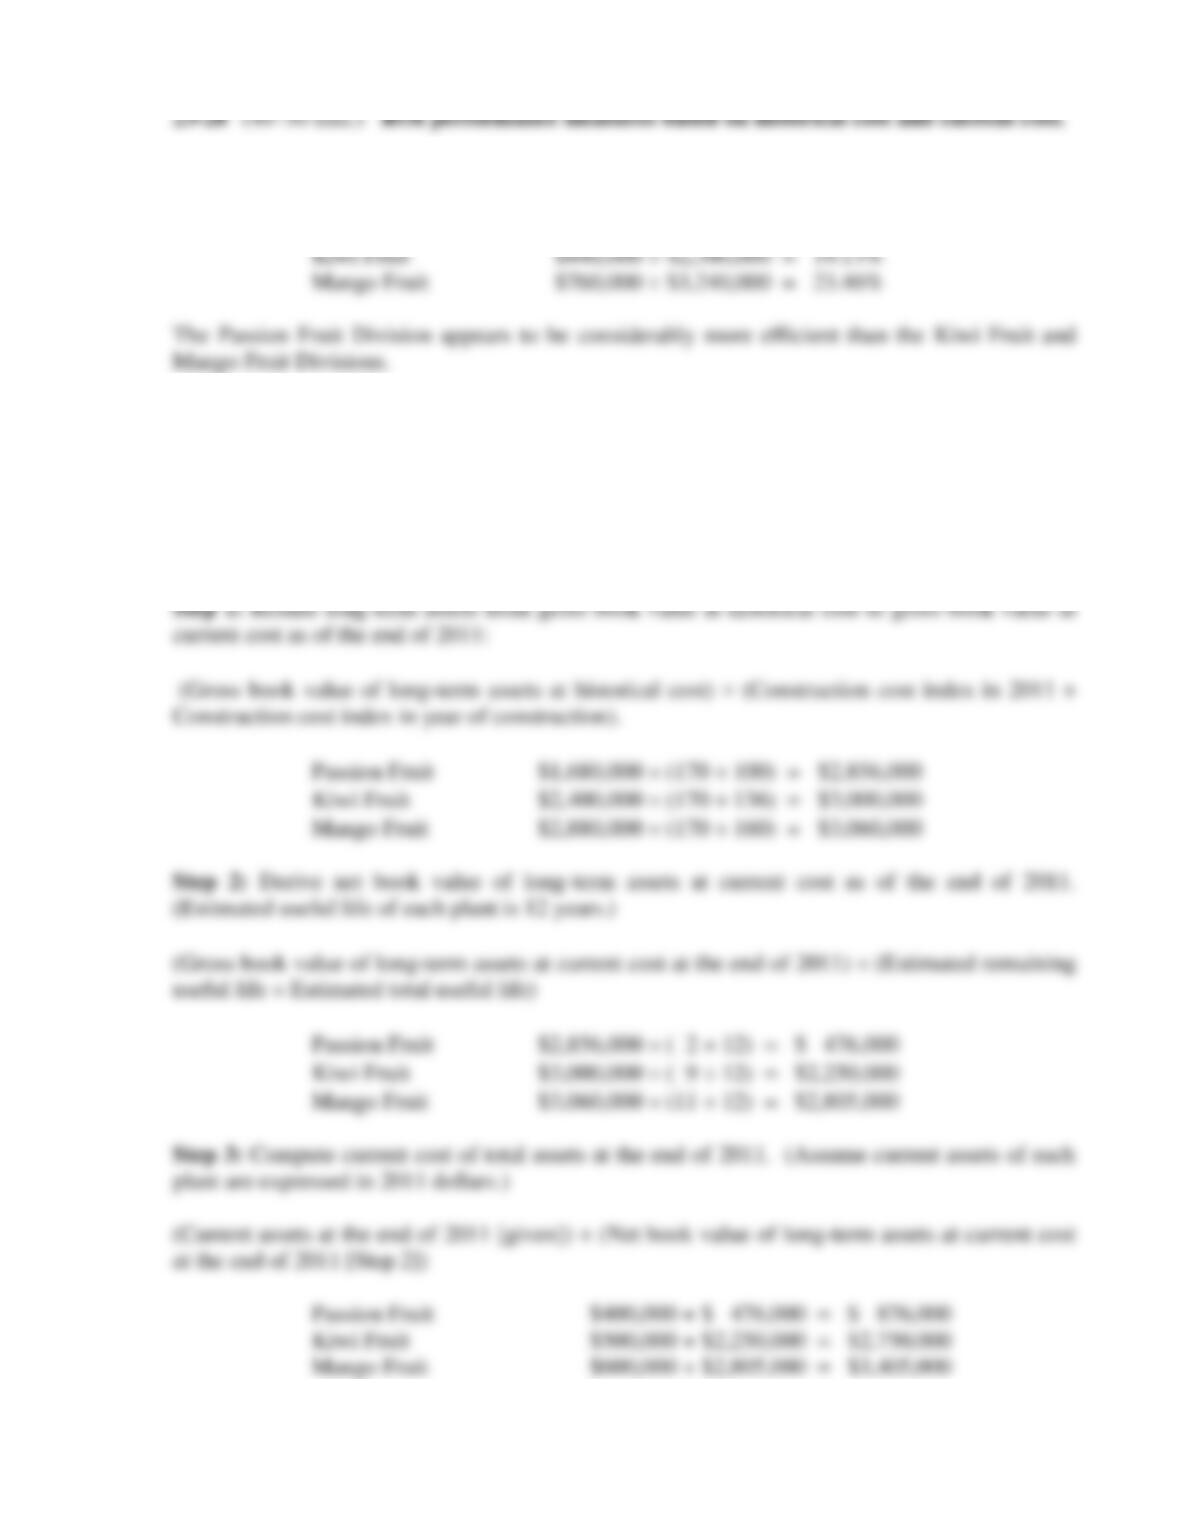
2. The gross book values (i.e., the original costs of the plants) under historical cost are
calculated as the useful life of each plant (12 years) the annual depreciation:
Passion Fruit 12 $140,000 = $1,680,000
Kiwi Fruit 12 $200,000 = $2,400,000
Mango Fruit 12 $240,000 = $2,880,000
23-20
Step 4: Compute current-cost depreciation expense in 2011 dollars.
Gross book value of long-term assets at current cost at the end of 2011 (from Step 1) ÷ 12
Passion Fruit $2,856,000 ÷ 12 = $238,000
Kiwi Fruit $3,000,000 ÷ 12 = $250,000
Mango Fruit $3,060,000 ÷ 12 = $255,000
3. Use of current costs increases the comparability of ROI measures across divisions’