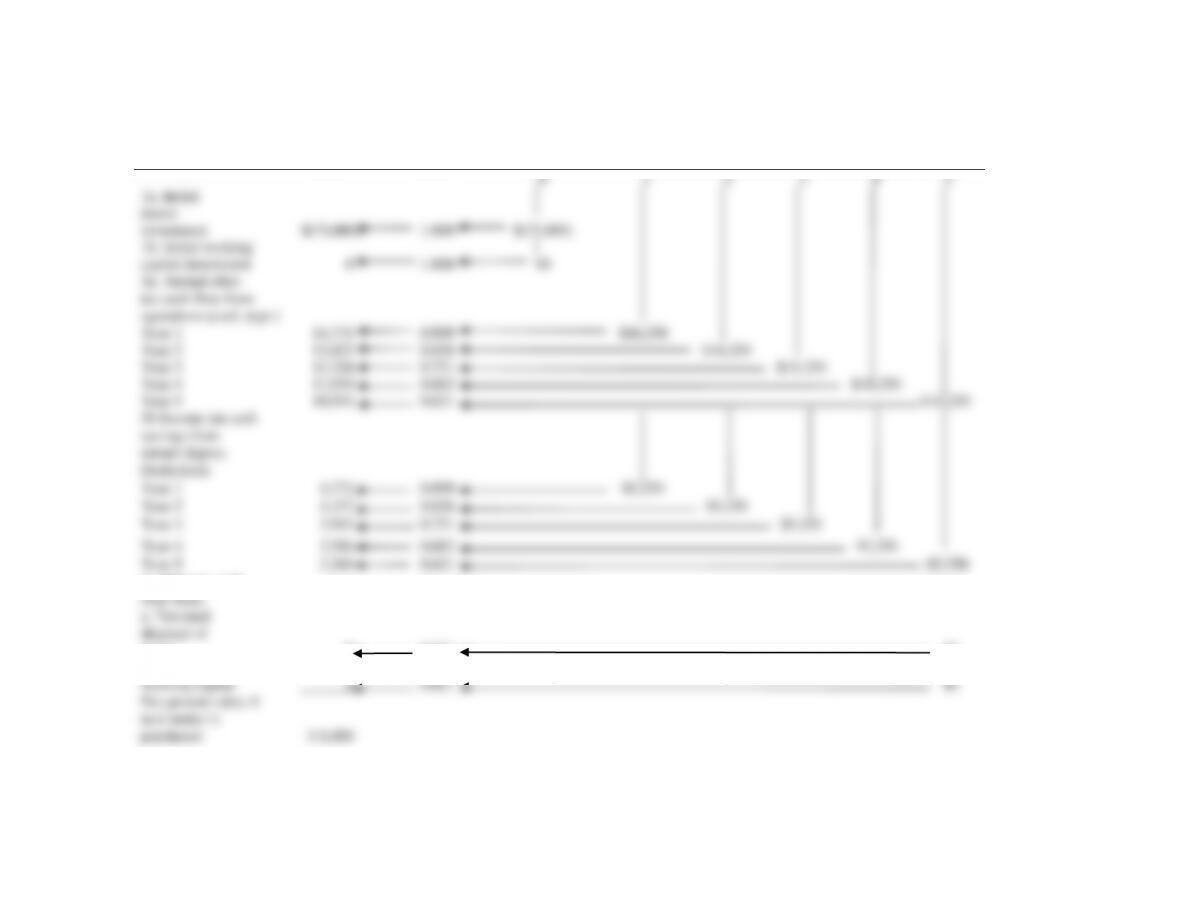
SOLUTION EXHIBIT 21-25
Total
Present
Value
Present Value
Discount
Factors
At 10%
Sketch of Relevant After-Tax Cash Flows
0
1
2
3
4
5
1a. Initial
motor
investment
$(75,000)
1.000
$(75,000)
1b. Initial working
capital investment
0
1.000
$0
2a. Annual after-
tax cash flow from
operations (excl. depr.)
Year 1
14,771
0.909
$16,250
Year 2
13,423
0.826
$16,250
Year 3
12,204
0.751
$16,250
Year 4
11,099
0.683
$16,250
Year 5
10,091
0.621
$16,250
2b Income tax cash
savings from
annual deprec.
Deductions
Year 1
4,772
0.909
$5250
Year 2
4,337
0.826
$5250
Year 3
3,943
0.751
$5250
Year 4
3,586
0.683
$5250
Year 5
3,260
0.621
$5250
3. After-tax cash
flow from:
a. Terminal
disposal of
motor
0
0.621
$0
b. Recovery of
working capital
0
0.621
$0
Net present value if
new motor is
purchased
$ 6,486
21-22
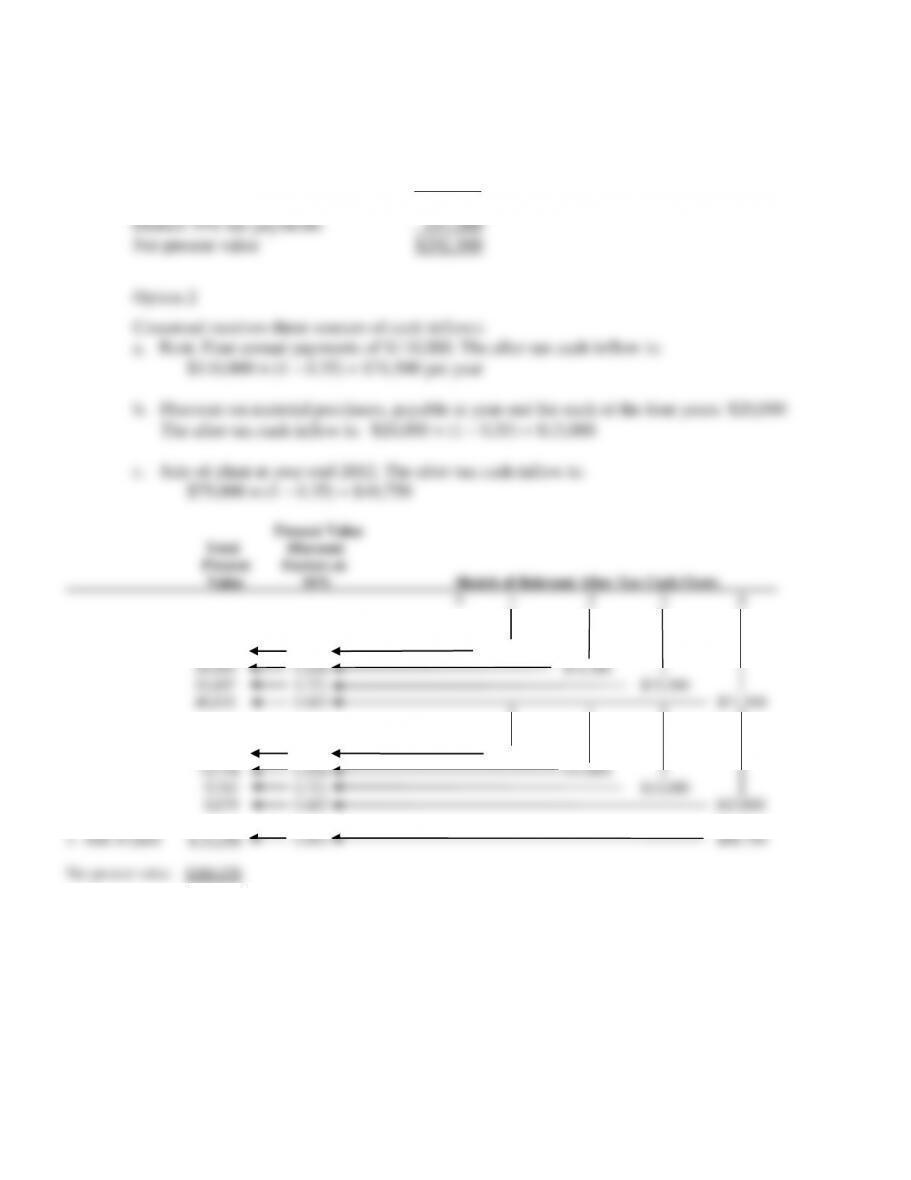
21-26 (60 min.) Selling a plant, income taxes.
1. Option 1
Current disposal price $450,000
Deduct current book value 0
Gain on disposal 450,000
1. Rent
` $ 64,994 0.909 $71,500
2. Discount on
Purchases $11,817 0.909 $13,000
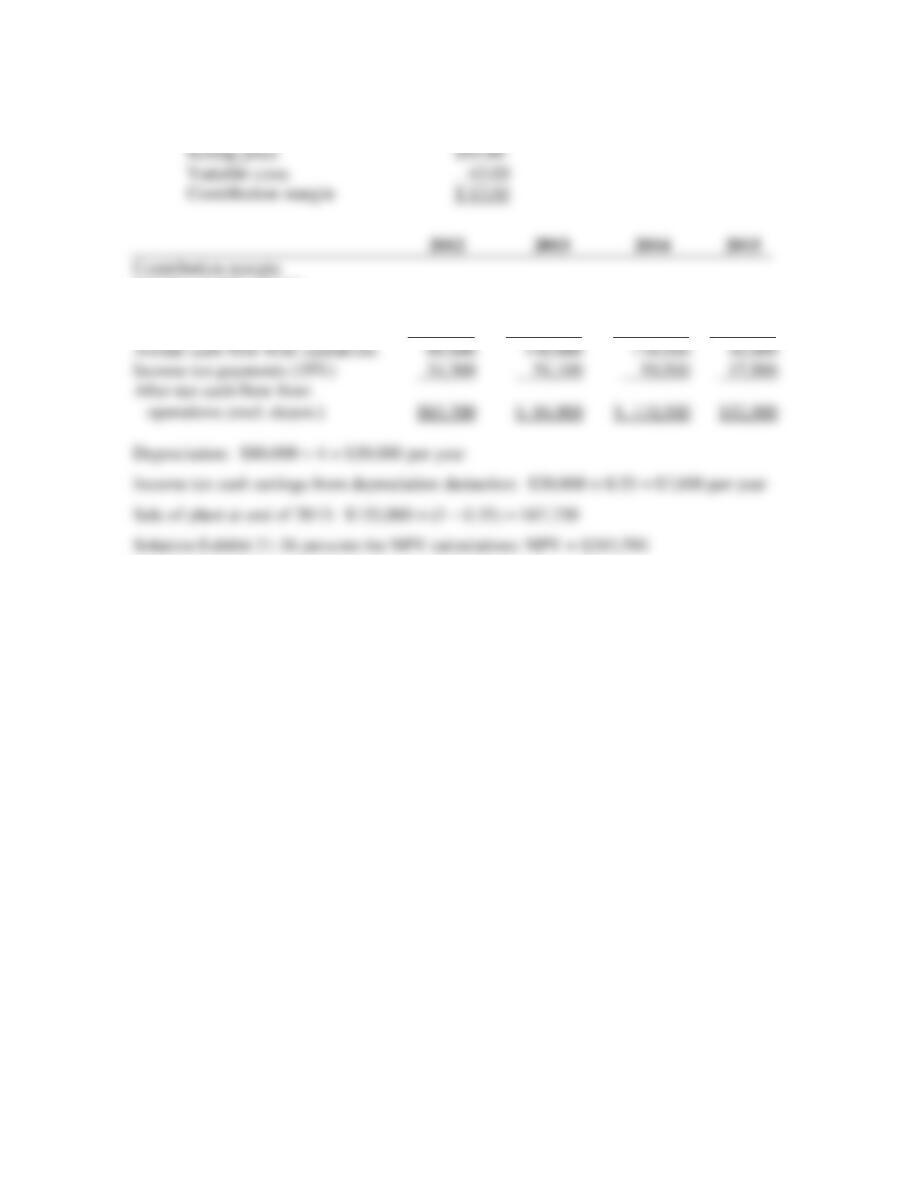
21-23
Option 3
Contribution margin per jacket:
$12.00 × 9,000; 13,000;
15,000; 5,000 $108,000 $156,000 $180,000 $60,000
Fixed overhead (cash) costs 10,000 10,000 10,000 10,000
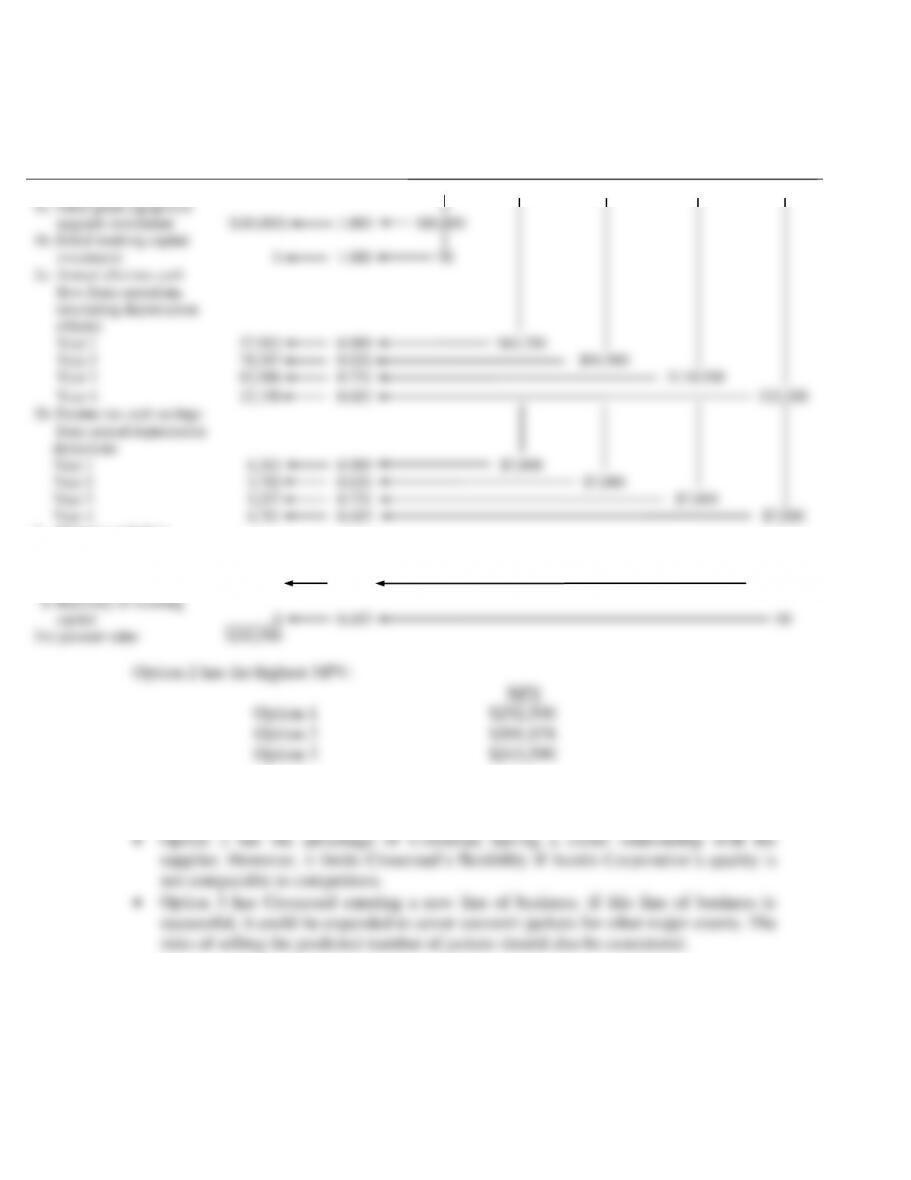
SOLUTION EXHIBIT 21-26
Total
Present
Value
Present Value
Discount
Factors at
10%
Sketch of Relevant After-Tax Cash Flows
2011
2012
2013
2014
2015
1a. Initial plant equipment
upgrade investment
$(80,000)
1.000
$80,000
1b. Initial working capital
investment
0
1.000
$0
2a. Annual after-tax cash
flow from operations
(excluding depreciation
effects)
Year 1
57,903
0.909
$63,700
Year 2
78,387
0.826
$94,900
Year 3
82,986
0.751
$110,500
Year 4
22,198
0.683
$32,500
2b. Income tax cash savings
from annual depreciation
deductions
Year 1
6,363
0.909
$7,000
Year 2
5,782
0.826
$7,000
Year 3
5,257
0.751
$7,000
Year 4
4,781
0.683
$7,000
3. After-tax cash flow
From
a. Terminal disposal
of plant
59,933
0.683
$87,750
b. Recovery of working
capital
0
0.683
$0
Net present value
$243,590
2. Nonfinancial factors that Crossroad should consider include the following:
• Option 1 gives Crossroad immediate liquidity which it can use for other projects.
21-25
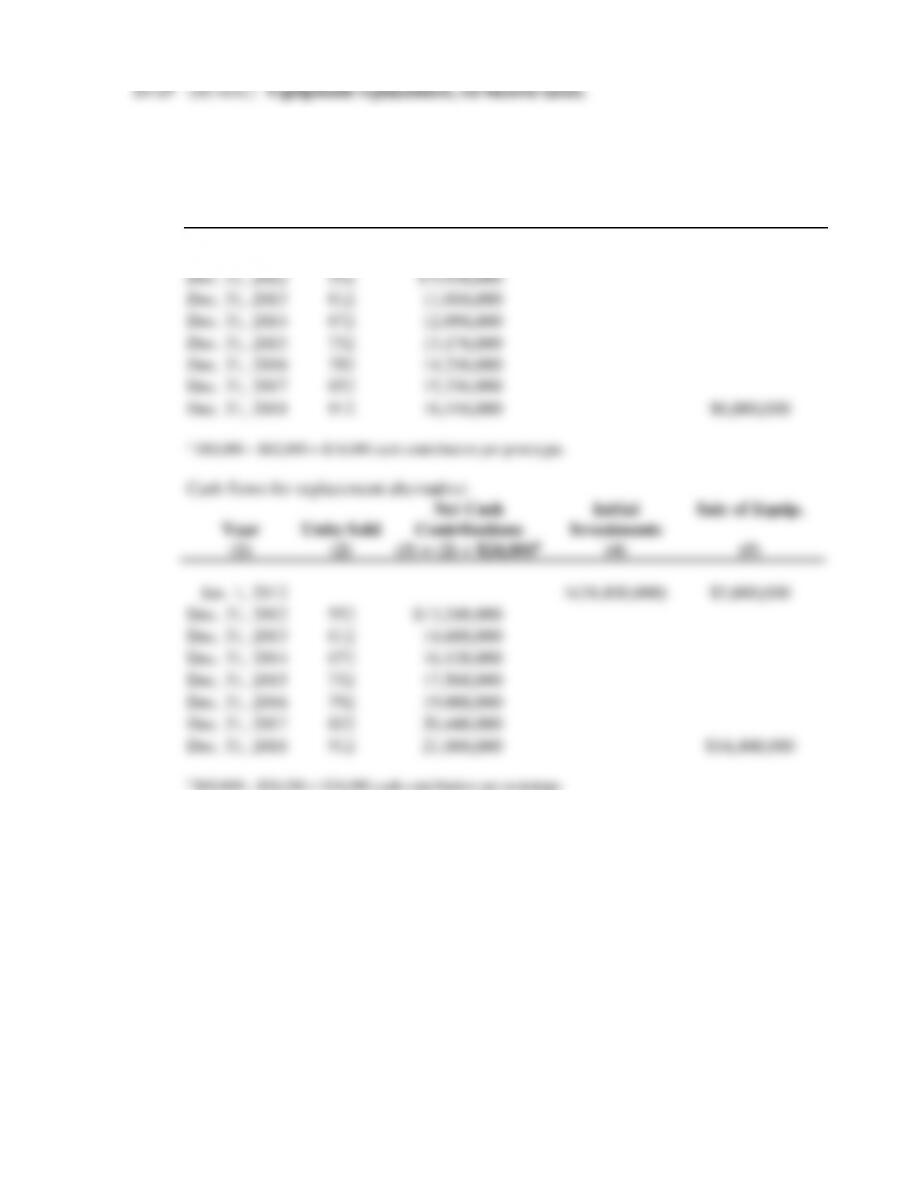
1. Cash flows for modernizing alternative:
Net Cash Initial Sale of Equip.
Year Units Sold Contributions Investments at Termination
(1) (2) (3) = (2) × $18,000a (4) (5)
Jan. 1, 2012 –– –– $(33,600,000) ––
21-26
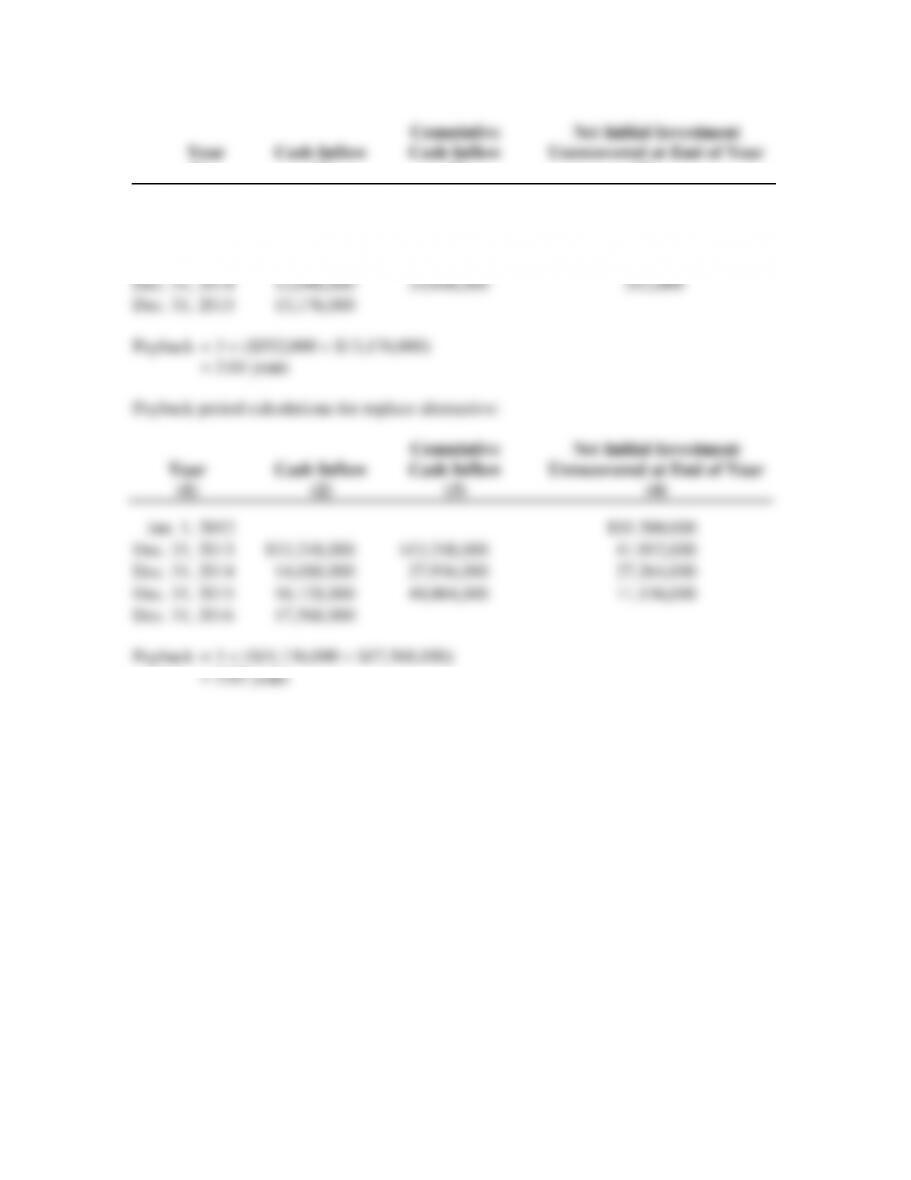
2. Payback period calculations for modernizing alternative:
(1) (2) (3) (4)
Jan. 1, 2012 –– –– $33,600,000
Dec. 31, 2012 $ 9,936000 $ 9,936000 23,664000
Dec. 31, 2013 11,016000 20,952000 12,648000
21-27
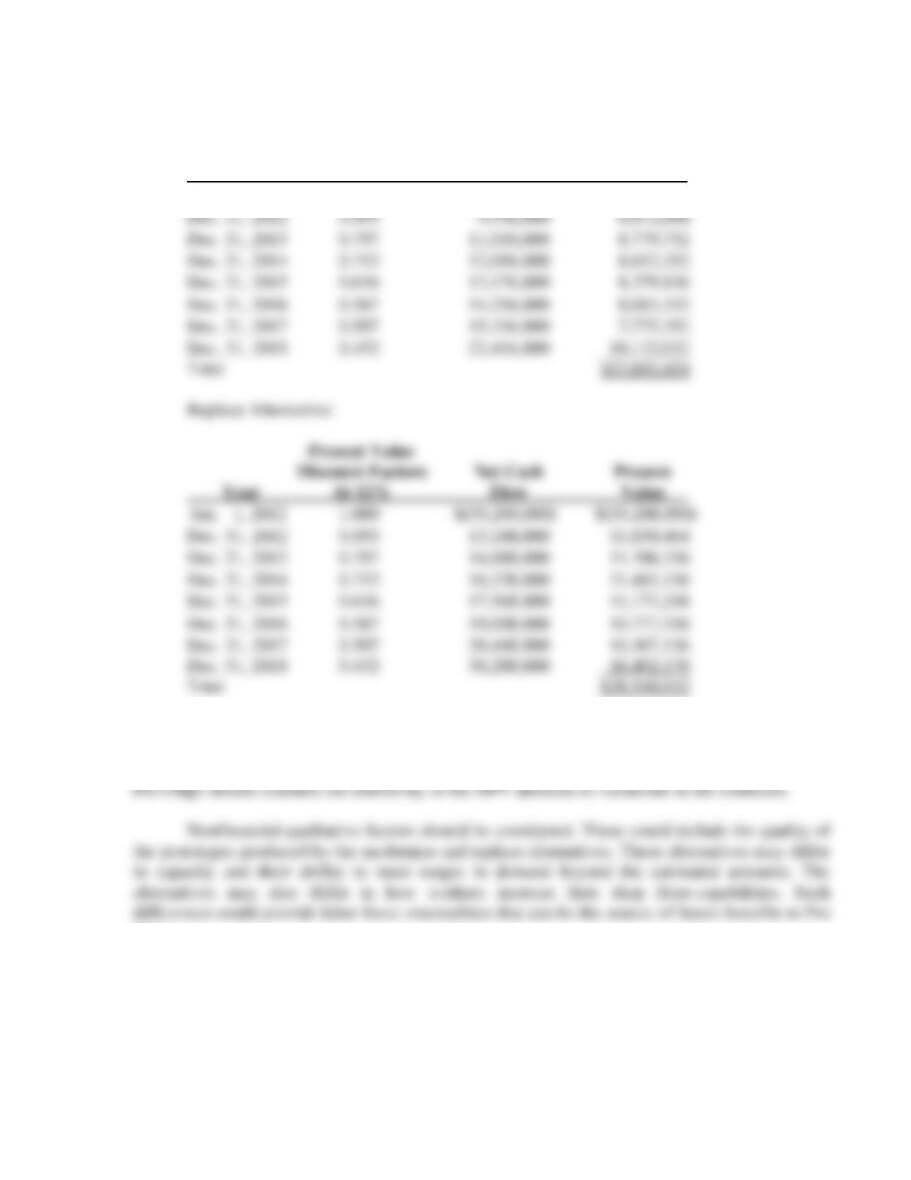
3. Modernizing alternative:
Present Value
Discount Factors Net Cash Present
Year At 12% Flow Value
Jan. 1, 2012 1.000 $(33,600000) $(33,600,000)
4. Using the payback period, the modernize alternative is preferred to the replace
alternative. On the other hand, the replace alternative has a higher NPV than the modernize
alternative and so should be preferred. However, the NPV amounts are based on best estimates.
Chips.
21-28
21-28 (40 min.) Equipment replacement, income taxes (continuation of 21-27).
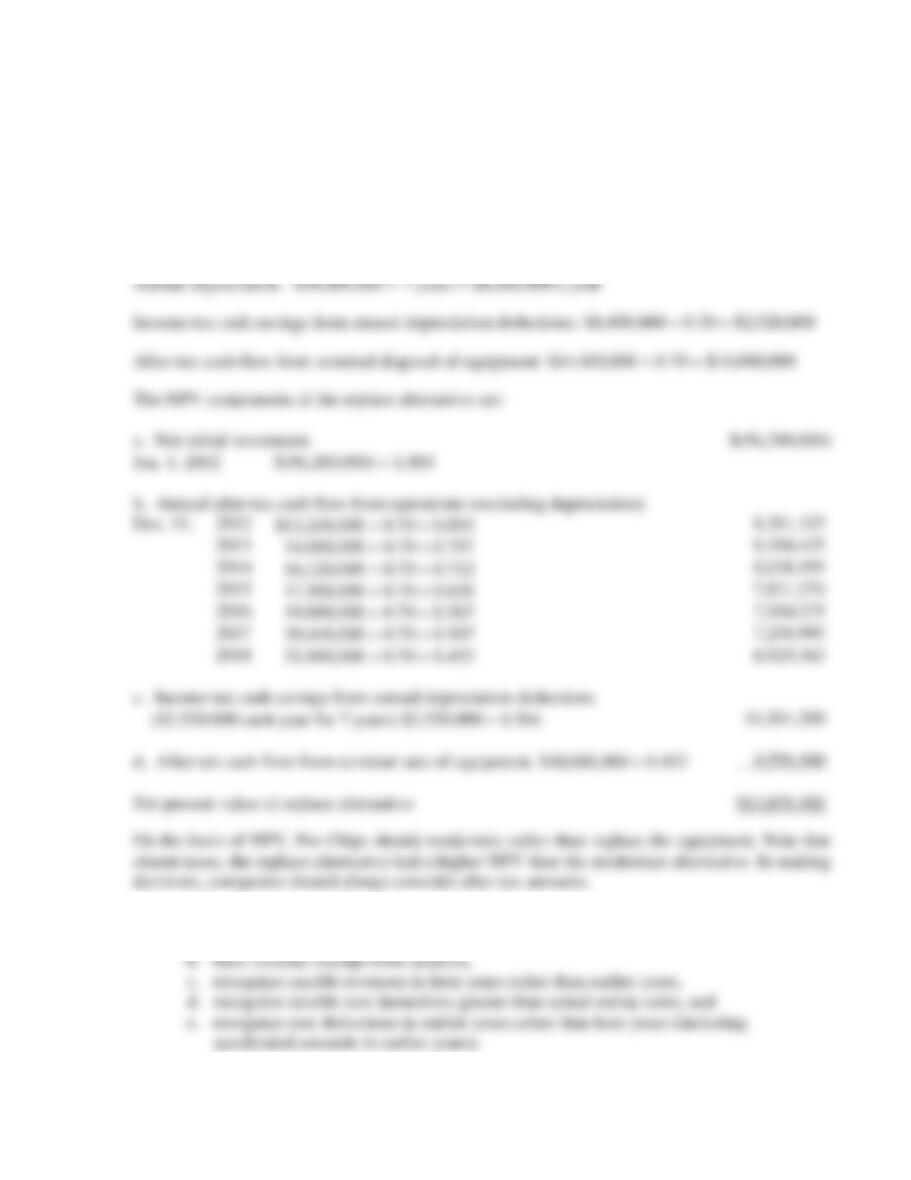
1. & 2. Income tax rate = 30%
Modernize Alternative
Annual depreciation:
$33,600000 7 years = $4800000 a year.
Income tax cash savings from annual depreciation deductions:
21-29
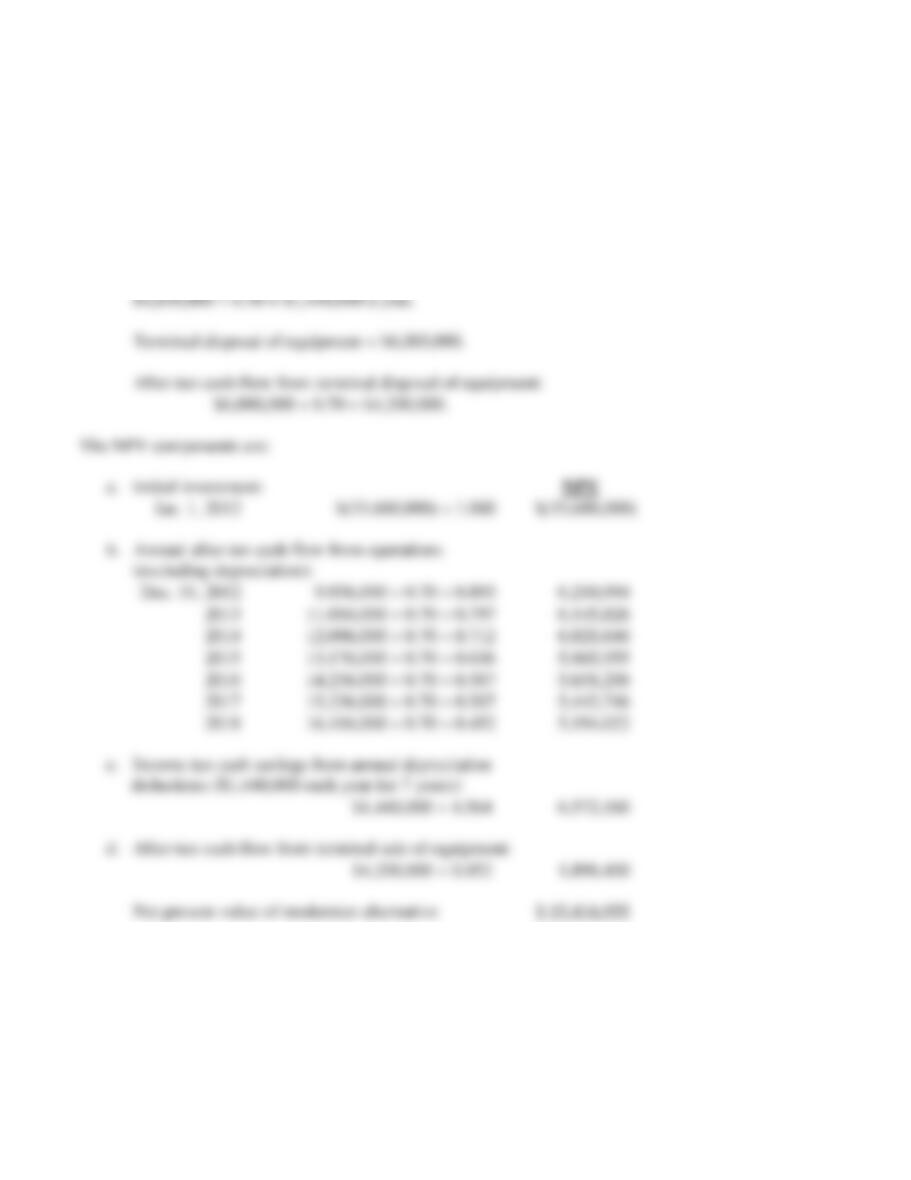
Replace alternative
Initial machine replacement = $58,800,000
Sale on Jan. 1, 2012, of equipment = $3,600,000
After-tax cash flow from sale of old equipment: $3,600,000 0.70 = $2,520,000
Net initial investment: $58,800,000 − $2,520,000 = $56,280,000
3. Pro Chips would prefer to:
a. have lower tax rates,
21-30
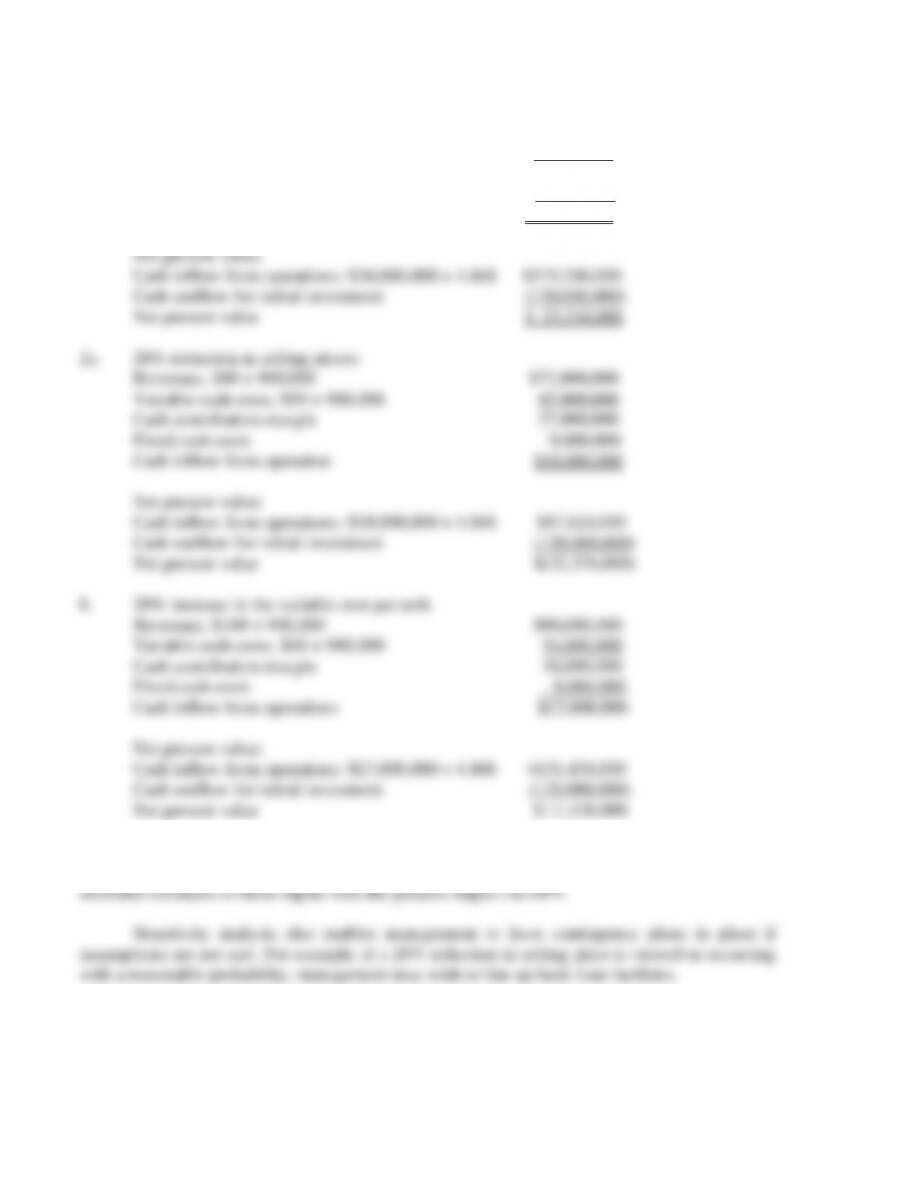
21-29 (20 min.) DCF, sensitivity analysis, no income taxes.
1. Revenues, $100 × 900,000 $90,000,000
Variable cash costs, $50 × 900,000 45,000,000
Cash contribution margin 45,000,000
Fixed cash costs 9,000,000
Cash inflow from operations $36,000,000
3. Sensitivity analysis enables management to see those assumptions for which input
variations have sizable impact on NPV. Extra resources could be devoted to getting more