146
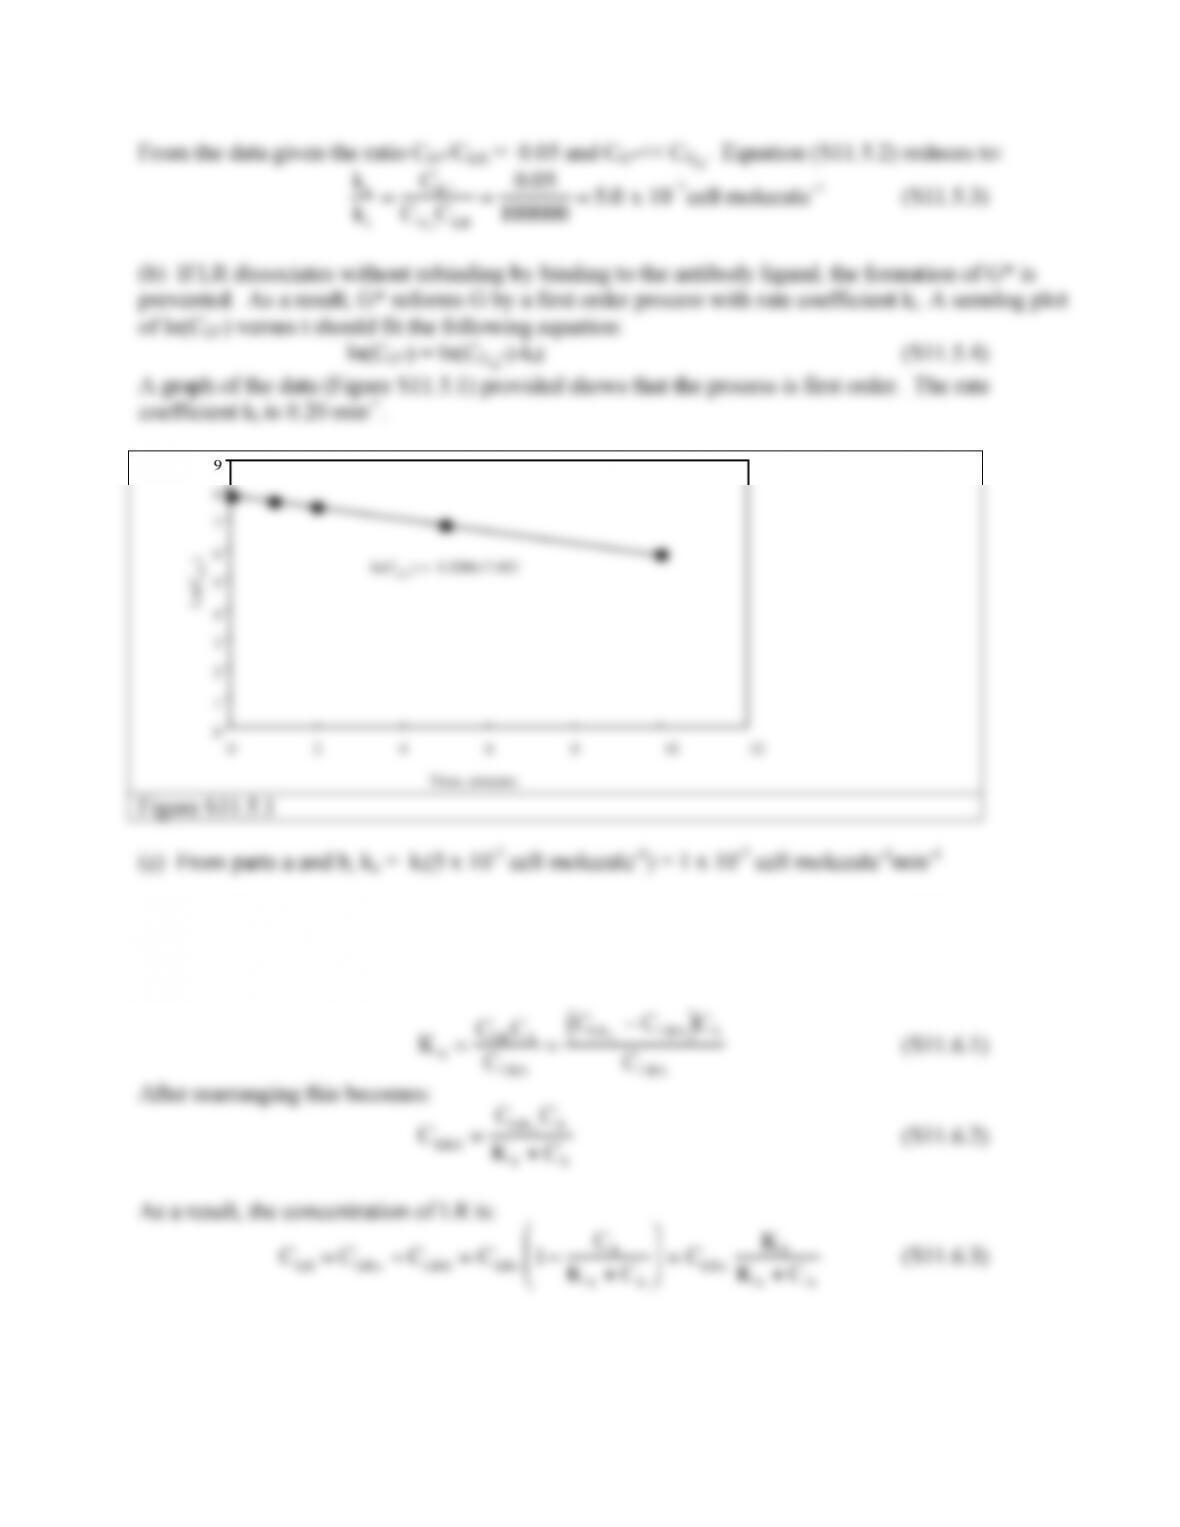
From the data given the ratio CG*/CLR = 0.05 and CG*<< CGo. Equation (S11.5.2) reduces to:
arrestin concentration can be assumed to be constant and equal to the total arrestin concentration.
The equilibrium expression for LRA formation is;
KA=CLR CA
CLRA
=
CLR T
−CLRA
( )
CA
CLRA
(S11.6.1)
(b) Inserting Equation (S11.6.3) into Equation (S11.6.1) yields the following relation between G*
and arrestin:
147
ka
ki
=CG *
CGo
CLR
=CG*
CGo
CLRT
KA+CA
KA
⎛
⎝
⎜
⎜
⎞
⎠
⎟
⎟
(S11.6.4a)
11.7. There are two different receptors on the cell surface. The unlabeled ligand binds to all of the
high affinity sites so that dissociation is associated with the low affinity receptor. In the absence of
unlabeled ligand during binding dissociation follows two exponentials. To assess whether this is
11.8. The rate expression for a noncompetitive inhibitor is:
KM
KM
⎝
⎜
⎠
⎟
KD 11
⎝
⎜
⎠
⎟
148
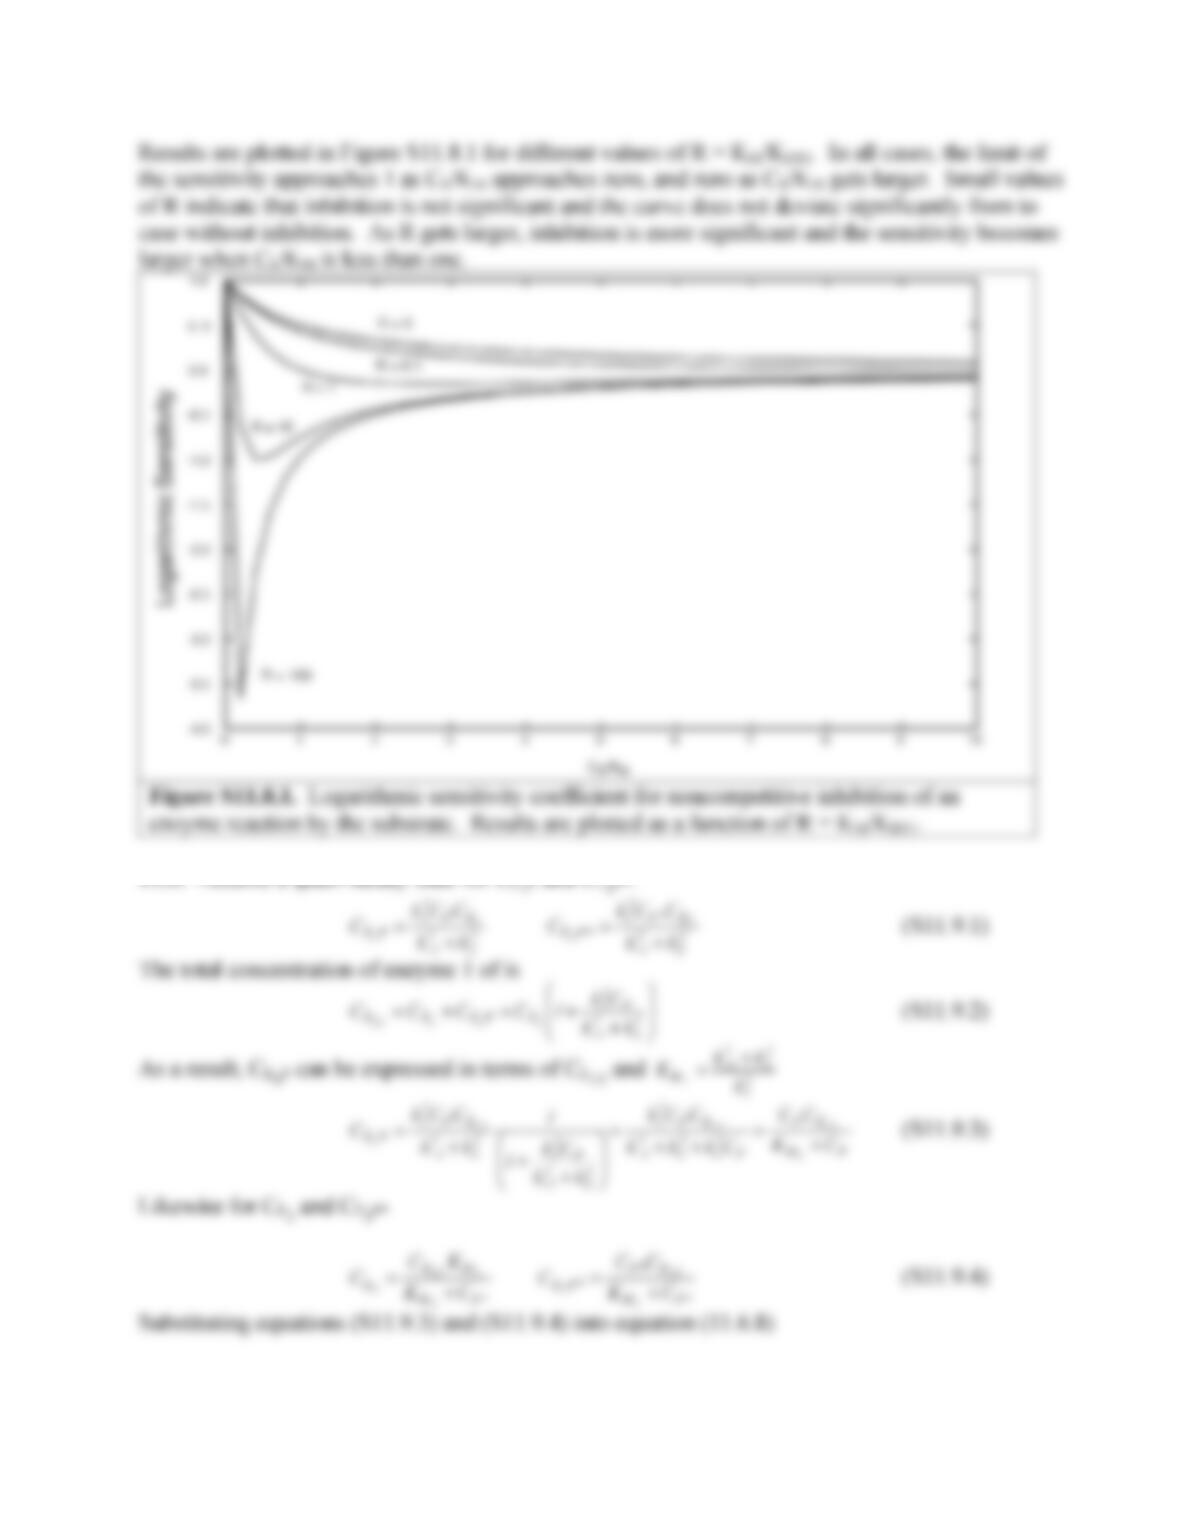
Results are plotted in Figure S11.8.1 for different values of R = KM/KD11. In all cases, the limit of
11.9. Assume a quasi-steady state for CE1P and CE2P*.
CE1P=
k1
1CPCE1
k−1
1+k2
1 CE2P * =
k1
2CP *CE2
k−1
2+k2
2
(S11.9.1)
149
dCP*
dt
=
k2
1CPCE1T
KM1+CP
–
k1
2CP*CE2T
KM2
KM2+CP*
+
k-1
1CP*CE2T
KM2+CP*
=
k2
1CPCE1T
KM1+CP
–
k-1
2+k2
2
( )
CP*CE2T
KM2+CP*
+
k-1
1CP*CE2T
KM2+CP*
(S11.9.5)
Simplifying yields the desired result:
dCP*
dt
=
k2
1CPCE1 T
KM1
+CP
–
k2
2CP*CE2 T
KM2
+CP *
(S11.9.6)
11.10. (a) At steady state with no ligand present (CLo = NC = 0), equation (11.10.7) for NRi is solved
to yield:
NRi=keR
kdeg fR+krec 1−fR
( )
NRS
(S11.10.1)
Substituting this relation into equation (11.6.5) yields the following expression for the rate of
synthesis VS:
Vs=keR NRS
−krec 1−fR
( )
keR
kdeg fR+krec 1−fR
( )
NRS=keR kdeg fR
kdeg fR+krec 1−fR
( )
NRS
(S11.10.2)
Substituting values provided yields the following:
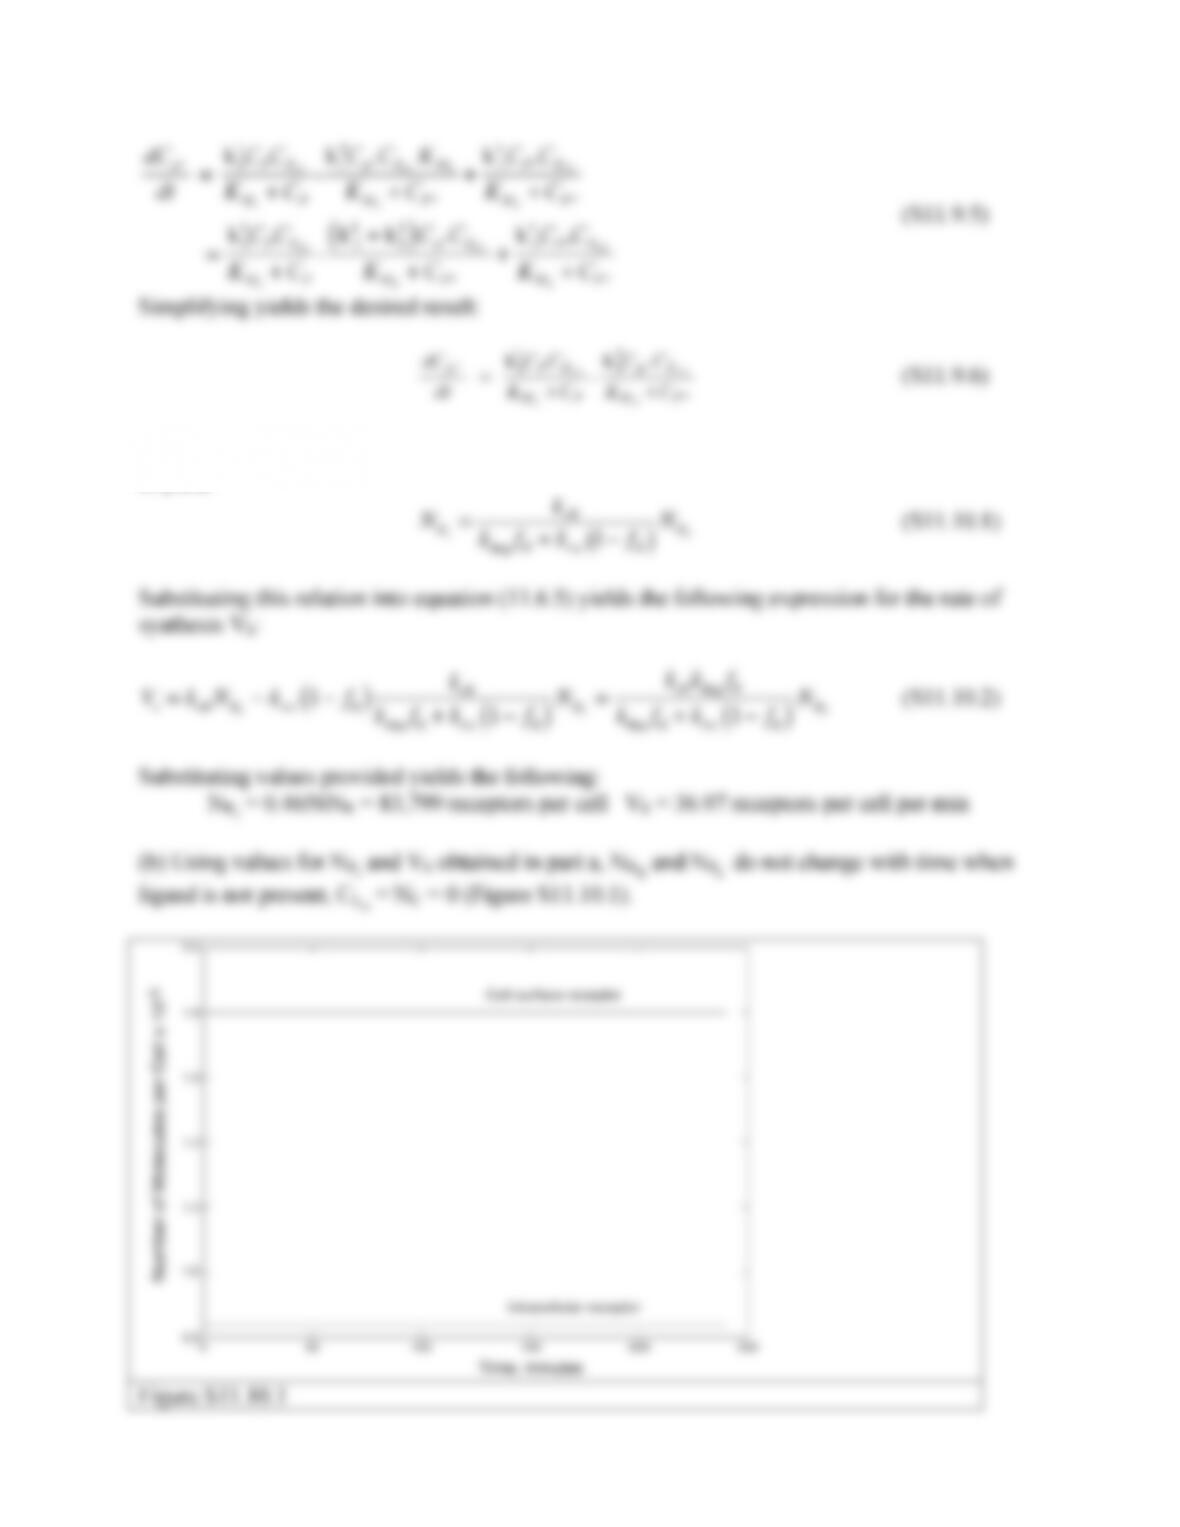
NRi = 0.4656NR = 83,799 receptors per cell VS = 36.97 receptors per cell per min
(b) Using values for NRi and VS obtained in part a, NRS and NRi do not change with time when
ligand is not present, CLo = NC = 0 (Figure S11.10.1).
Figure S11.10.1
150
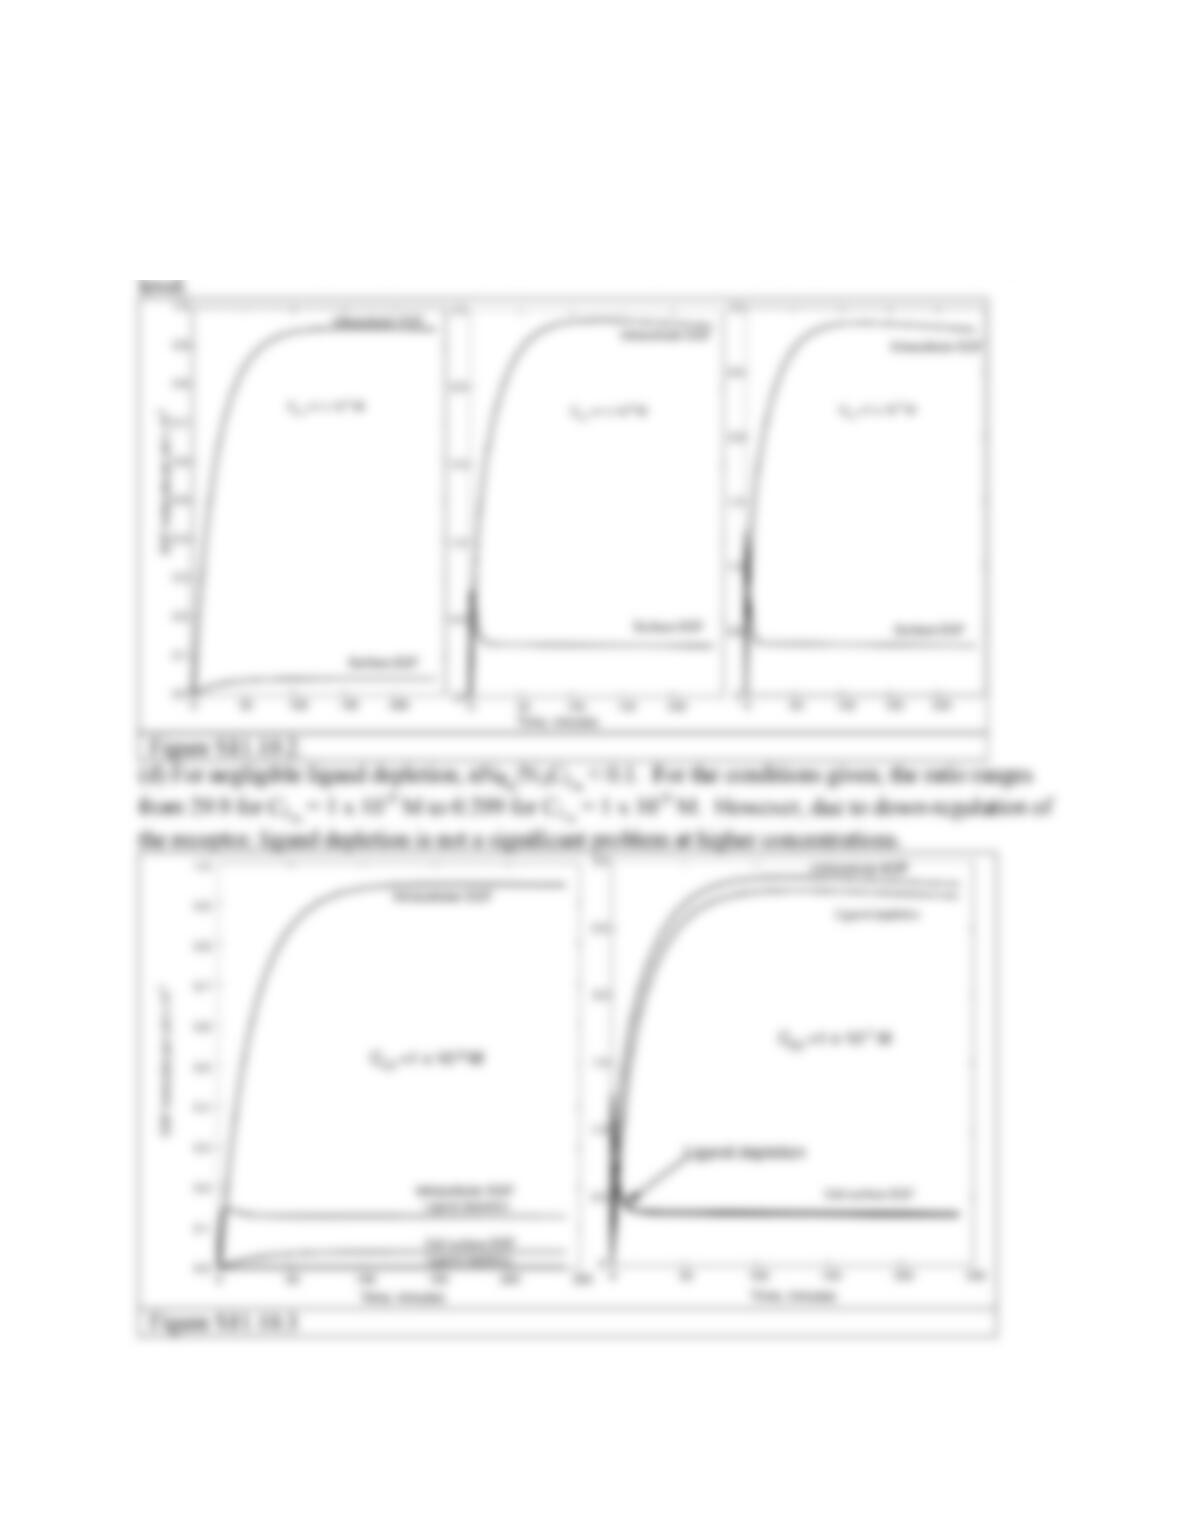
(c) Representative plots are shown in Figure S11.10.2. For all cases, the concentration of
intracellular EGF exceeds the concentration of surface bound EGF. Regulation of surface bound
EGF due to more rapid internalization of complex is evident at ligand concentrations of 1 x 10⁻⁸ M
and 1 x 10⁻⁷ M. After initial rise in surface bound EGF, there is a rapid decline to a new steady state
level.
151
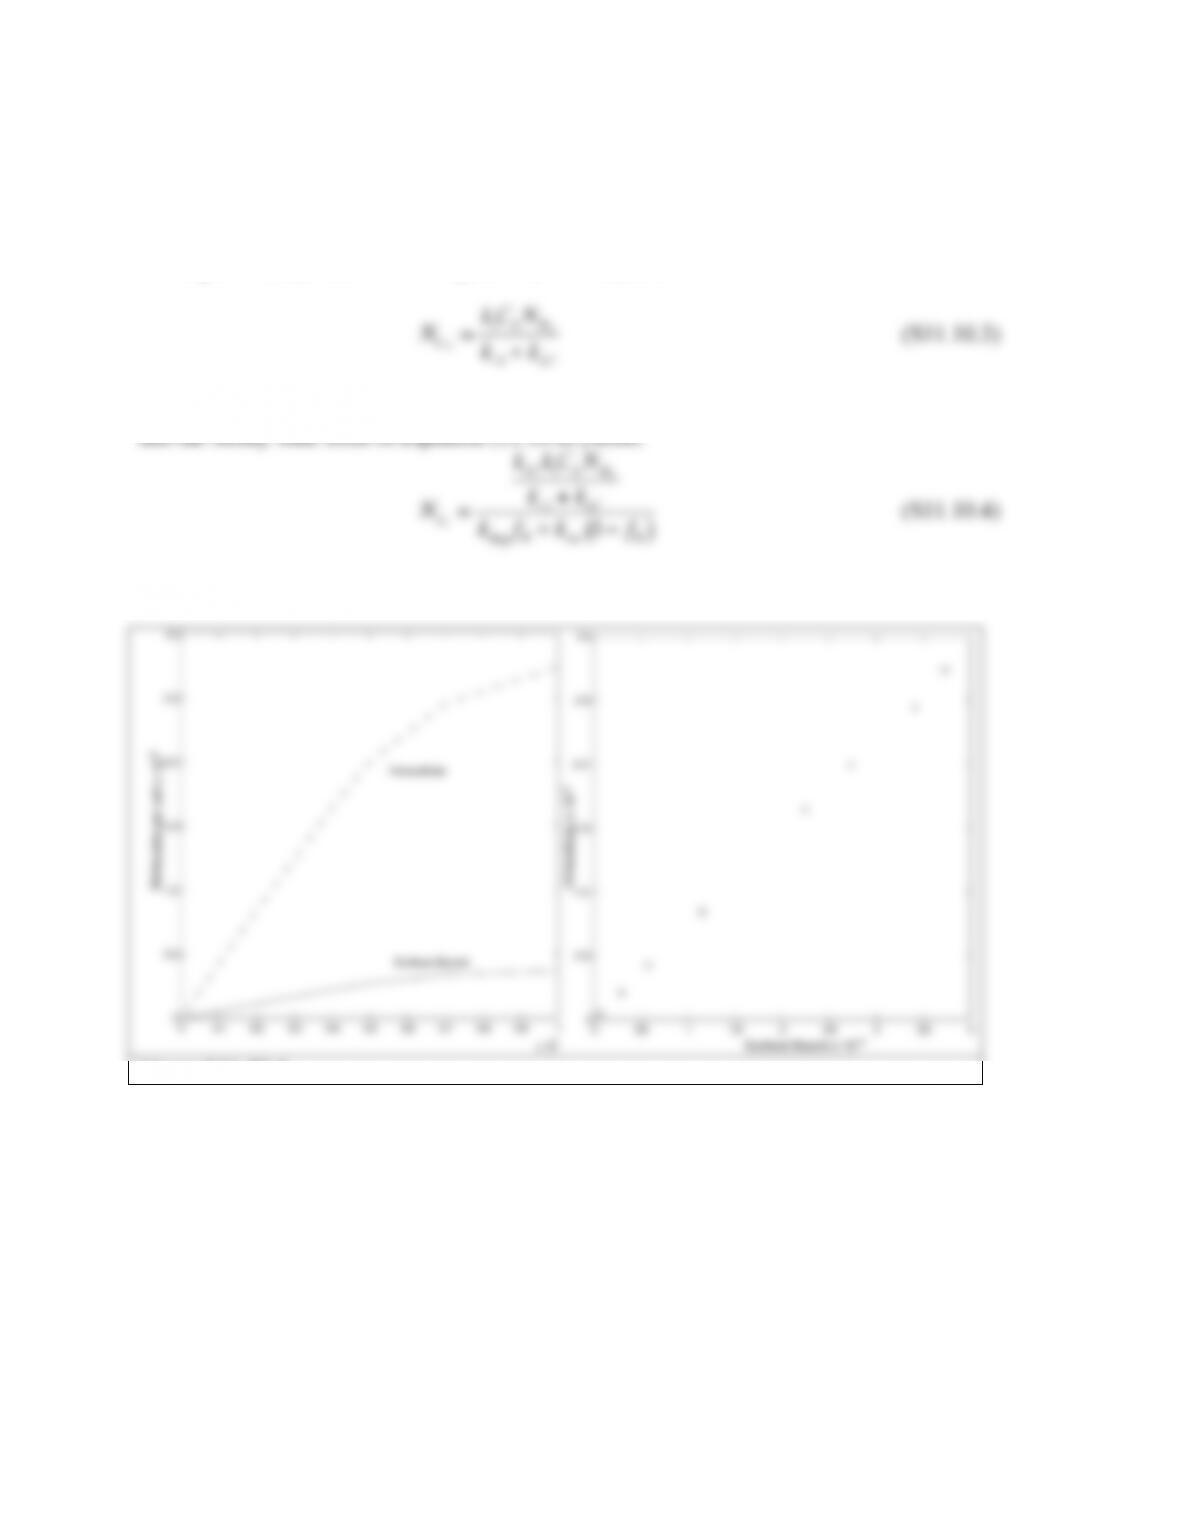
(e) Steady state levels were calculated for binding at 240 minutes and are plotted in Figure S11.10.4.
The curves resemble a binding isotherm but the amount bound to the surface receptors is far less than
the total number of receptors. This is because receptors are internalized. However, the level at 240
minutes can be predicted assuming steady state and using the values of CL and NRS at 240 minutes.
Solving the steady state form of Equation (11.10.6) yields:
Agreement between this result and simulated values at 240 minutes is very good. Using this result
and the steady state form of Equation (11.10.8) yields;
Agreement with simulations should also be very good.
The major difference between class 1 and 2 receptors is that the binding curve for class 2 receptors
can be used to determine the total number of receptors on the cell. This can only be done with class
1 receptors by doing the experiment at 4 C when internalization is blocked. (Other answers that
contrast binding and internalization for the two receptor types are acceptable.)
(f) There are multiple ways to do this. Essentially one must isolate individual steps so that rate
constants can be uniquely determined. For example, k-1 and keC can be determined by performing
binding at 4 C, rinsing cells to 37 and then measuring loss of bound receptor and appearance of
ligand in the medium at 37 C. The initial rate of disappearance from the surface equals (k-1 +
keC)NCS and the initial rate of appearance in the medium would equal k-1NCS. Thus k-1 and keC can
be separated. keR is more difficult to determine and requires separate measurements of loss of
152
receptors from the surface and blocking recycling. If the receptor can be labeled, then the
11.11. The mechanism is shown schematically as:
k+
This analysis predicts that the rate coefficient keC should change with time as receptor-ligand
complex binds to adaptor protein.
11.12. The reaction rate of each step can be written by adapting Equation (11.7.10). For the first
reaction in the cascade.
RP
1*=
dCP
1*
dt =
Rmax1
CT1
−CP
1*
( )
KM1+CT1
−CP
( )
−
Rmax2
CP
1*
KM2+CP
(S11.12.1)
153
The derivative of the rate with respect to CP1* is:
dRP
1*
dCP
1*
=−
Rmax1
KM1+CT1
−CP
1*
( )
+
Rmax1
CT1
−CP
1*
( )
KM1+CT1
−CP
1*
( )
( )
2−
Rmax2
KM2+CP
1*
+
Rmax2
CP
1*
KM2+CP
1*
( )
2
(S11.12.2a)
Collecting terms simplifies Equation (S11.12.2a)
dRP
1*
dCP
1*
=−
Rmax1
KM1
KM1+CT1
−CP
1*
( )
( )
2−
Rmax2
KM2
KM2+CP
1*
( )
2
(S11.12.2b)
dRP
1*
dCP
1*
=−
Rmax1
KM1
KM2+CP
1*
( )
2
+Rmax2
KM2
KM1+CT1
−CP
1*
( )
( )
2
KM1+CT1
−CP
1*
( )
( )
2
KM2+CP
1*
( )
2
(S11.12.2c)
The logarithmic sensitivity coefficient for these reactions is:
SP
1*=
CP
1*
RP
1*
dRP
1*
dCP
1*
=−
CP
1*Rmax1
KM1
KM2+CP
1*
( )
2
+Rmax2
KM2
KM1+CT1−CP
1*
( )
( )
2
⎡
⎣
⎢
⎤
⎦
⎥
Rmax1
CT1−CP
1*
( )
KM2+CP
1*
( )
−Rmax2
CP
1*KM1+CT1−CP
1*
( )
( )
⎛
⎝
⎜ ⎞
⎠
⎟ KM1+CT1−CP
1*
( )
( )
KM2+CP
1*
( )
(S11.12.3)
Using the values from the legend to Figure 11.32a, KM1 =KM2 = 0.1CT1, R max1 = Rmax2, and C=
CP1*/CT1, the sensitivity is:
SP
1*=−
C 0.1 0.1 +C
( )
2+0.1 1.1 −C
( )
2
[ ]
1−C
( )
0.1 +C
( )
−C 1.1 −C
( )
( )
1.1 −C
( )
0.1 +C
( )
(S11.12.4)
For reactions 2 and 3 we have
RP2*=
dCP
1*
dt =
k
2
3CP
1*CT2
−CP2*
( )
KM3+CT2
−CP2*
( )
−
Rmax4
CP2*
KM4+CP2*
(S11.12.5a)
RP3*=
dCP
1*
dt =
k
2
5CP2*CT3
−CP3*
( )
KM5+CT3
−CP3*
( )
−
Rmax6
CP3*
KM6+CP3*
(S11.12.5b)
The corresponding sensitivities are
SP2*=−
CP2*k
2
3CP
1*KM3
KM3+CP2*
( )
2
+Rmax4
KM4
KM3+CT2−CP2*
( )
( )
2
⎡
⎣
⎢
⎤
⎦
⎥
k
2
3CP
1*CT2−CP2*
( )
KM4+CP2*
( )
−Rmax4
CP2*KM3+CT2−CP2*
( )
( )
⎛
⎝
⎜ ⎞
⎠
⎟ KM3+CT2−CP2*
( )
( )
KM4+CP2*
( )
SP3*=−
CP3*k
2
5CP2*KM5
KM5+CP3*
( )
2
+Rmax6
KM6
KM5+CT3−CP3*
( )
( )
2
⎡
⎣
⎢
⎤
⎦
⎥
k
2
5CP2*CT3−CP3*
( )
KM6+CP3*
( )
−Rmax6
CP3*KM5+CT3−CP3*
( )
( )
⎛
⎝
⎜ ⎞
⎠
⎟ KM5+CT3−CP3*
( )
( )
KM6+CP3*
( )
Using the parameter values from the legend to Figure 11.32
SP2*=−
C20.1C 0.1 +C2
( )
2+0.1 1.1 −C2
( )
2
[ ]
C 1 −C2
( )
0.1 +C2
( )
−C21.1 −C2
( )
( )
1.1 −C2
( )
0.1 +C2
( )
(S11.12.6a)
154
SP3*=−
C30.1C20.1 +C3
( )
2+0.1 1.1 −C3
( )
2
[ ]
C2CT3
−CP3*
( )
0.1 +C3
( )
−C31.1 −C3
( )
( )
1.1 −C3
( )
0.1 +C3
( )
(S11.12.6b)
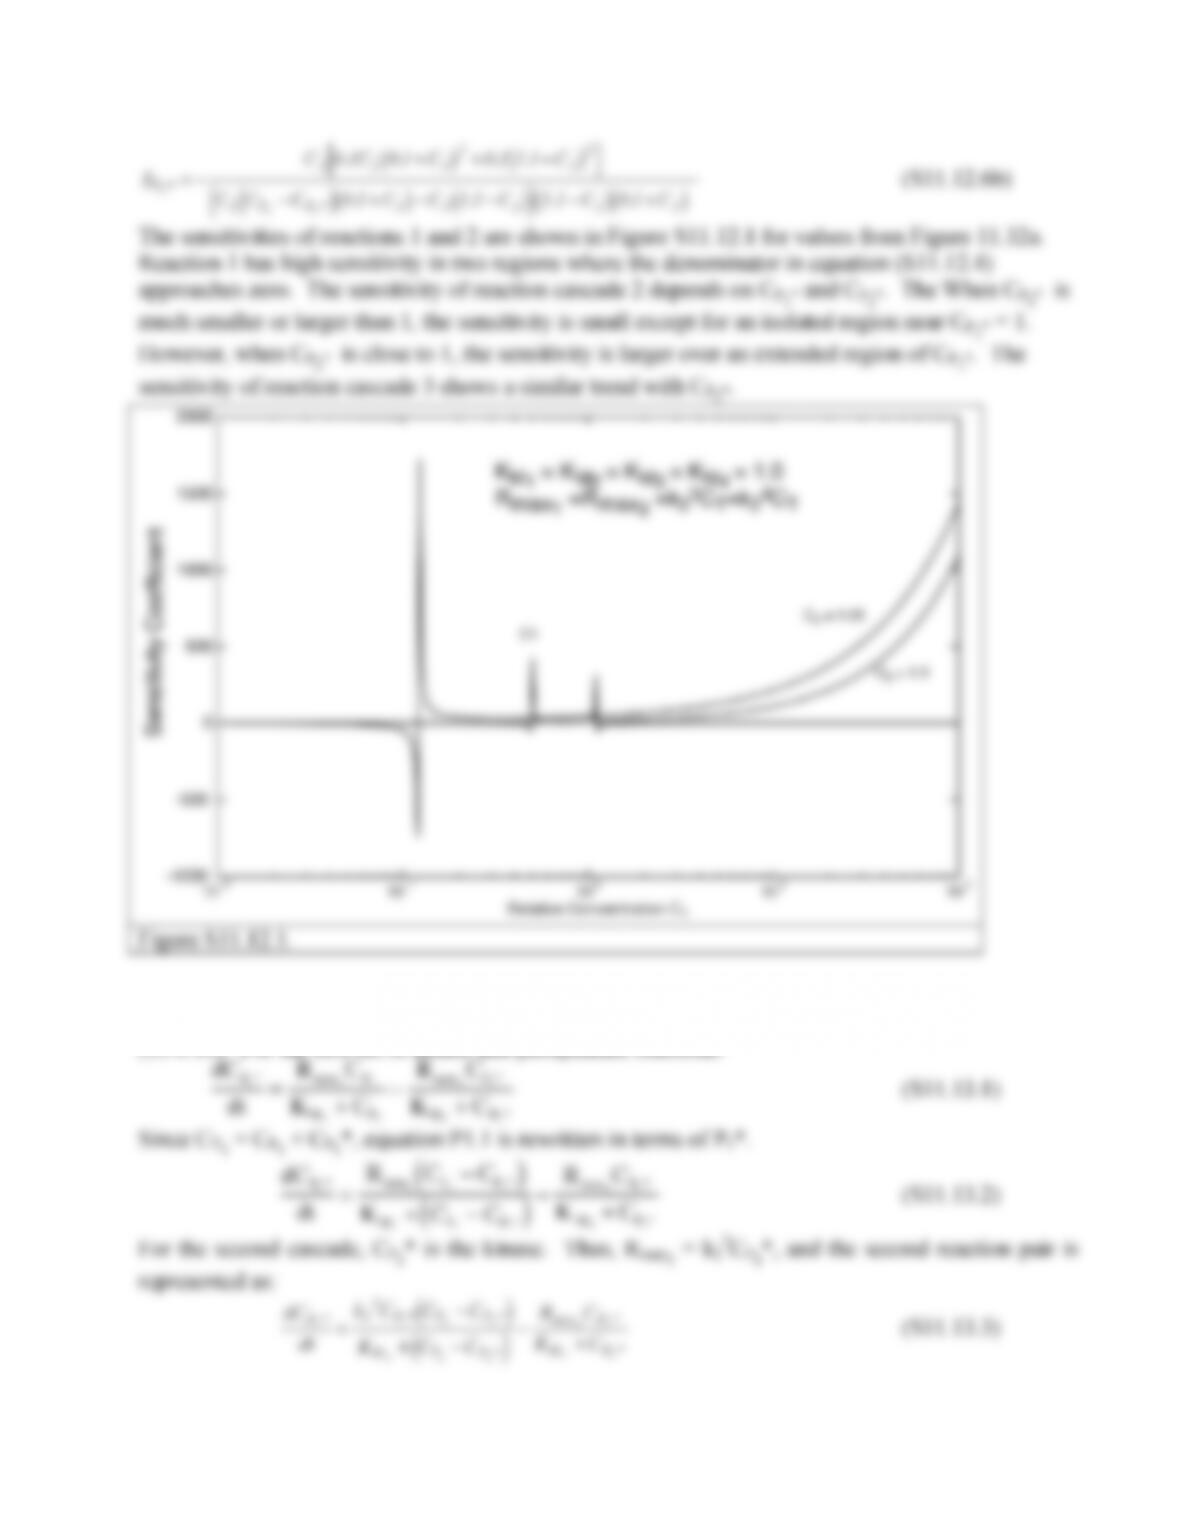
The sensitivities of reactions 1 and 2 are shown in Figure S11.12.1 for values from Figure 11.32a.
Reaction 1 has high sensitivity in two regions where the denominator in equation (S11.12.4)
approaches zero. The sensitivity of reaction cascade 2 depends on CP1* and CP2*. The When CP2* is
much smaller or larger than 1, the sensitivity is small except for an isolated region near CP1* = 1.
However, when CP2* is close to 1, the sensitivity is larger over an extended region of CP1*. The
sensitivity of reaction cascade 3 shows a similar trend with CP2*.
Figure S11.12.1.
11.13. There are three reactions in the cascade that can be assembled from Figure 11.38 and equation
(11.6.10). For the first set of kinase and phosphatase reactions:
dCP
1*
dt
=
Rmax 1
CP
1
KM1
+CP1
−
Rmax 2
CP1*
KM2
+CP
1*
(S11.13.1)
Since CT1 = CP1 + CP1*, equation P1.1 is rewritten in terms of P1*.
dCP
1*
dt =
Rmax1
CT1
−CP1*
( )
KM1+CT1
−CP1*
( )
−
Rmax2
CP
1*
KM2+CP1*
(S11.13.2)
For the second cascade, CP1* is the kinase. Thus, Rmax3 = k23CP1*, and the second reaction pair is
represented as:
dCP2*
dt =
k2
3CP
1*CT2
−CP2*
( )
KM3+CT2
−CP2*
( )
−
Rmax4
CP2*
KM4+CP2*
(S11.13.3)
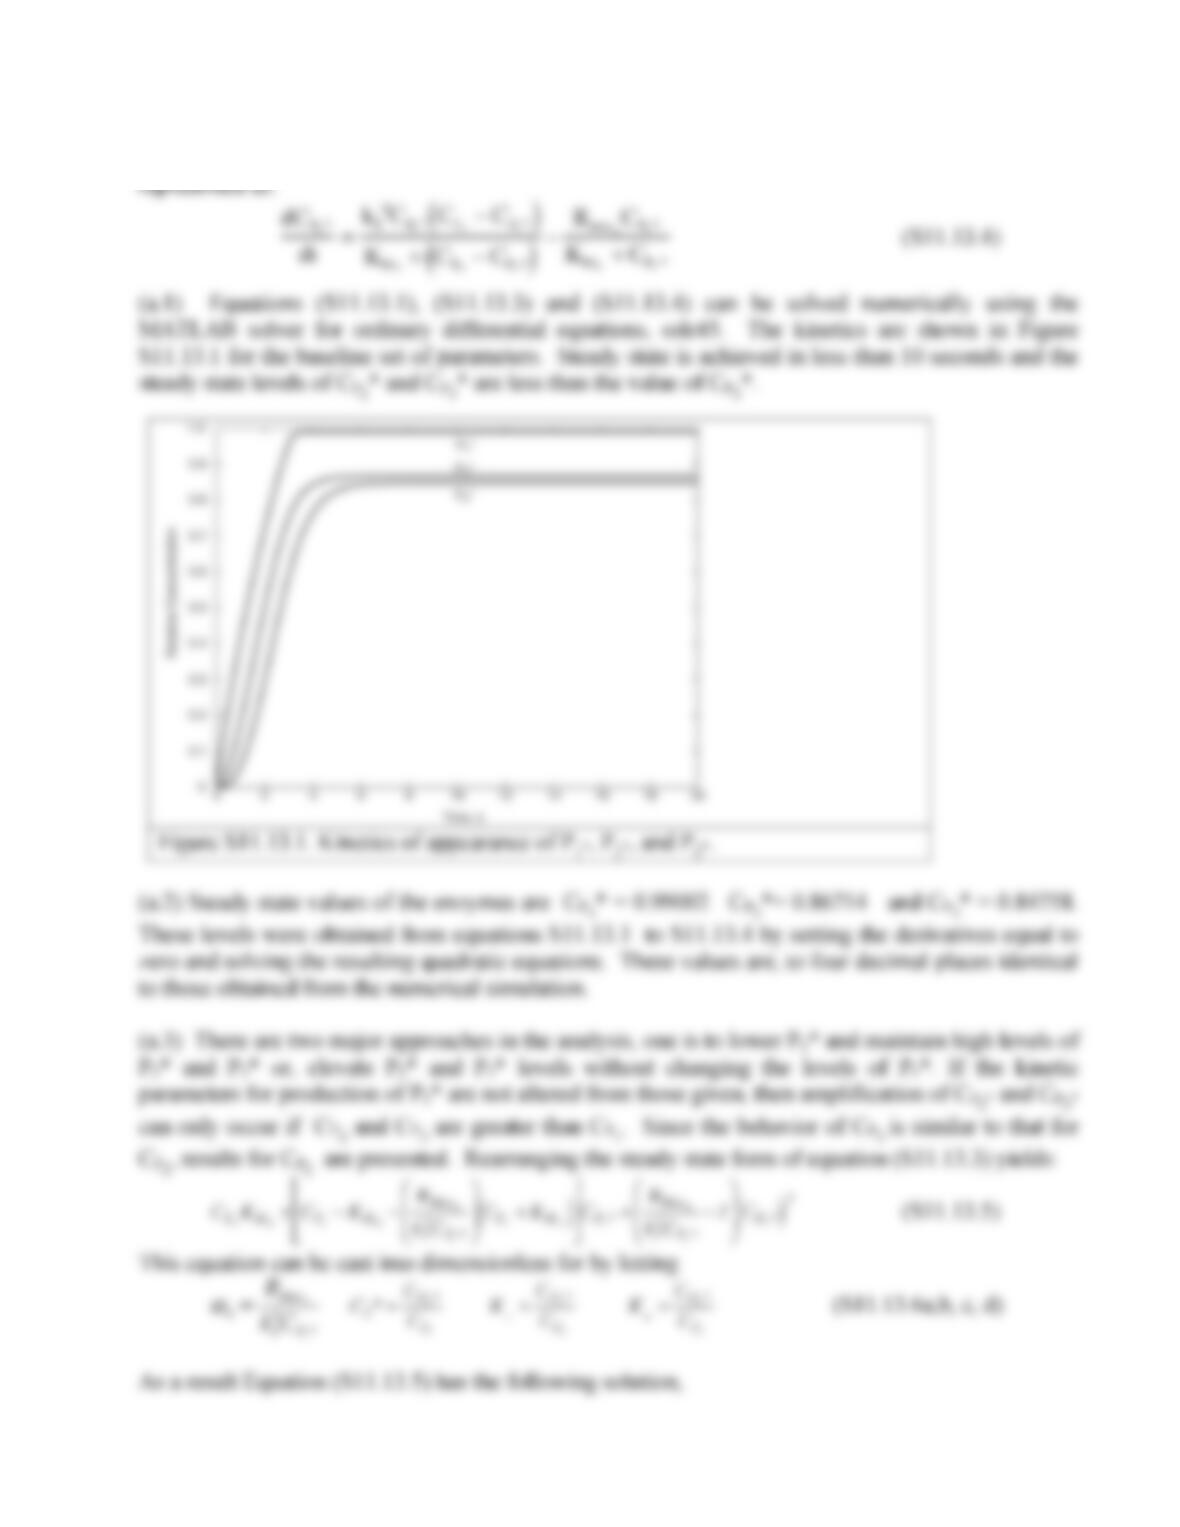
155
Likewise for the third cascade, CP2* is the kinase. Thus, Rmax5 = k25CP2* and the reaction pair is
represented as:
5CP
156
C2*=−
β
2−
β
2
2−4
α
2−1
( )
K
4
2
α
( )
(S11.13.7)
157
C2*=
CP2*
CT2
=−
β
2−
β
2
2−4
α
1/C1*−1
( )
K4
2
α
1C1*−1
( )
(S11.13.10)
C3*=
CP3*
CT3
=−
β
3−
β
3
2−4
α
3/C2*−1
( )
K6
2
α
3/C2*−1
( )
(S11.13.11)
where
α
3=
RMax6
k2
5CT2
β
3=1−K6−
α
3/C2*
( )
1+K5
( )
(S11.13.12a,b)
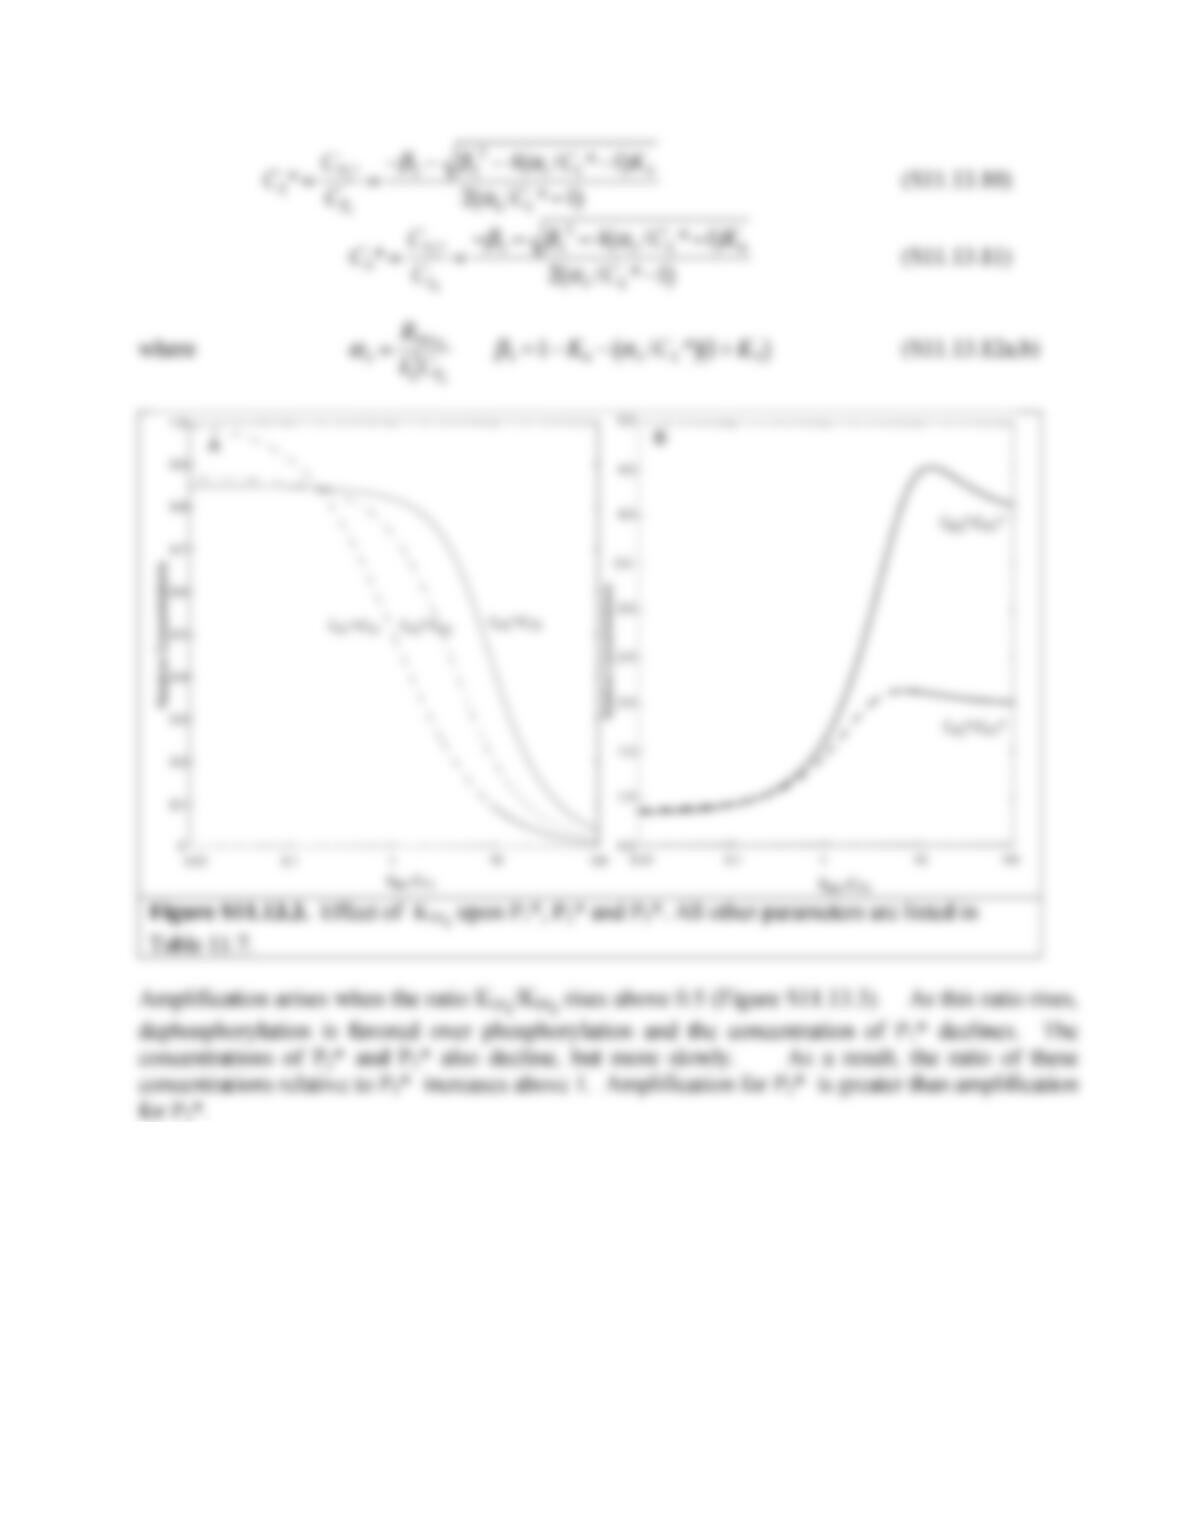
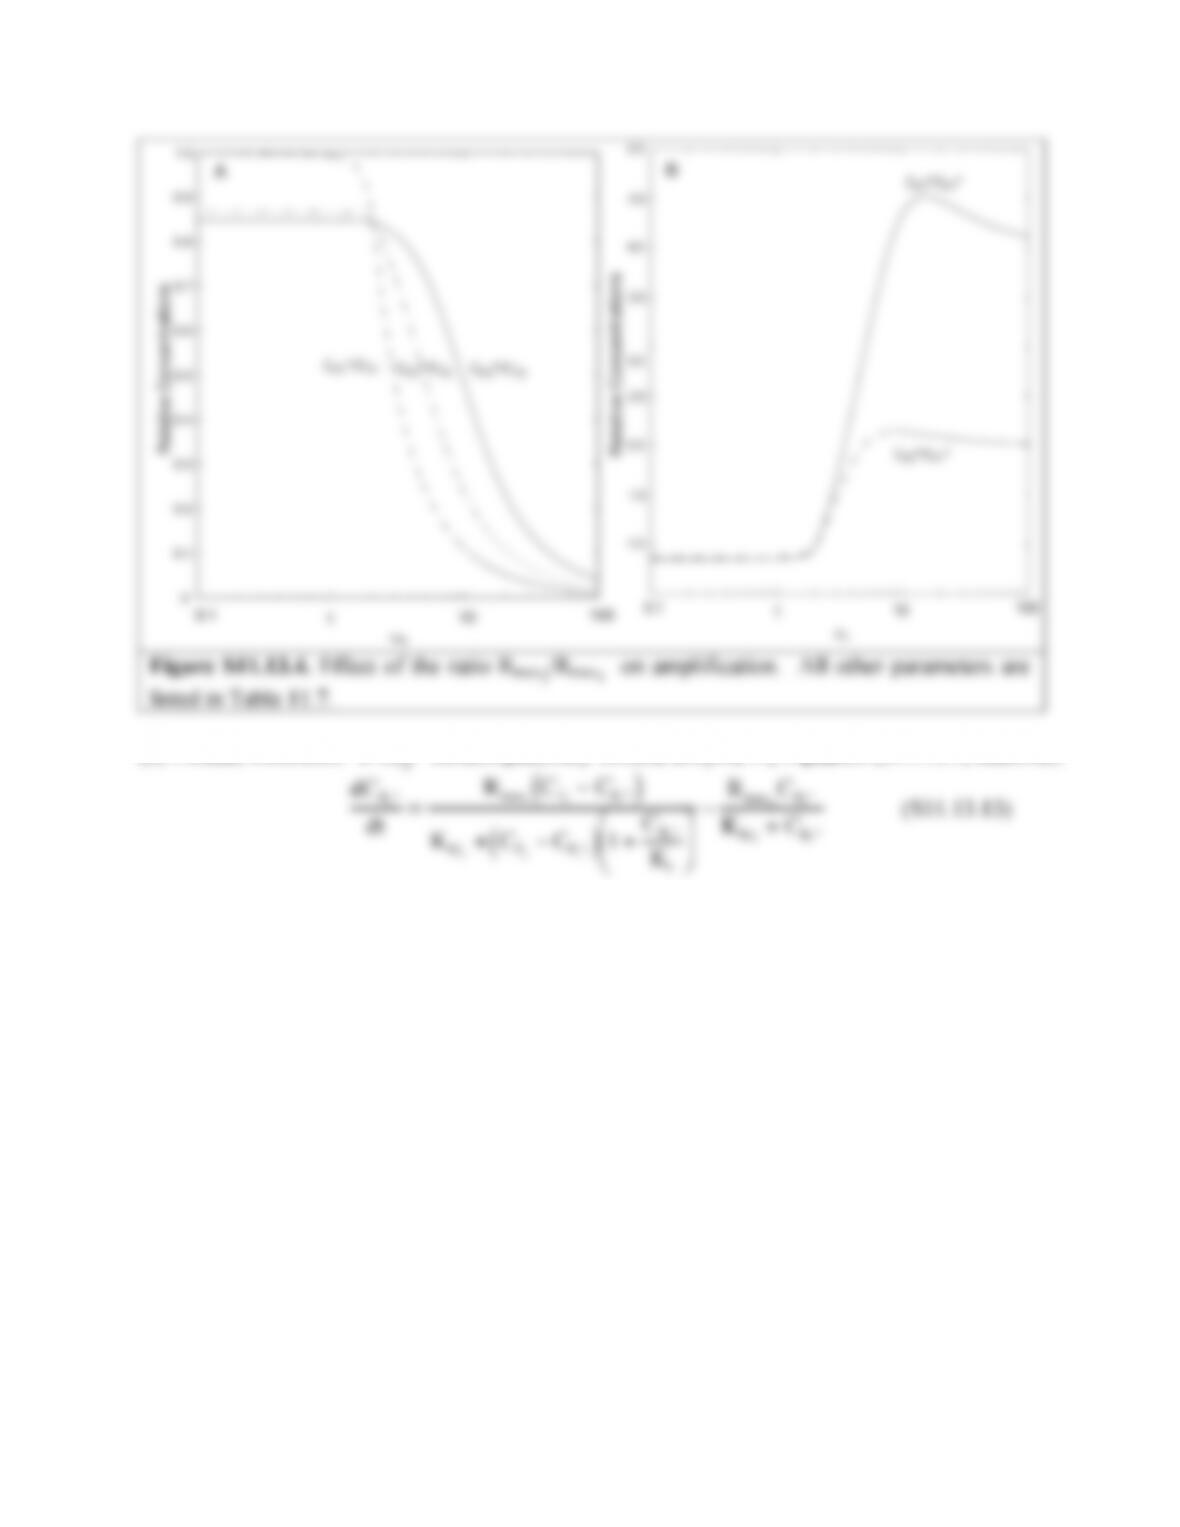
Figure S11.13.3. Effect of KM1 upon P1*, P2* and P3*. All other parameters are listed in
Table 11.7.
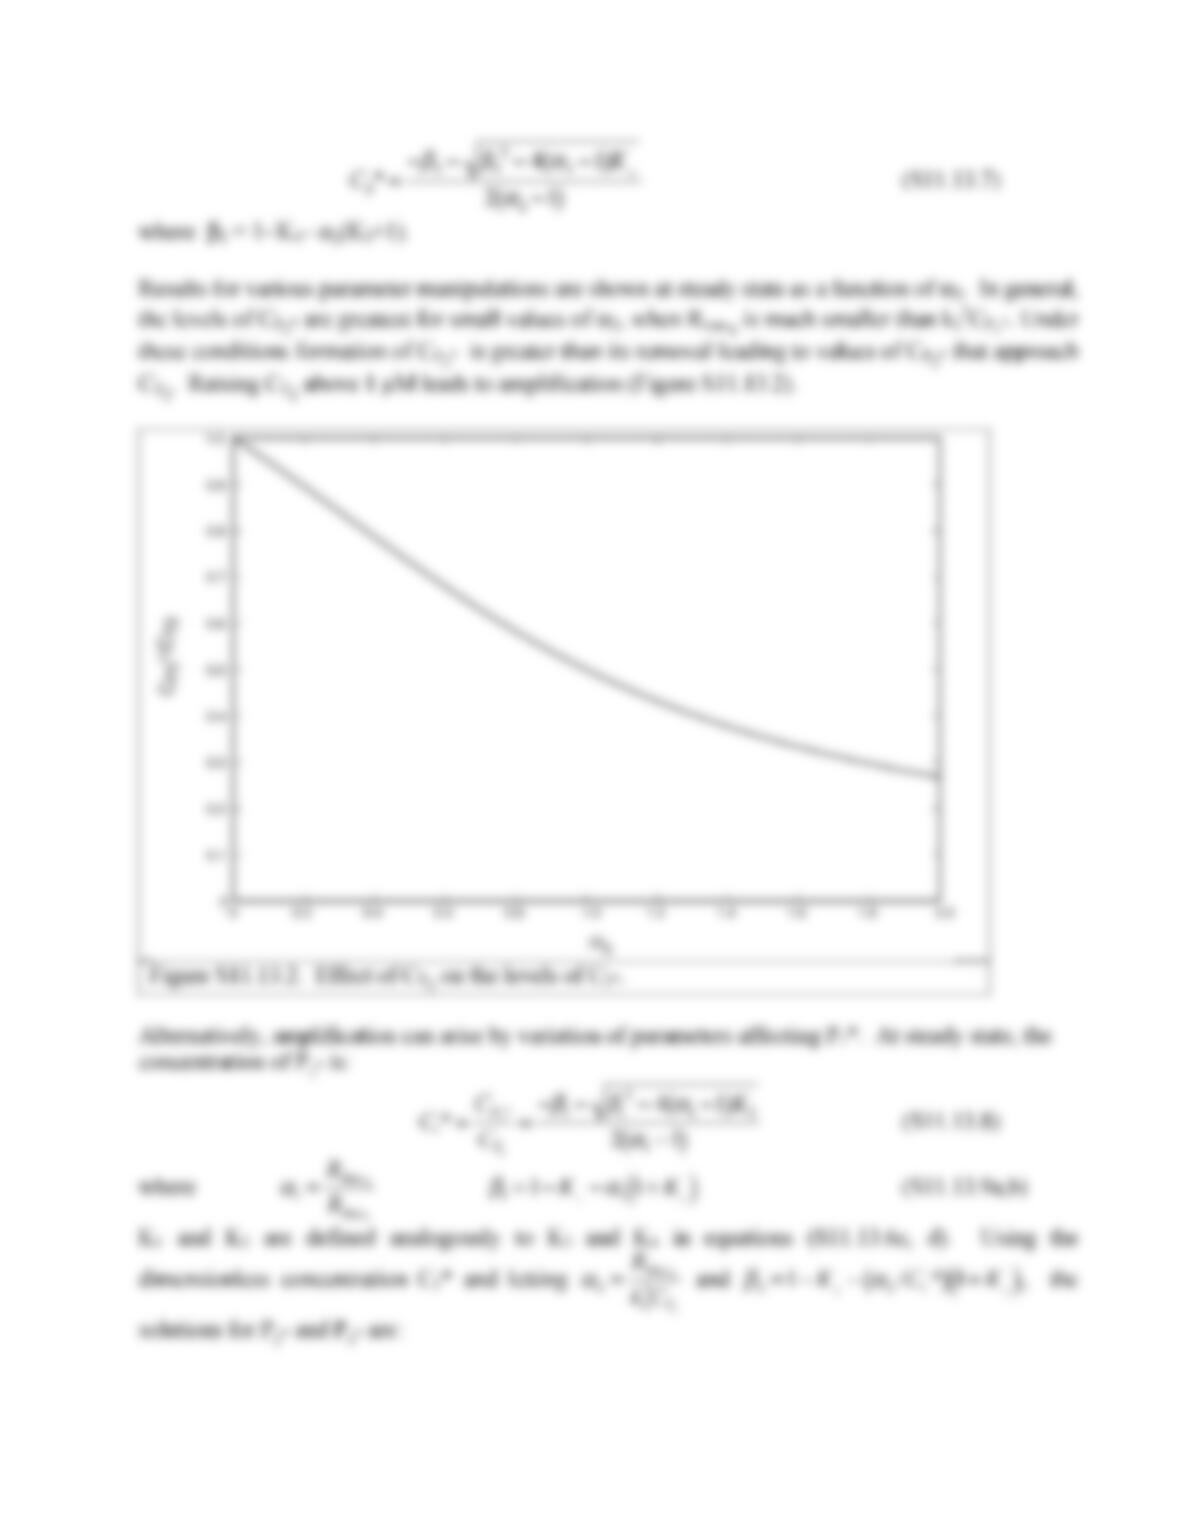
Amplification arises when the ratio KM1/KM2 rises above 0.5 (Figure S11.13.3). As this ratio rises,
dephosphorylation is favored over phosphorylation and the concentration of P1* declines. The
concentrations of P2* and P3* also decline, but more slowly. As a result, the ratio of these
concentrations relative to P1* increases above 1. Amplification for P2* is greater than amplification
for P3*.
Amplification also arises for different values of α1 = Rmax2/R max1 (Figure S11.13.4). P1*, P2* and
P3* decline with increasing values of the ratio Rmax2/R max1 due to increasing phosphorylation but P2*
and P3* decline more slowly with increasing Rmax2/Rmax1. Note that the level of amplifcation is
similar to that observed with large values of KM1. BASed on these results, we can conclude that the
level of amplification is greater when the phosphorylation reaction is favored.
158
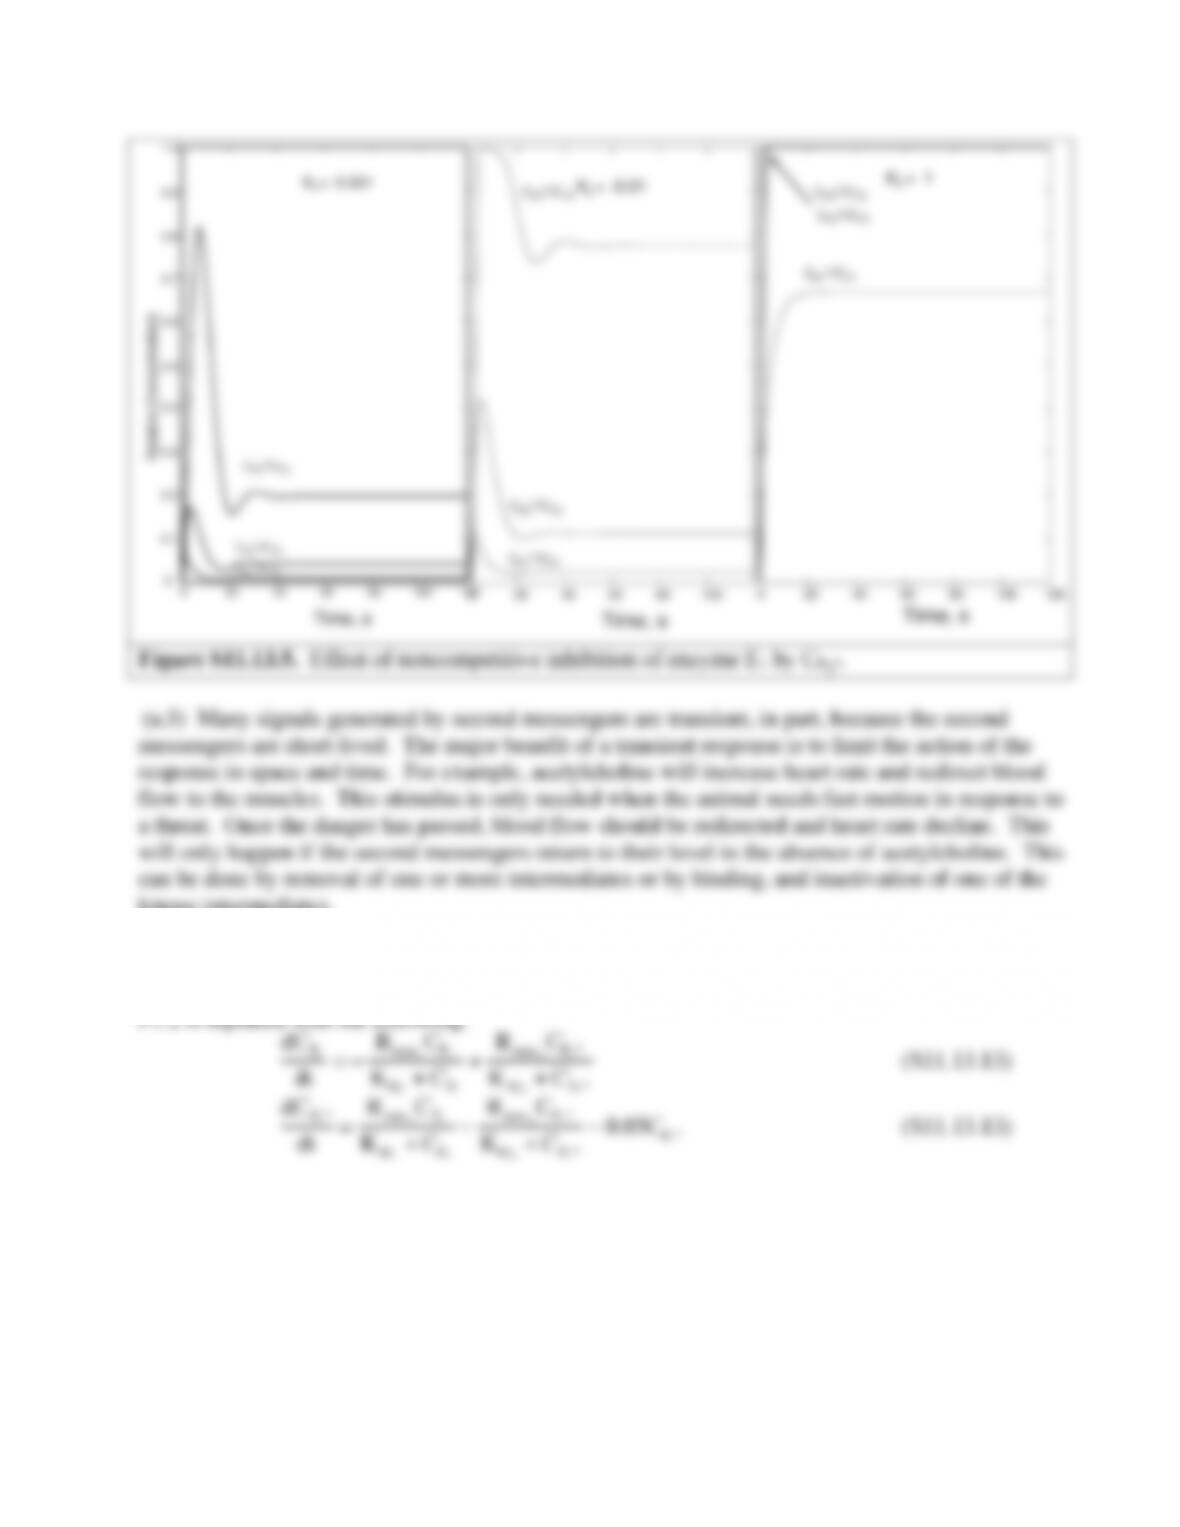
(b) Product Inhibition. If CP3* noncompetitively inhibits enzyme E1, Equation (S11.13.1) becomes:
dCP
1*
dt =
Rmax1
CT1−CP
1*
( )
( )
CP
KI
⎛
⎝
⎜
⎞
⎠
⎟
−Rmax 2
CP
1*
KM2+CP
(S11.13.13)
Noncompetitive inhibition produces two significant changes to the results (compare Figures S11.13.5
and S11.13.1), First the concentrations peak between 1 and 10 seconds and decline to a new steady
state level below the levels obtained in the absence of inhibition. At early times, little P3* is
produced and inhibition is negligible. As more P3* appears, the further production of P1* is reduced.
The peak level of P1* is above the steady state value of P1*, so the enzyme concentration decreases.
Declines in P1* affect P2* and P3*.
The second effect of noncompetitive inhibition is that the steady state levels of P2* and P3* exceed
the value of P1* for CT1 equal to 1 µM. This effect arises because inhibition reduces Rmax1, causing
less P1* to be produced.
159
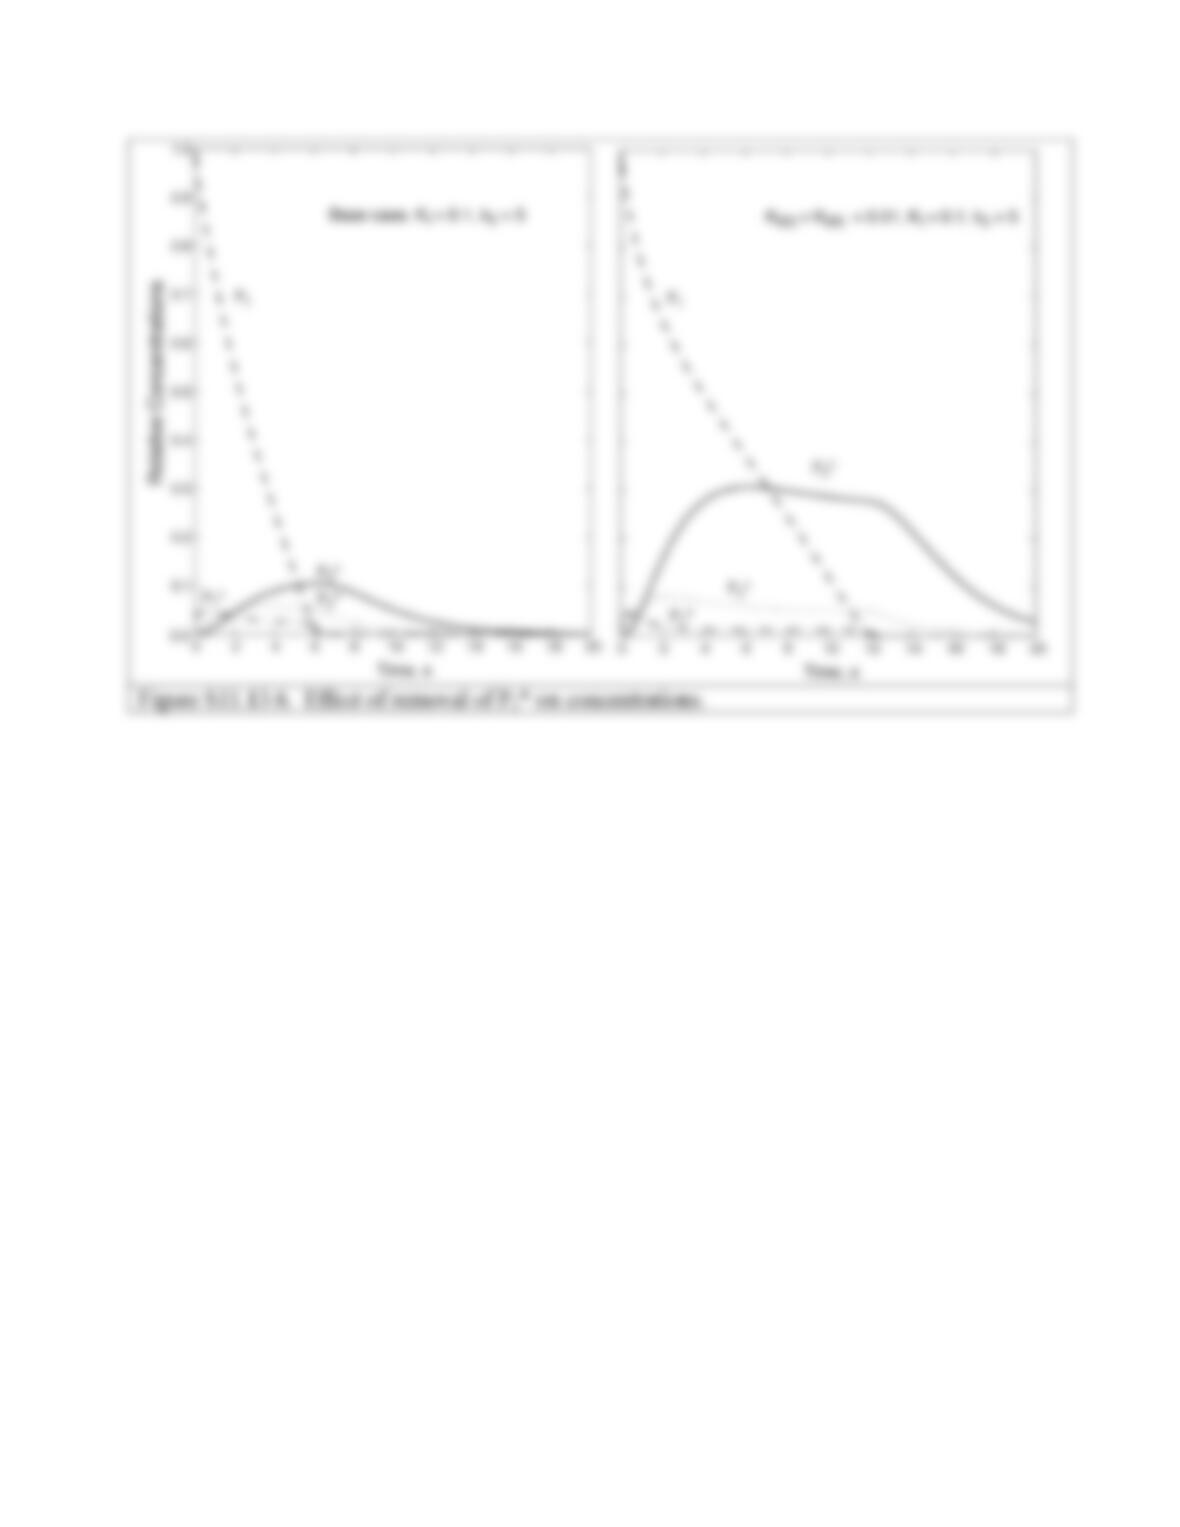
(b) To simulate attenuation, removal of P1* was assumed to be first order with a rate constant of
0.05 s–1. Because P1* is removed, the relation CTi = CPi + CPi* no longer applies. Thus, equation
P1.2 is replaced with the following:
For the base case of parameters, P1 declines to zero over a 20 s period as P1* reacts. Curves
for P2* and P3* resemble those for P1* although there is amplification of the signal (Figure
S11.13.6). The dynamics of P1* removal can be affected by reducing the value for the maximum
rate of dephosphorylation, Rmax2 and decreasing KM3 and K M
5 to 0.01 µM. Although P1 declines
faster, higher levels of P2* and P3* result and these molecules last longer than P1* which catalyzes
their formation.
160