131
10.5. (a) The rate of formation of ECS complex is:
132
CEC ≈
CECCo
KC
(S10.5.4)
Using Equation (S10.5.4) to replace CE in the expression for total enzyme concentration yields;
CEo
=CE+CEC +CECS =CEC 1+KC
CCo
⎛
⎝
⎜
⎜
⎞
⎠
⎟
⎟ +CECS
(S10.5.5)
Substituting Equation (S10.5.6) into Equation (S10.5.1) yields:
Applying the quasi-steady state assumption to Equation (S10.5.7b) and solving for CECS
The cofactor affects KM by increasing the apparent affinity. Increasing the cofactor concentration
causes the apparent KM to decline.
10.6. The definition of the effectiveness factor is, from Equation (10.6.9c), for a first order
reaction in which the reactant is consumed
133
10.7. Since the lethal dose is much smaller than KM, it is likely that toxin levels in the blood are less
than the lethal dose, otherwise the individual would be dead. Thus, the reaction can be assumed to
10.8. The effectiveness facotr for rectangular geometry can be used, with L = (Λ-R)/2. The Thiele
10.9. From equation (10.6.53), the observable modulus is:
Thus, the reaction is diffusion-limited.
134
10.11. For a surface reaction, the first-order reaction coefficient has units of cm s-1. The rate
coefficient is:
10.12. The rate coefficient is from problem 10.11. For the data given, Sc = 6000, and Pe = 4.5 x 10⁶.
The mass transfer coefficient is
10.13. (a) Begin by using the definition of s and factoring k1 on the right hand side of Equation
(10.4.5):
From the definition of KM = (k-1+k2)/k1 we have for k1,
Substituting for k-1/k1 and
Eliminating CS0.
Using the definition of τ,

135
136
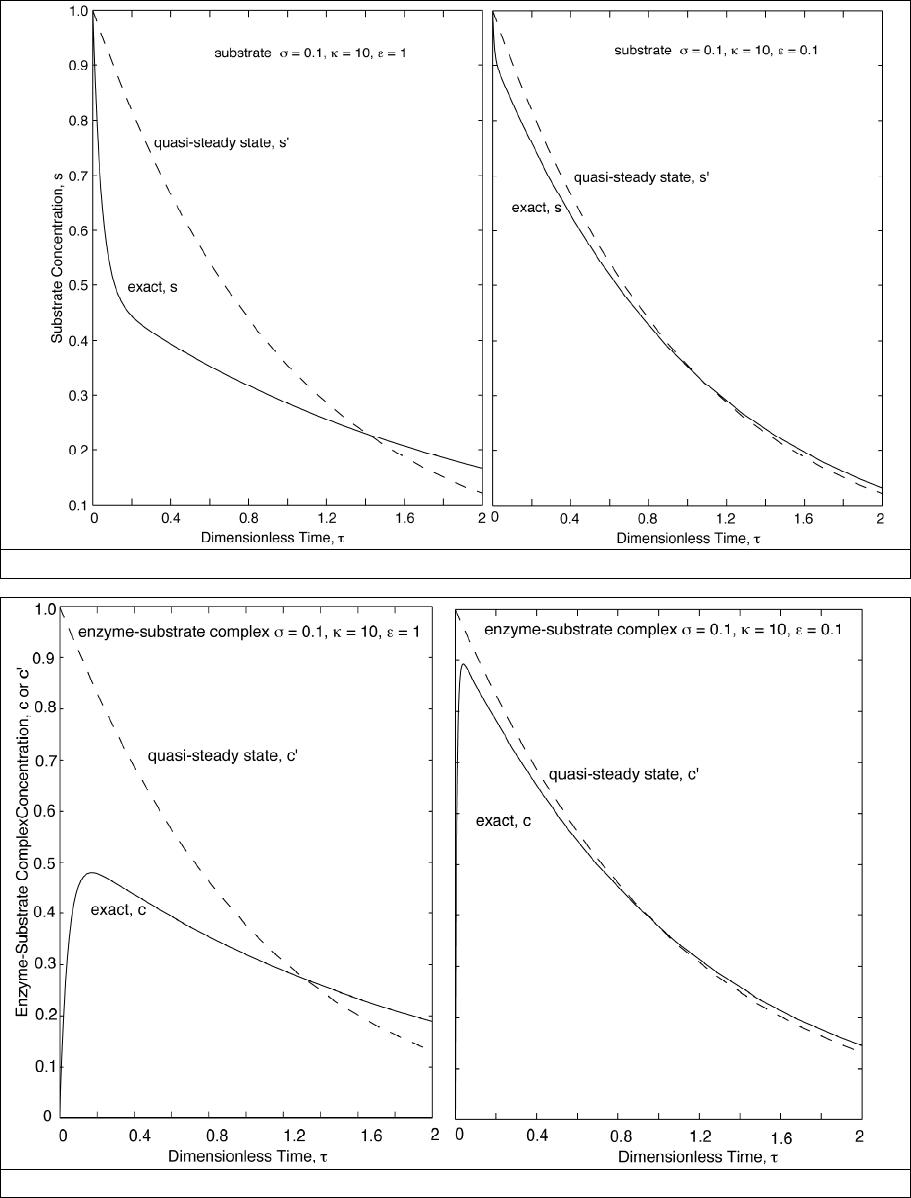
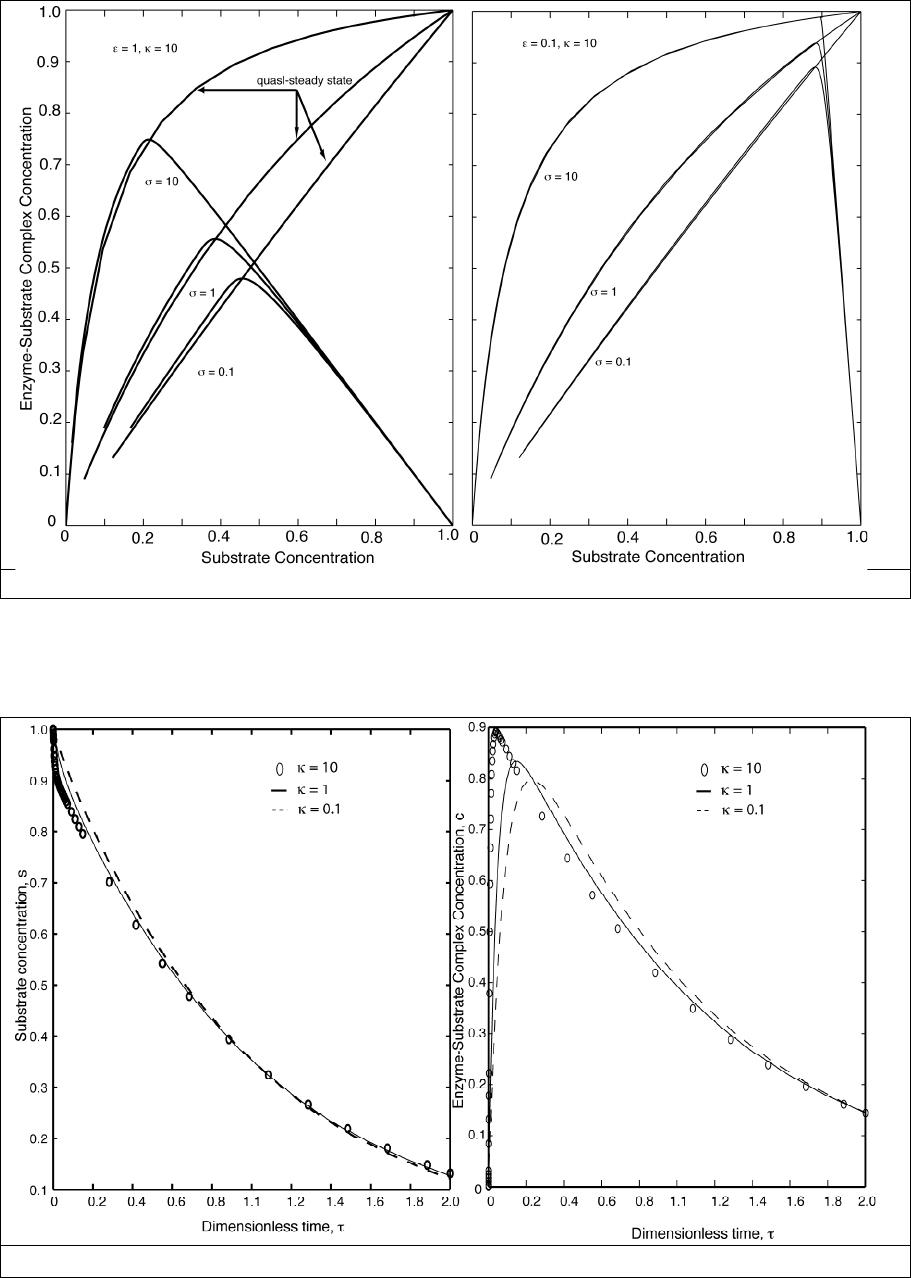
(b) Figures S10.13.1 and S10.13.2 provide comparisons between the exact and the quasi-steady
solutions for σ = 0.1, κ =10 and ε = 0.1 or ε = 1 for the substrate (Figure S10.13.1) and enzyme-
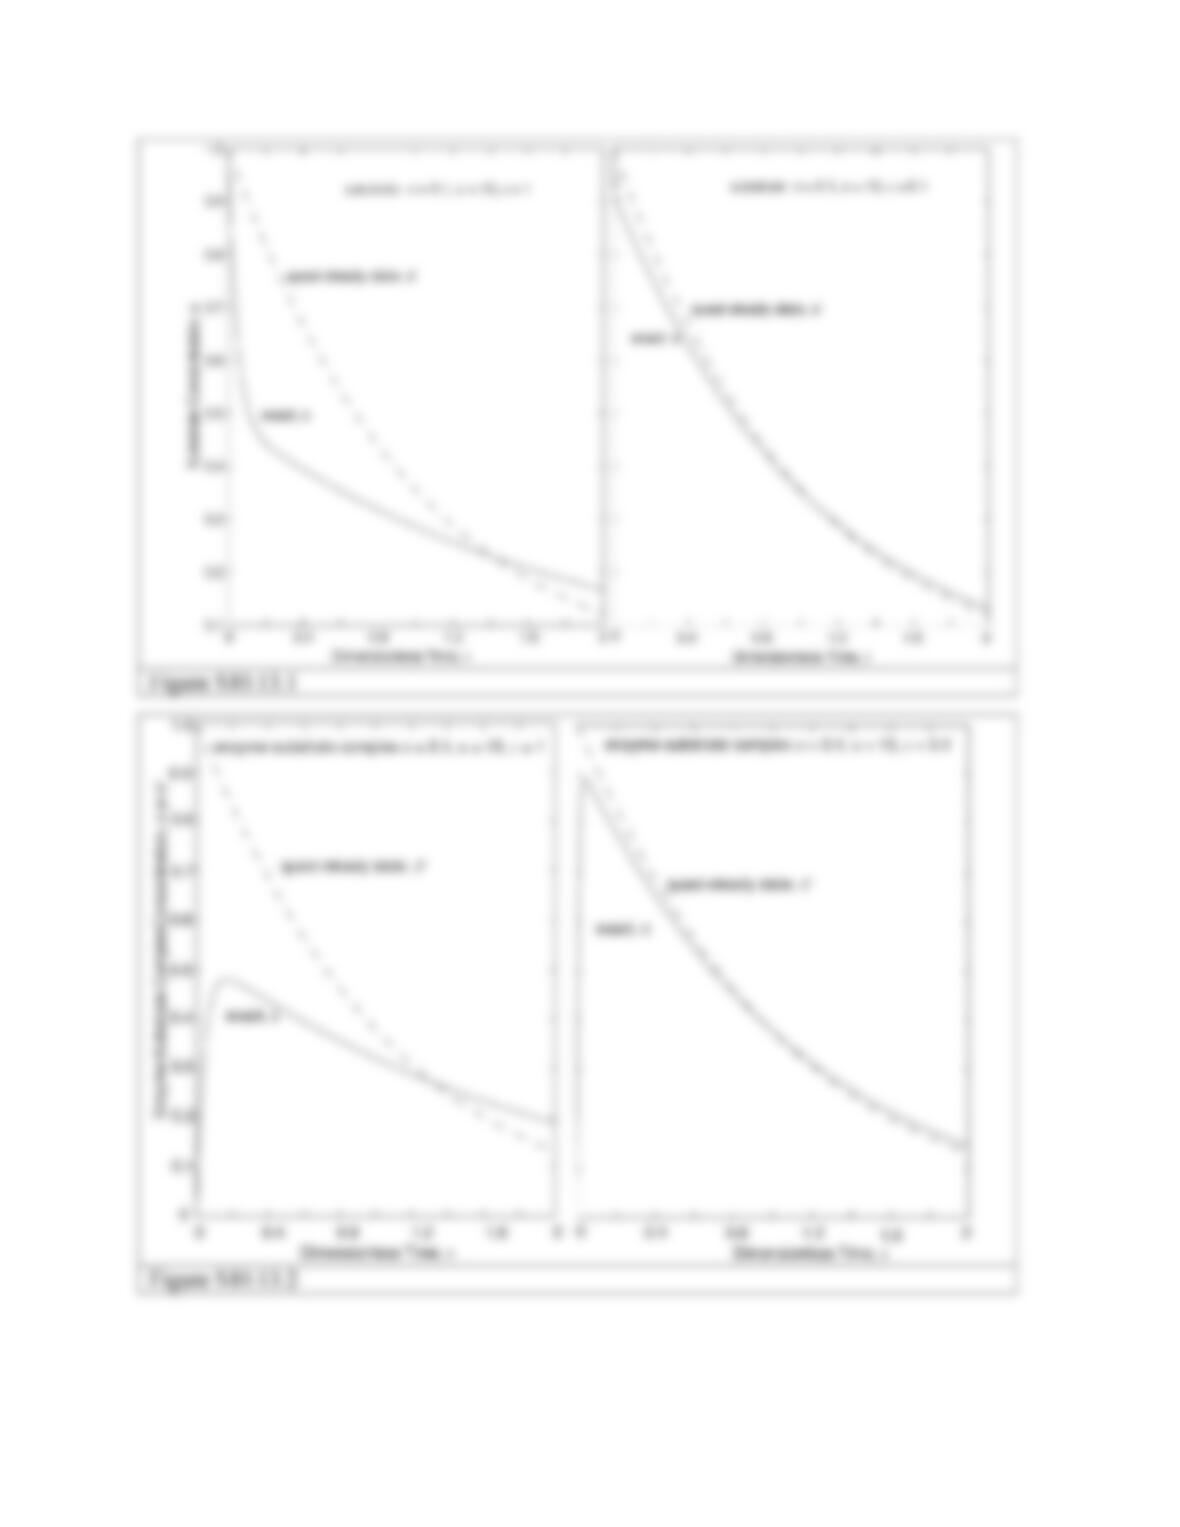
137
138
139
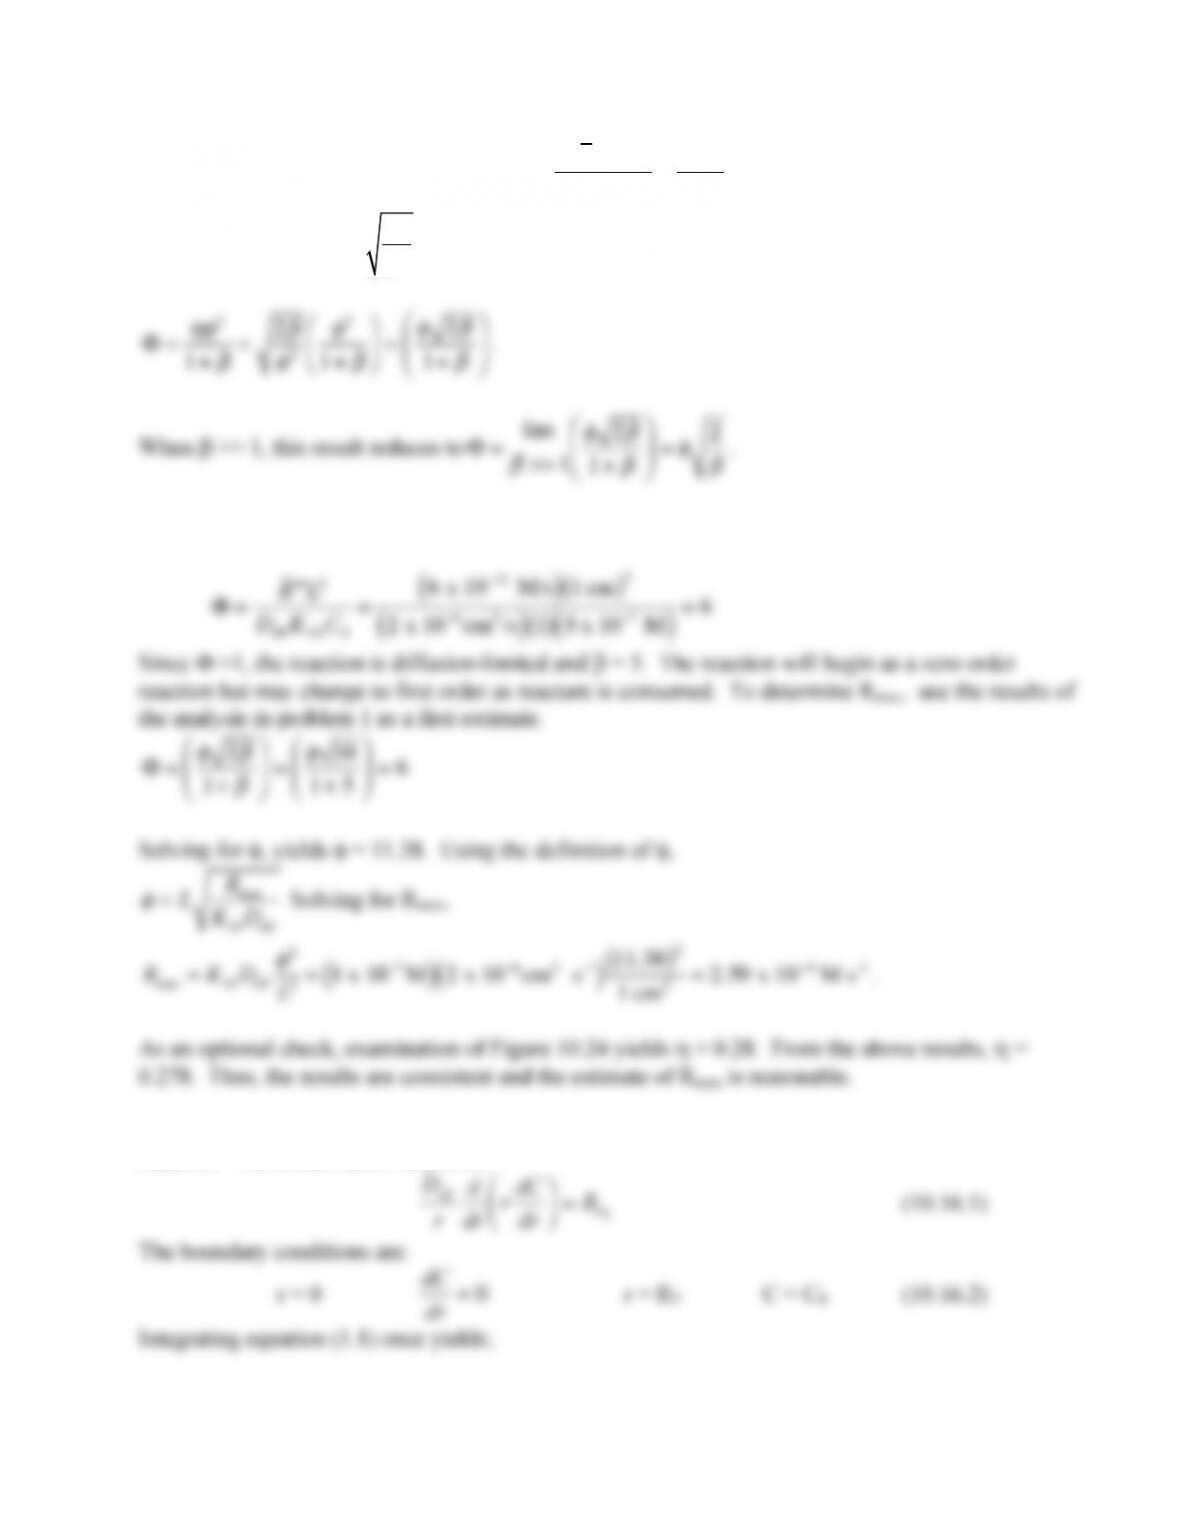
10.14. Starting with Equation (10.6.43)
Φ=′′′
R L2
Deff KAVC0
=
ηφ
2
1+
β
and the effectiveness factor for a
zero order reaction,
η
=2
β
φ
2,
the observable modulus is:
10.15. First, calculate the observable modulus for the enzyme reaction
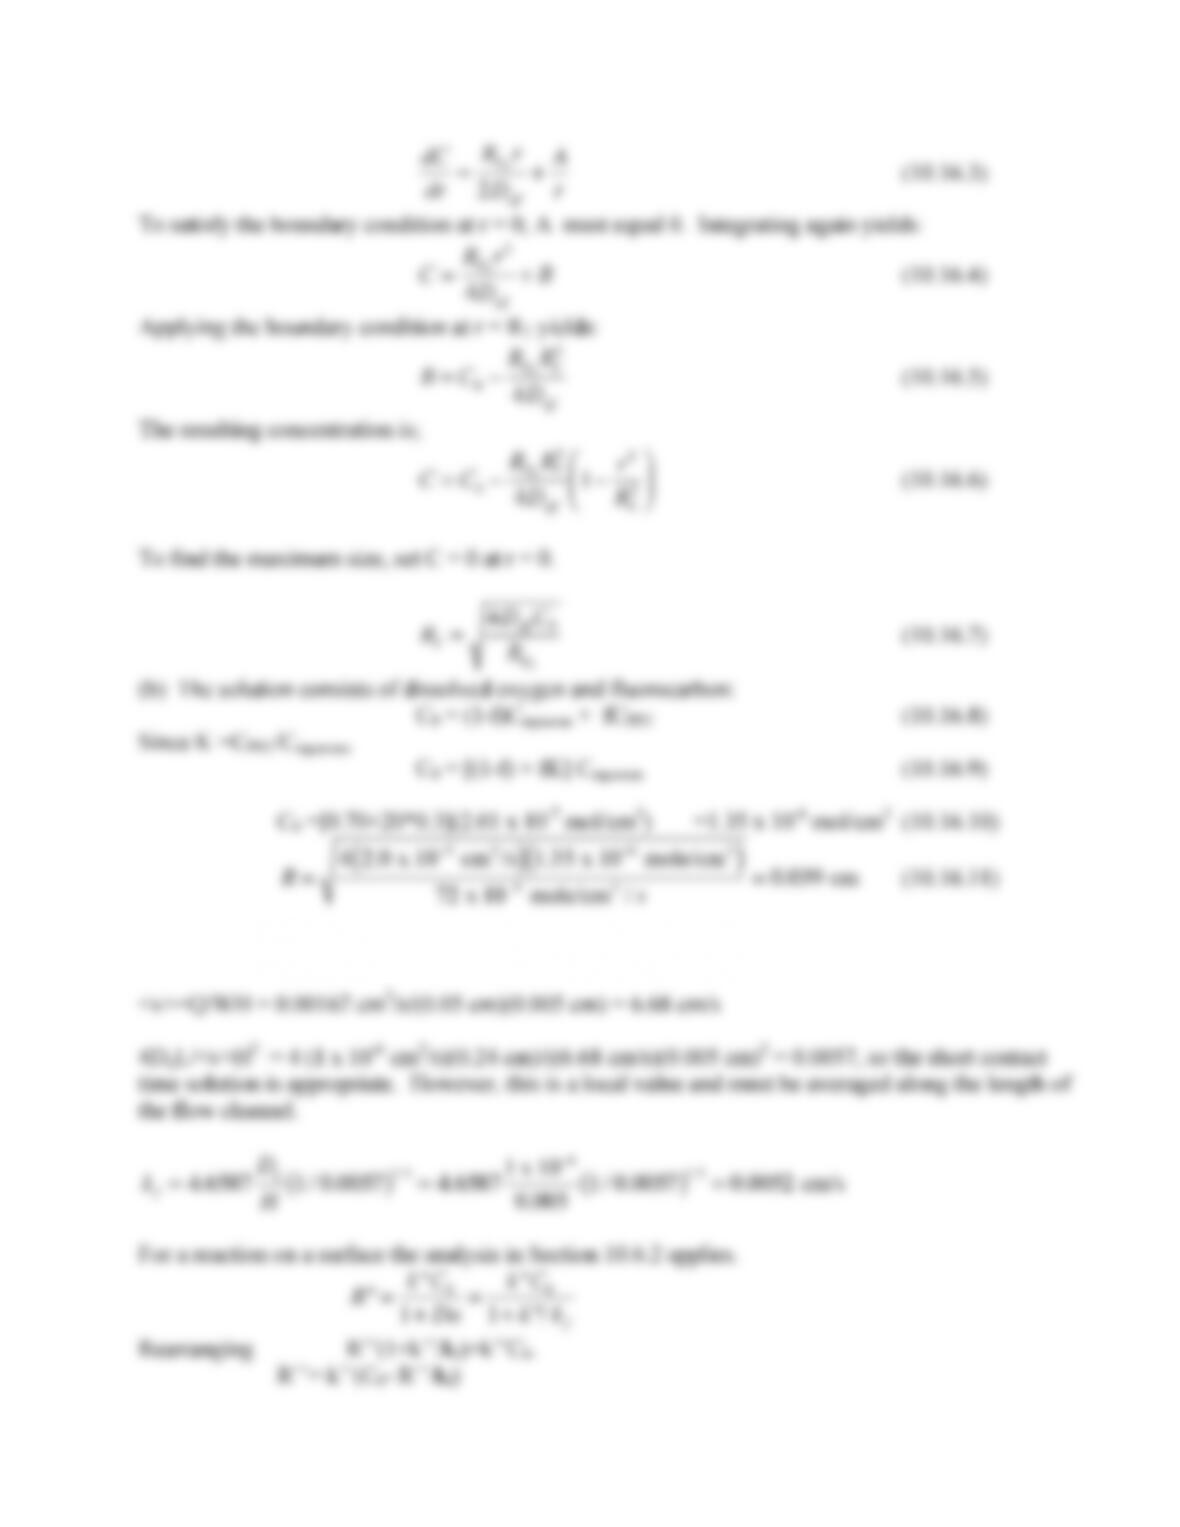
10.16. (a) In this problem, there is radial diffusion in cylindrical coordinates and zero order
reaction. The conservation relation is:
140
10.17. First determine the value of 4DijL/<v>H2 to determine which correlation to use.

141
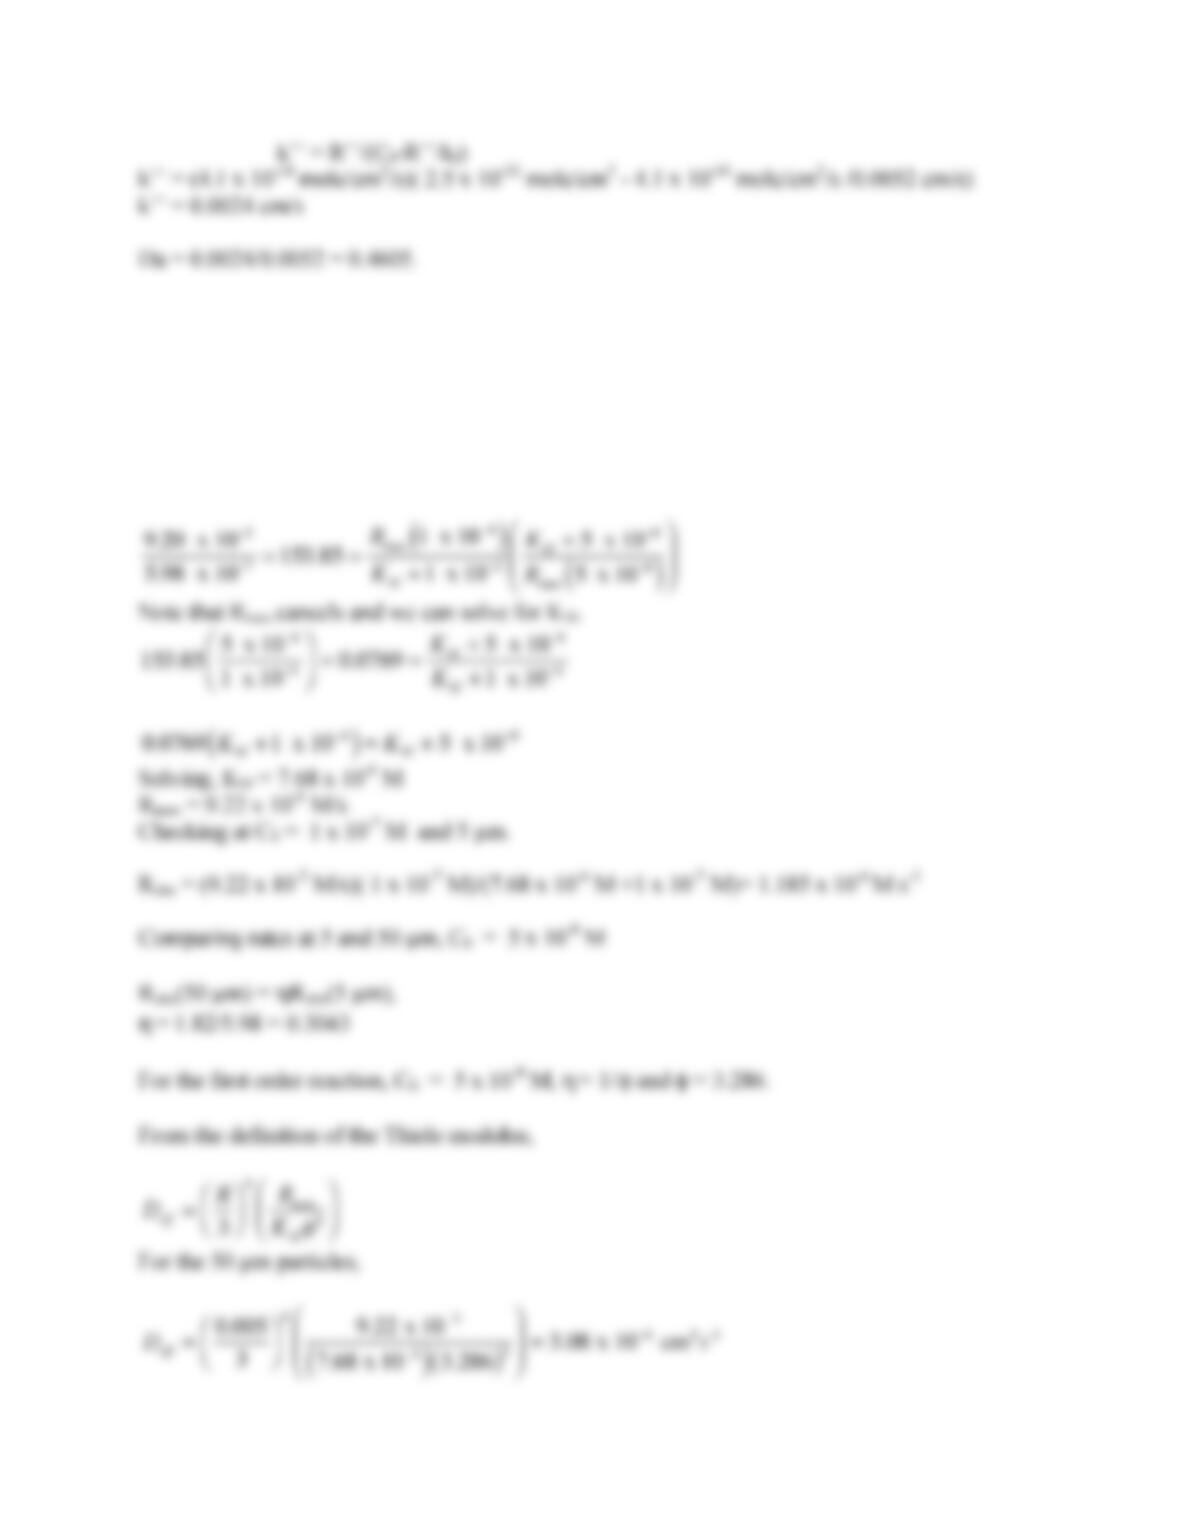
10.18. Note that the rates for C0 = 5 x 10⁻⁸ M are ½ the rates for C0 = 1 x 10⁻⁷ M . This
concentration is in the first order region. Further, the rates for 5 µm particles are just slightly greater
than those for 10 µm particles suggesting that η ≈ 1 for 5 µm particles. Finally, C0 = 1 x 10⁻⁴ M is
probably close to zero order since the rate is not too sensitive to size and rates are much larger than
those for the lower concentrations.
Thus for the 5 µm particles, taking the ratio of rates at C0 = 1 x 10⁻⁴ M and C0 = 5 x 10⁻⁸ M yields.
142
143
Solution to Problems in Chapter 11, Section 11.10
11.1. Beginning with Equation (11.3.3)
Divide each side of Equation (S11.1.1) by KD
11.2. The total number of type 1 receptors on the cell surface is:
Solving the steady state form of Equation (11.4.13c) for NC1 yields:
Inserting this result into the steady state form of Equation (11.4.13a) and using the definition of
Collecting terms multiplied by N*C1
Solving for N*C1
Simplifying:

144
N*
C1=−
NRT
1
C
Lo
*KD
1+CLo
( )
−NRT
1
CLo
C
Lo
*
CLo
C
Lo
*−KD
1+C
Lo
*
( )
KD
1+CLo
( )
=
NRT
1
C
Lo
*KD
1
KD
1KD
1+C
Lo
*+CLo
( )
=
NRT
1
C
Lo
*
KD
1+C
Lo
*+CLo
(S11.2.6)
For a competitive inhibitor with inhibitor constant KI we have from equation (10.5.6).
N*
C1=
NRT
1
C
Lo
*
KD
11+
CLo
KI
⎛
⎝
⎜
⎞
⎠
⎟ +C
Lo
*
(S11.2.7)
If
KI=KD
1
then Equation (S11.2.7) reduces to equation (S11.2.6). A labeled ligand is expected to
bind to the receptor with the same affinity as the unlabeled form.
A similar analysis can be performed for the second class of receptors.
11.3. Assume that all reactions shown in Figure 11.14 are at steady state. First consider the
interconversion between C1 and C2 as show in Figure 11.14. At steady state:
Substituting Equation (S11.3.8) into Equation (S11.3.6) and replacing with NC2 in Equation (S11.3.3)
yields
145
11.4. (a) Assuming that loss of EGF from the surface is first order, dissociation from the receptor is
negligible and degradation is not important on the time scale of the problem. Thus, for a first order
The data at 15 and 25 minutes both yield k2 = 0.10 min-1.
(b) If the transfer from the cytoplasm can be assumed to be much slower than the release of the
polyplex from the endosome, then the process can be treated as a sequential reaction with two steps,
internalization with rate constant ki (equal to λξ) and transfer to the cytoplasm with rate coefficient
ktr.
surface ki
⎯ → ⎯ endosome krec
⎯ → ⎯ cytoplasm
(S11.4.2)
(c) From Section 10.3 which deals with sequential reaction A B C, the endosomal EGF-
polyplex (EGF-Pe) complex concentration corresponds to the intermediate and its concentration is
given from equation (10.3.6), after replacement of the appropriate rate coefficients:
From Equation (10.3.8) the time for the endosomal concentration to reach a maximum is:
Using tmax = 17.2 min and ki = 0.10 min-1 and solving iteratively yields ktr = 0.03 min–1.
(b) For a sequential reaction, the cytoplasmic concentration is given by equation (10.3.7)
Using Ncytoplasm/NEGF-R0 = 0.95 and values of ki and ktr determined above, t is found iteratively to be
111.76 min.
11.5. (a) A material balance on the intermediate G* is:
A steady state can arise if the level of CLR is maintained fixed by incubating the cells with a constant