SOLUTIONS TO CHAPTER 18 PROBLEMS
Activity Based Costing and Management
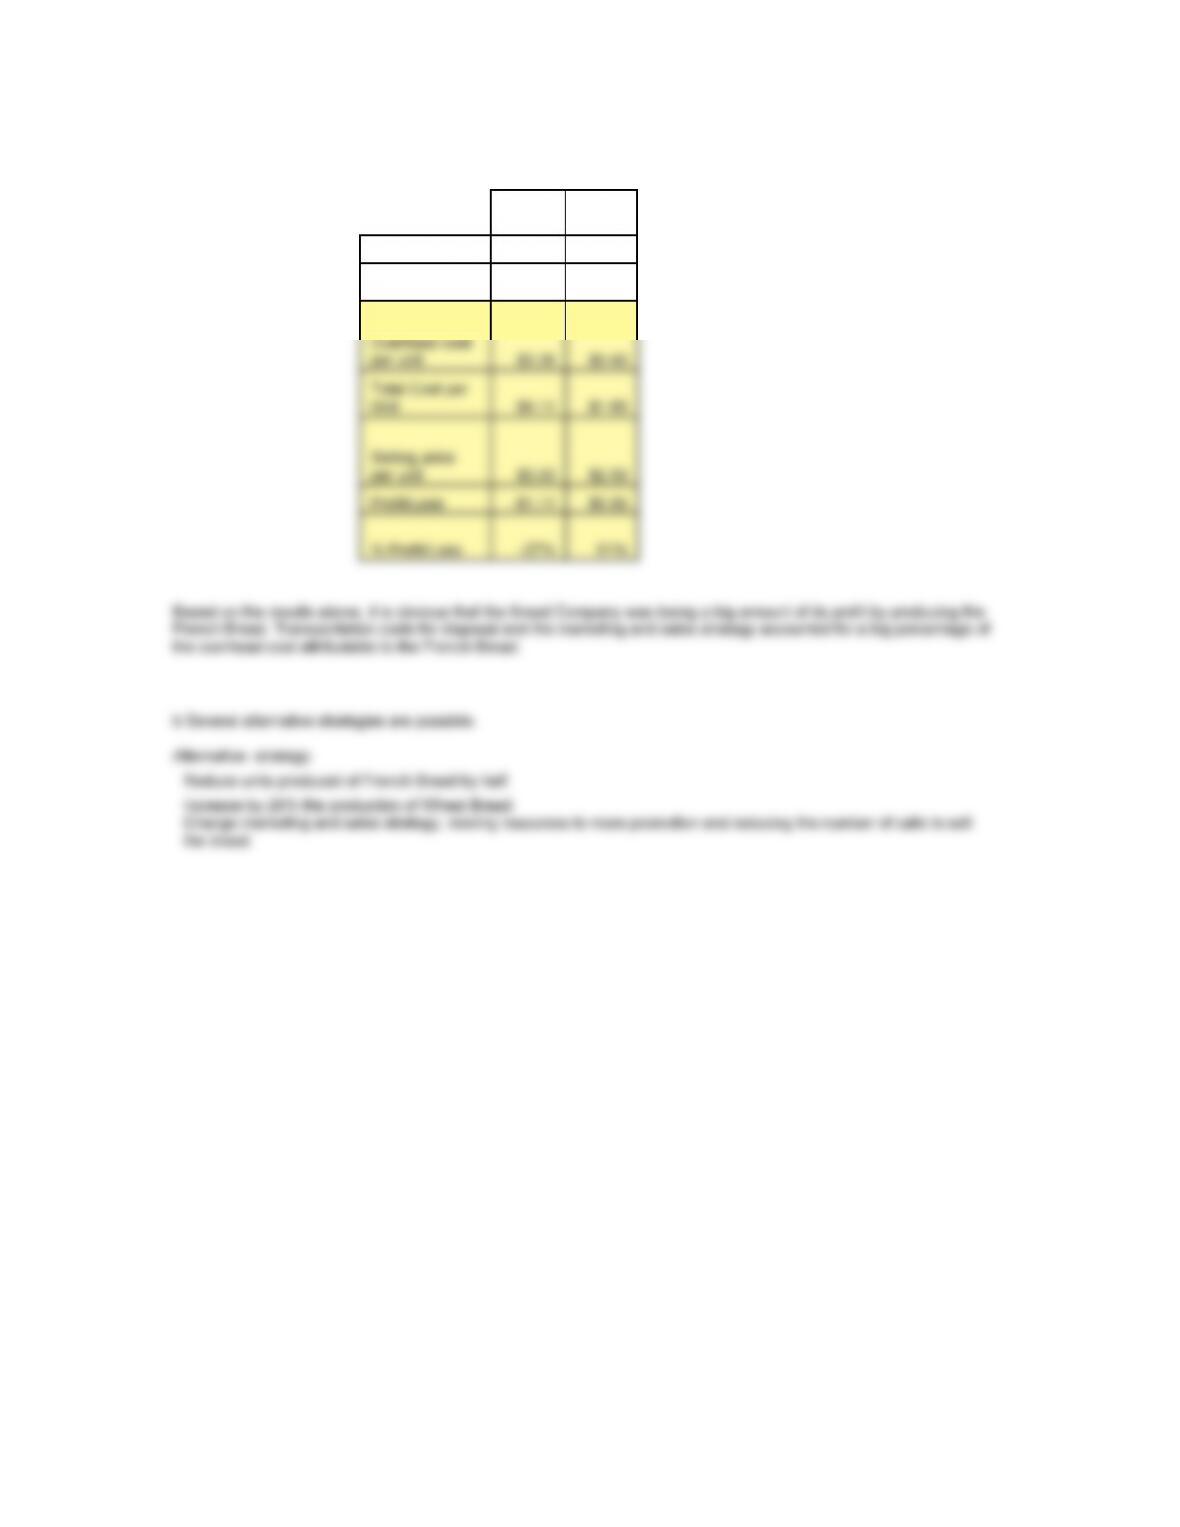
18-1. Successes and failures in ABC implementation have indicated that to succeed in this endeavor, firms need to
have a series of characteristics and commitments: Two of the most important are enjoying top management
commitment and involvement, and clear relevance of the ABC initiative for the whole organization. If the
18-2. There are many answers, mostly focused on change and people’s resistance to change
18-3. Firms and environments that characterize themselves as “we’re really not sure how much it costs us to
manufacture X are prime candidates for an activity- based cost system. It may be a bit arrogant to think that
18-4. In many ways ABC has already gone through the “fad” stage as tar as “the latest management program on the
block” is concerned, having been first introduced commercially over 10 years ago. Many of the “acronym
18-5. A list of potential monetary and other attributes might include items
such as:
• Investment costs in computers, etwork1ng, software, data collection devices
• Software development and integration costs
• Cost of training
• Documentation costs
214
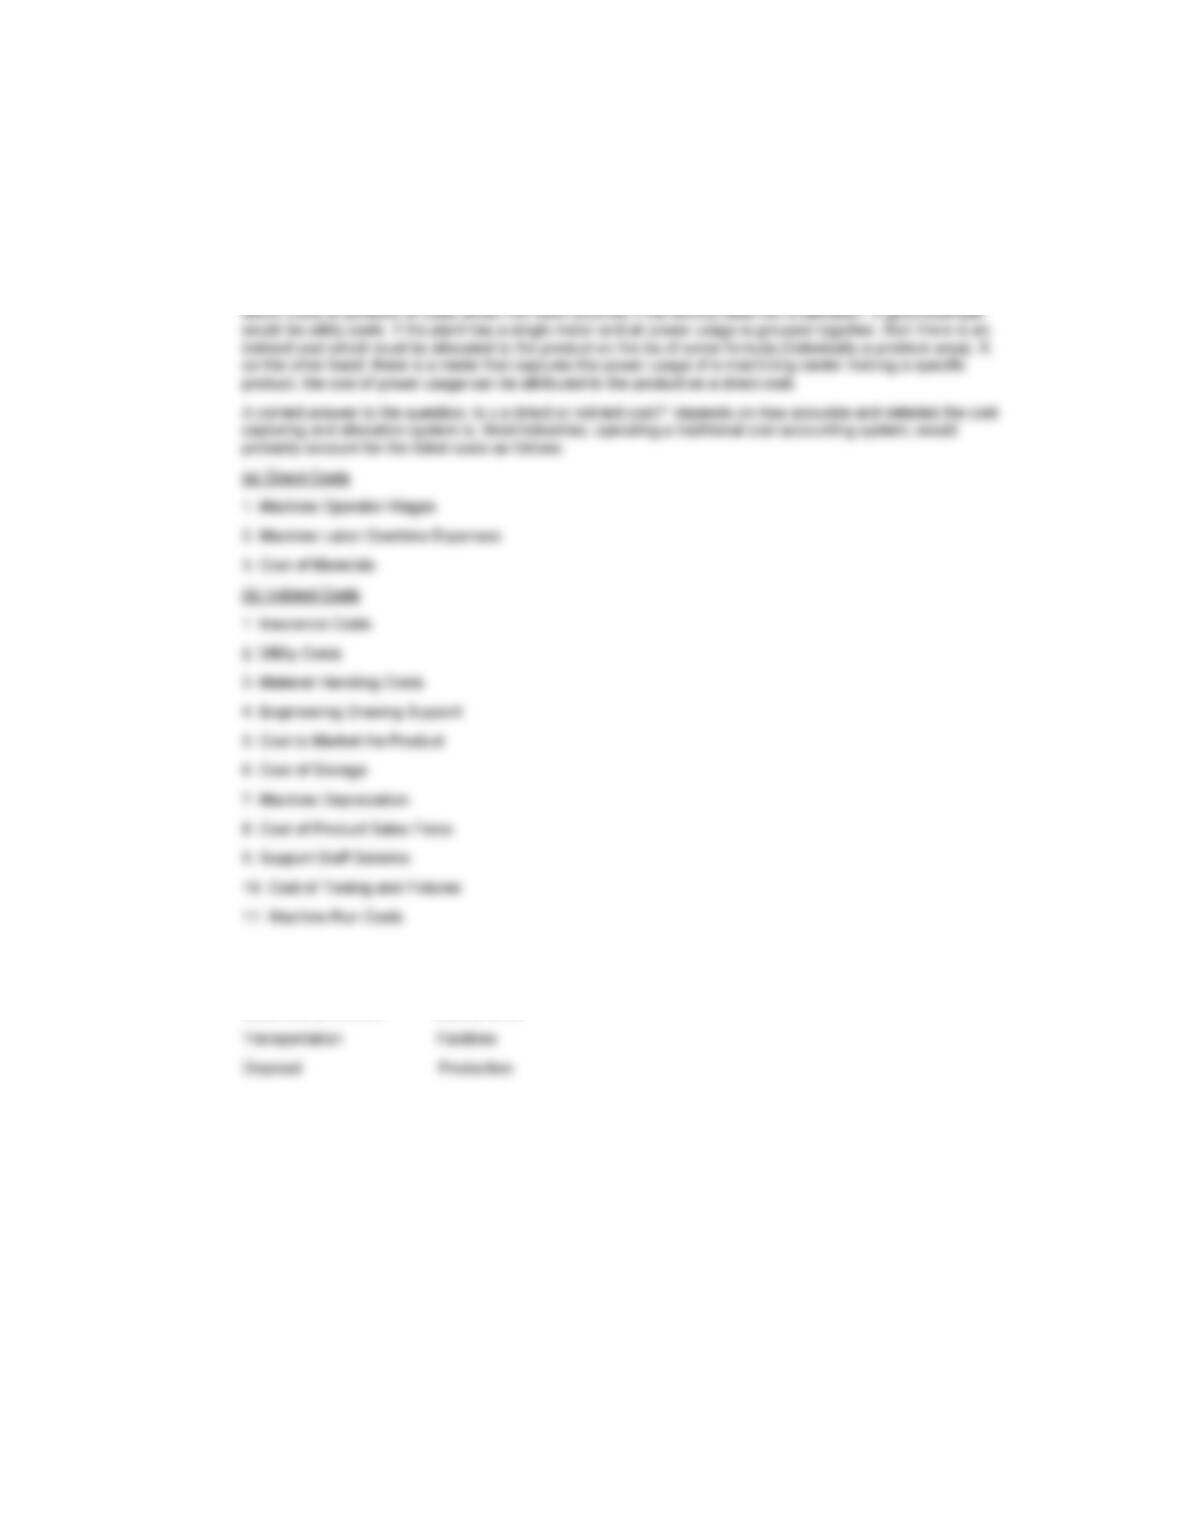
18-6. Direct costs are those that can be reasonably measured and allocated to a specific output or work activity.
Indirect costs are those that are difficult to attribute or allocate to a specific output or work activity. Indirect costs
are also commonly referred to as overhead.
The focus of ABC is to find a way to measure and capture all costs associated with a product or activity, as
direct costs. Based on this assumption and the definitions above, all costs are indirect costs until we find a way
to isolate those costs or portions of costs that are created as a direct result of the work activity undertaken.
Similarly, all costs have the potential to be captured as a direct cost, if we can determine a way to measure
18-7 Example cost pools are:
Sales and promotion Maintenance
215
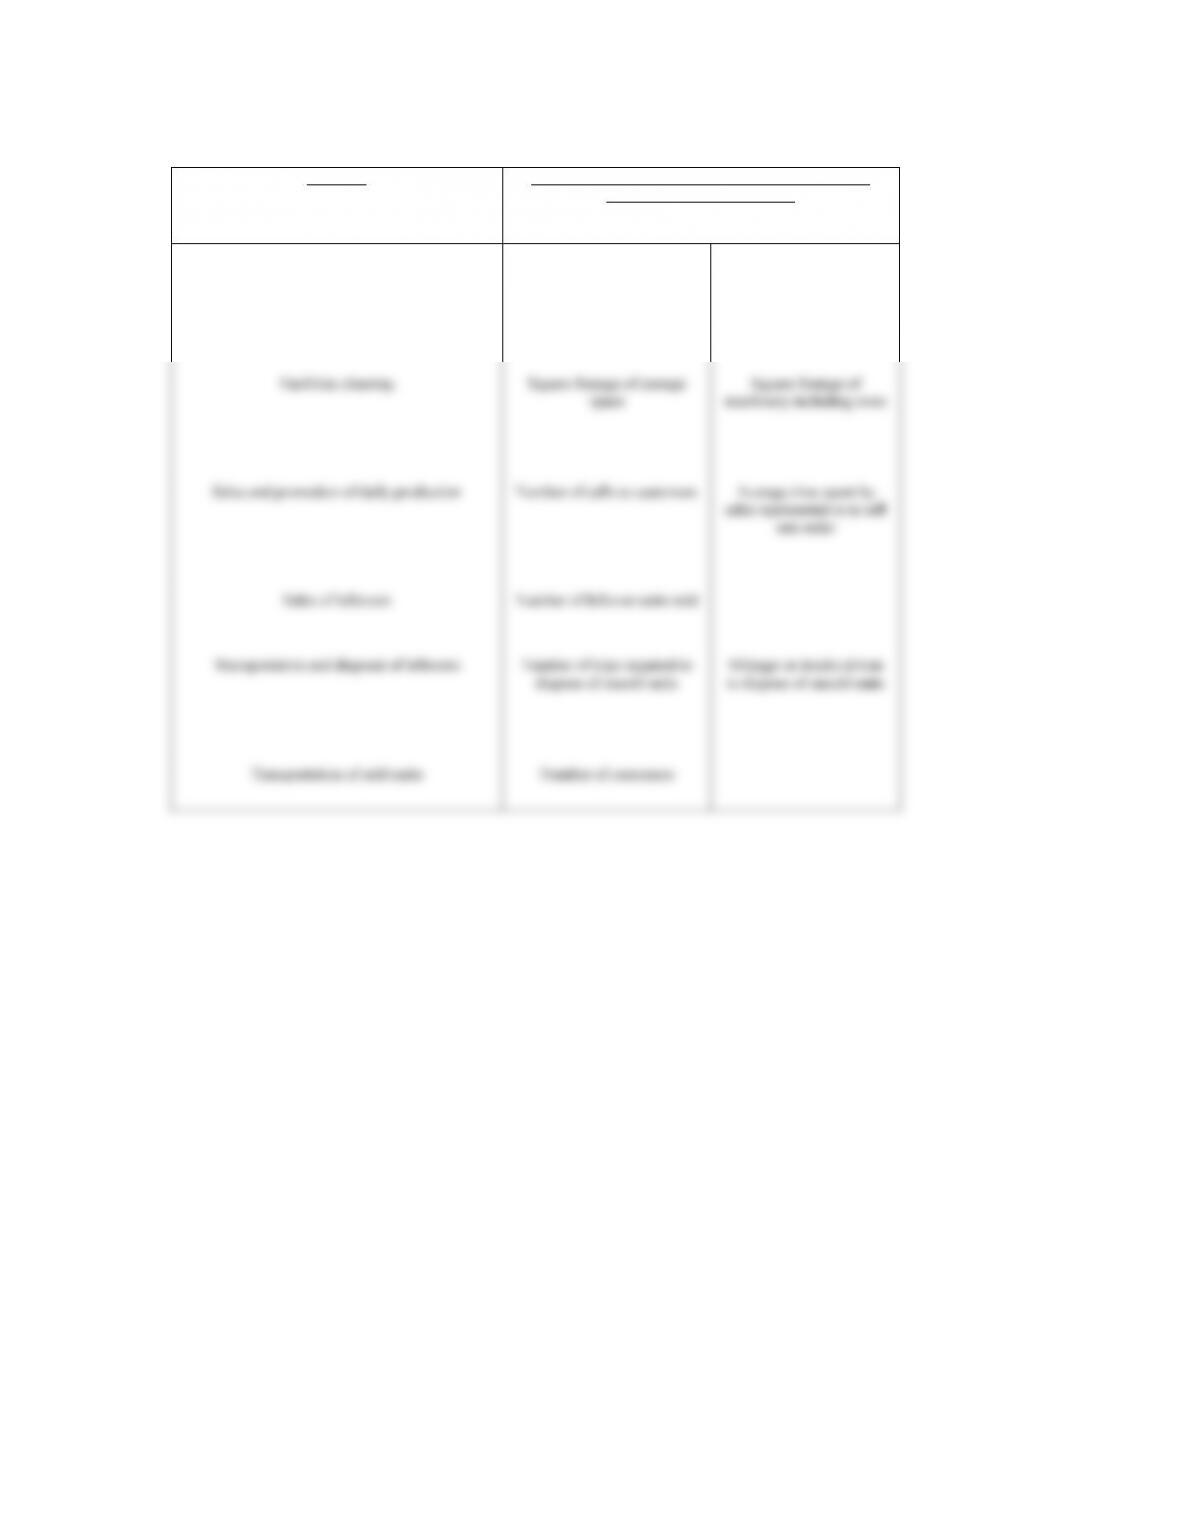
18-8
Activities Some Appropriate Cost Drivers (others could be found
depending of data availability)
Oven set up Number of production lots
Oven maintenance Number of units produced
216
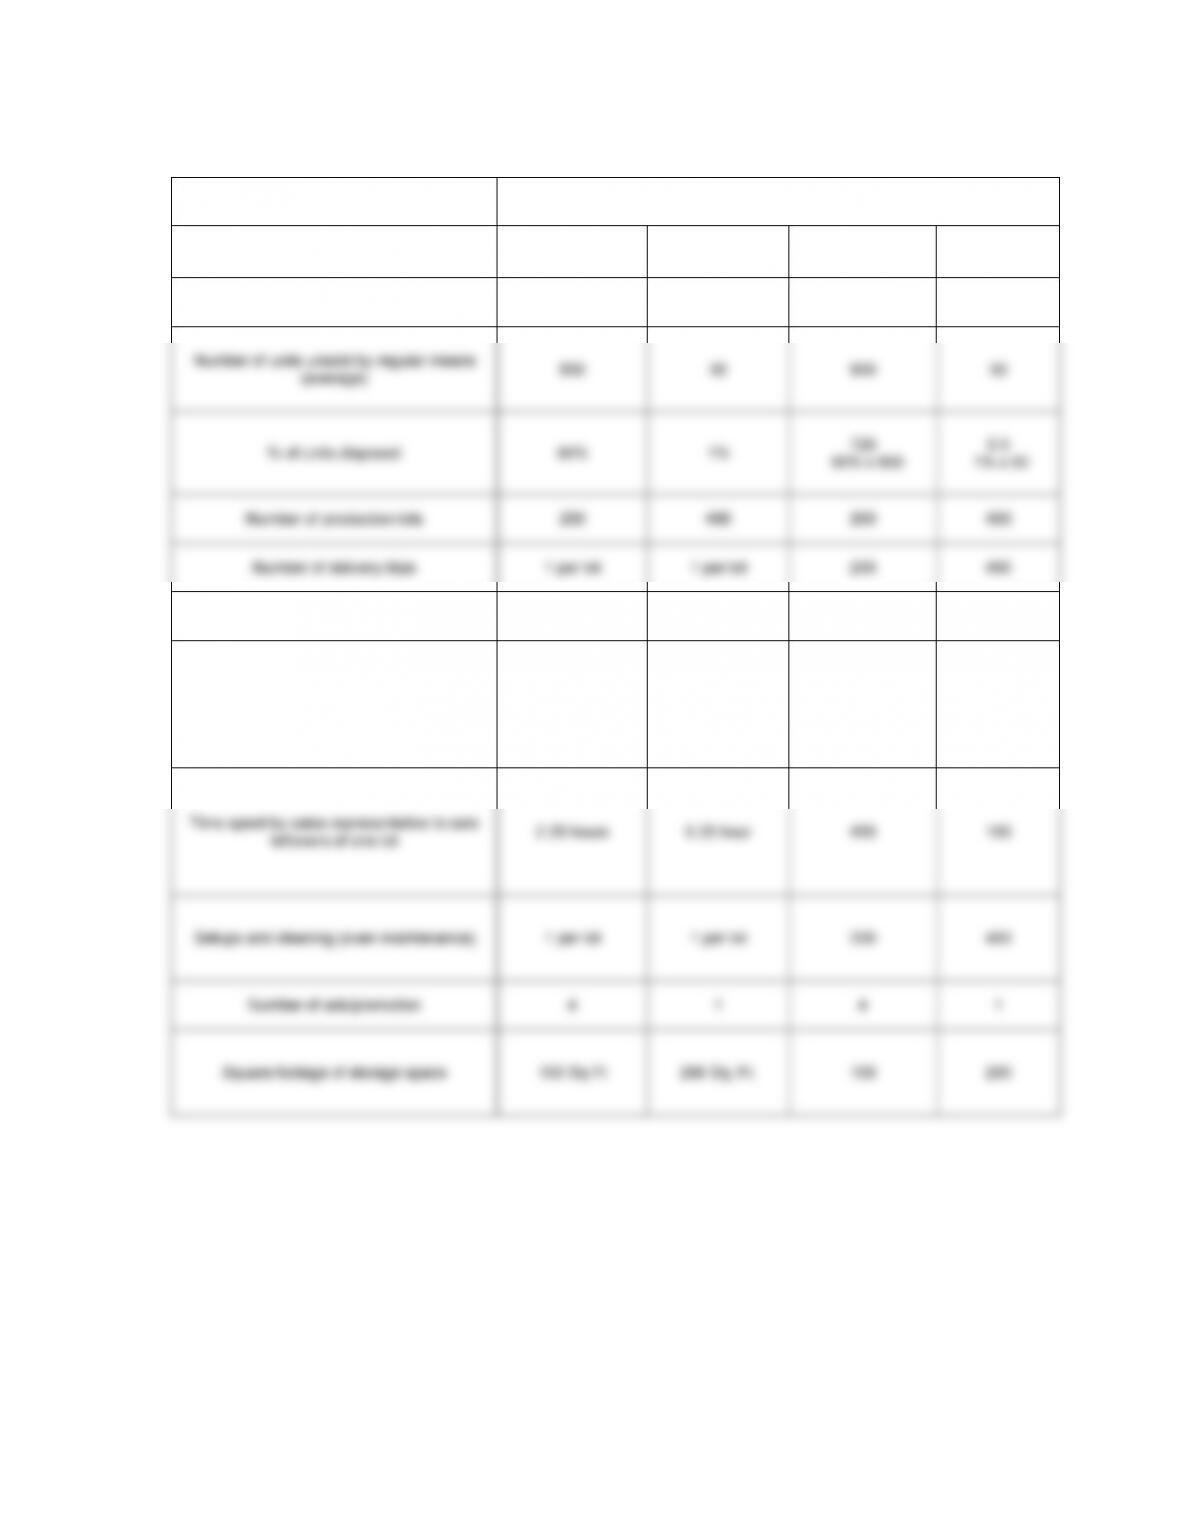
18-9
Cost Drivers’ Information
Cost Drivers
French Bread Wheat Bread French Bread Wheat Bread
Number of units produced 2,000 8,000 2,000 8,000
Number of disposal trips 1 per lot none 200 0
Time spent on the phone by sales
representative to sell one lot 3 hours 0.5 hour 240 200
217
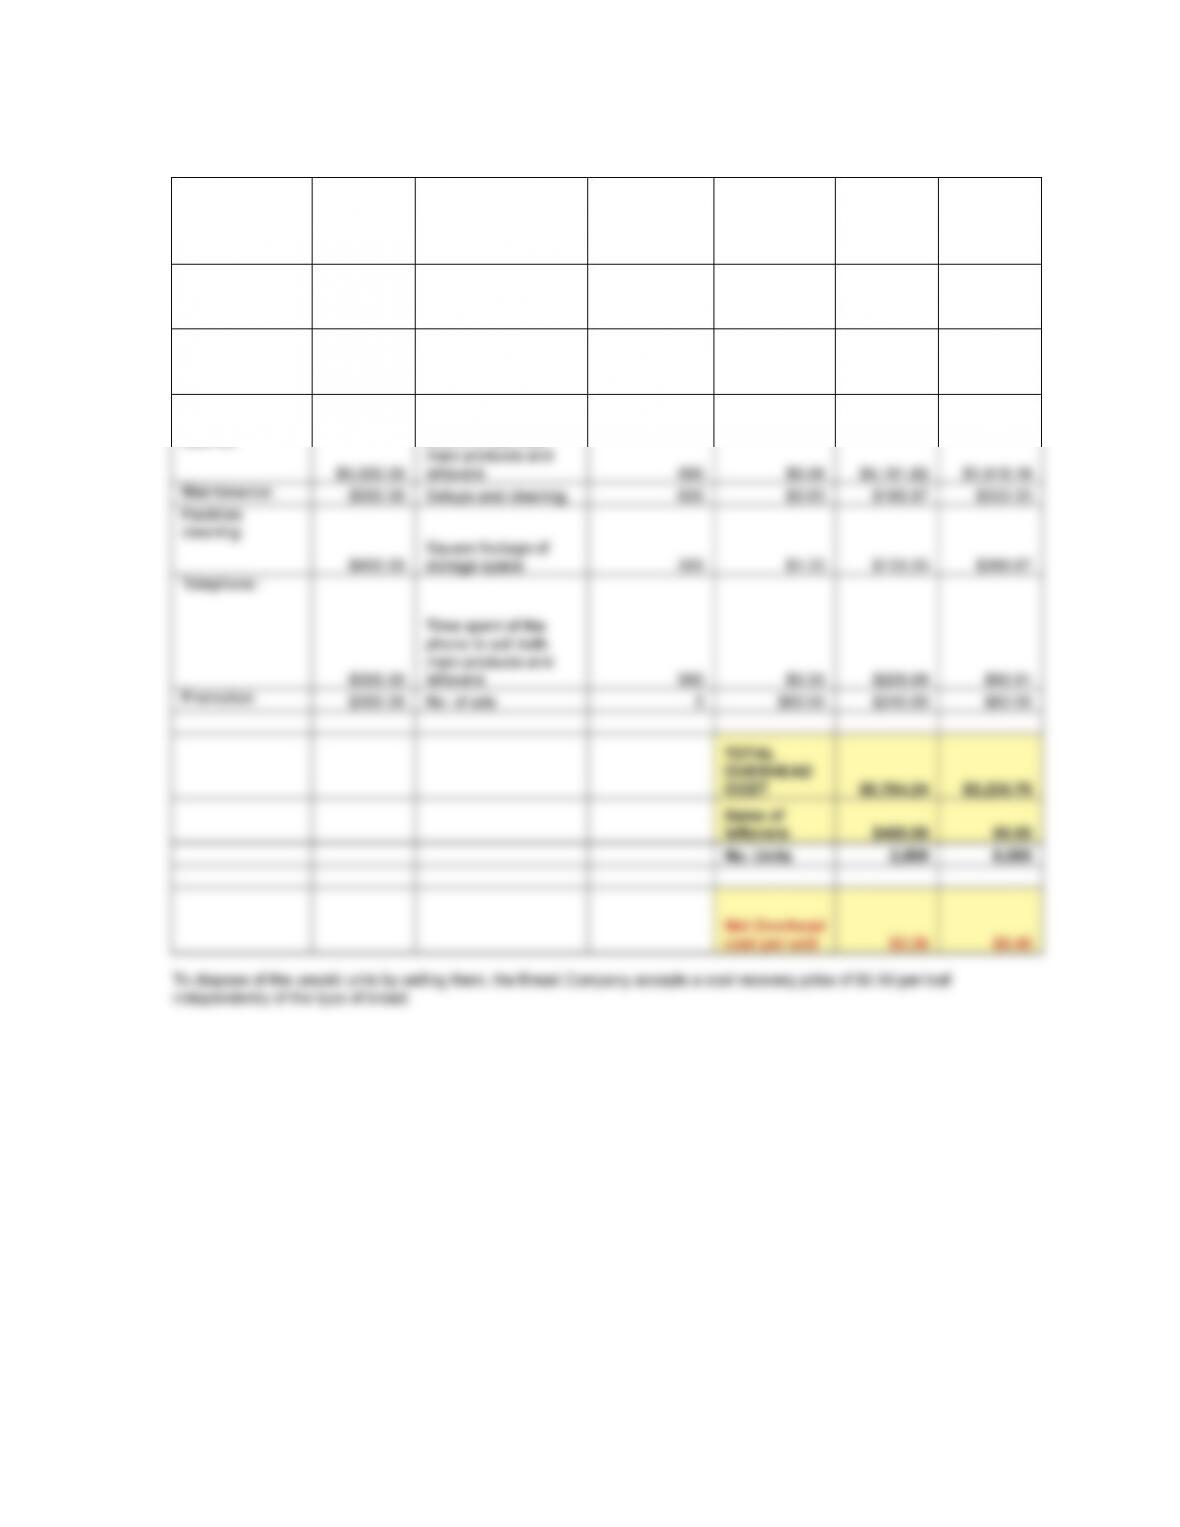
18-9 .(Continued)
Cost
Information: Cost Driver
No. Annual
transactions
Cost per
transaction
French
Bread
Wheat
Bread
Transportation of
sold products:
$1,000.00
Number of delivery
trips
600 $1.67 $333.33 $666.67
Transportation
and disposal of
unsold products: $1,500.00
Number of disposal
trips
200 $7.50 $1,500.00 $ –
Sales
department
salaries:
Time spent on the
phone to sell both
218
18-9 .(Continued)
a
French
Bread
Wheat
Bread
No. Units 2,000 8,000
Direct cost per
unit $0.75 $1.25
219
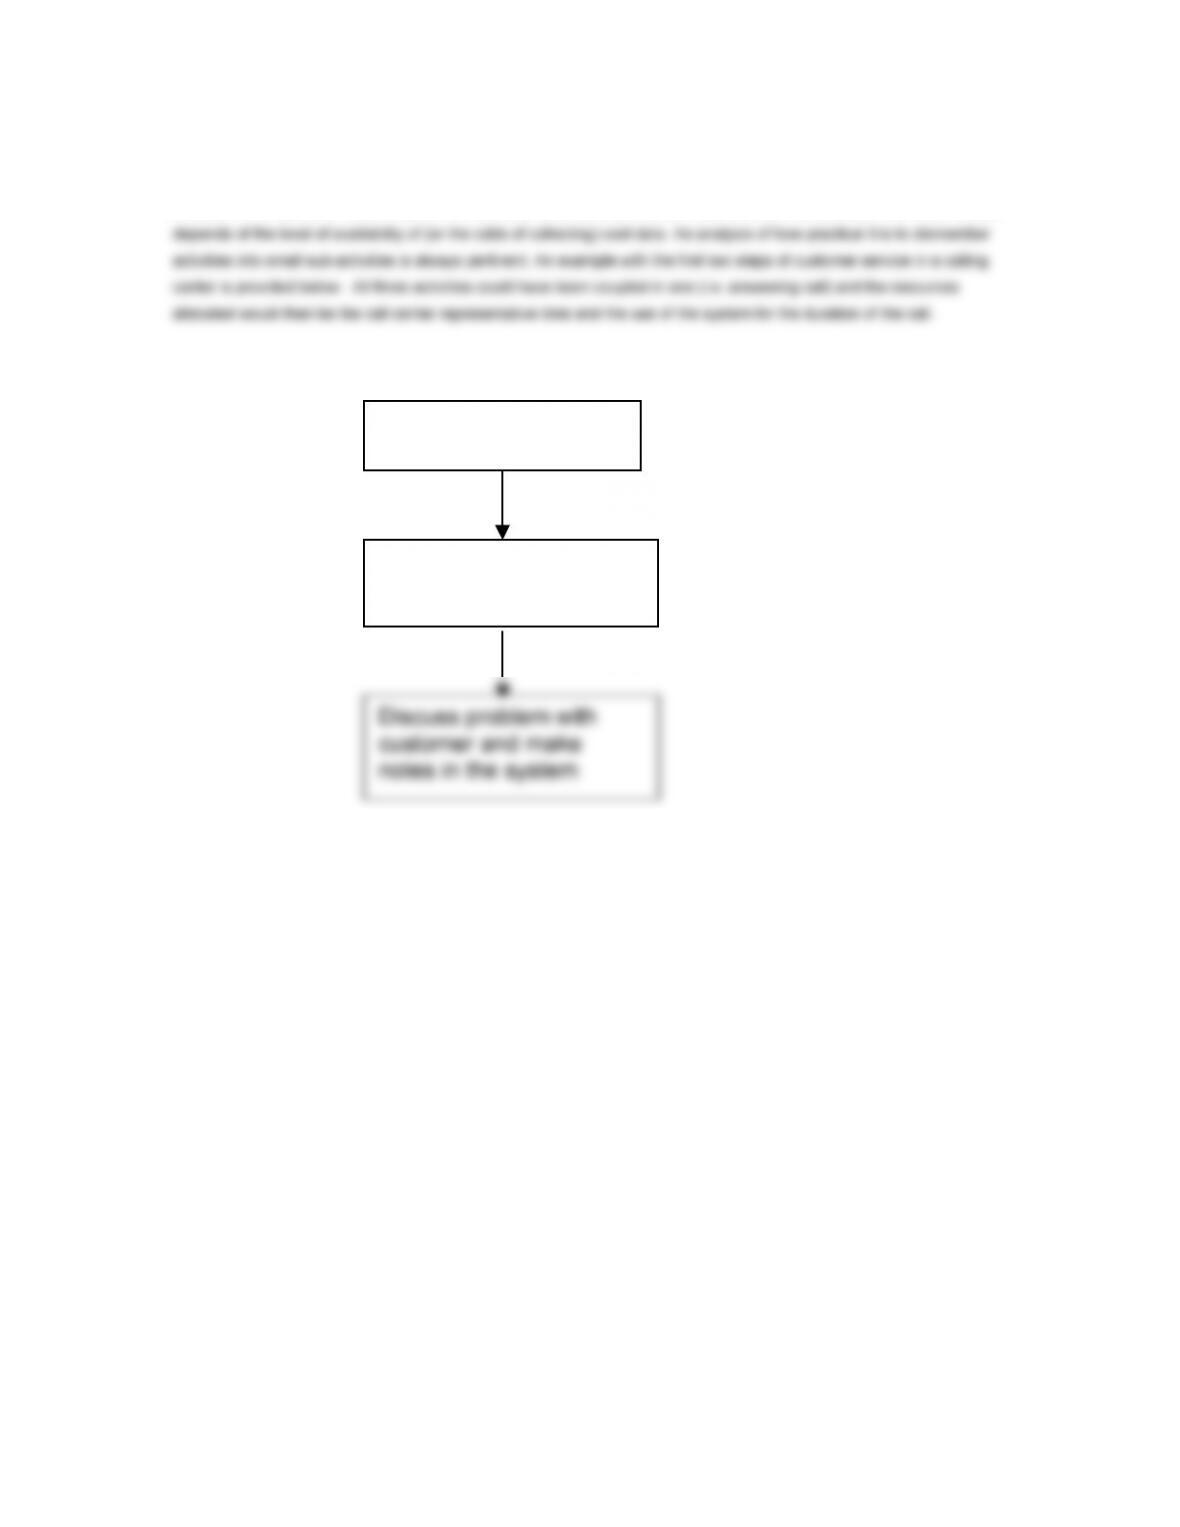
18-10 There are several possible ways to create a flow chart that reflects the operations and processes necessary to
deliver a service or manufacture a product. This first step helps the analyst realize the number of activities and processes
involved in the operation. Each node in the flow chart is an activity to which resources can be allocated. The level of detail
A
nswer the phone and
ask for customer
Look for customer
account in the system
220
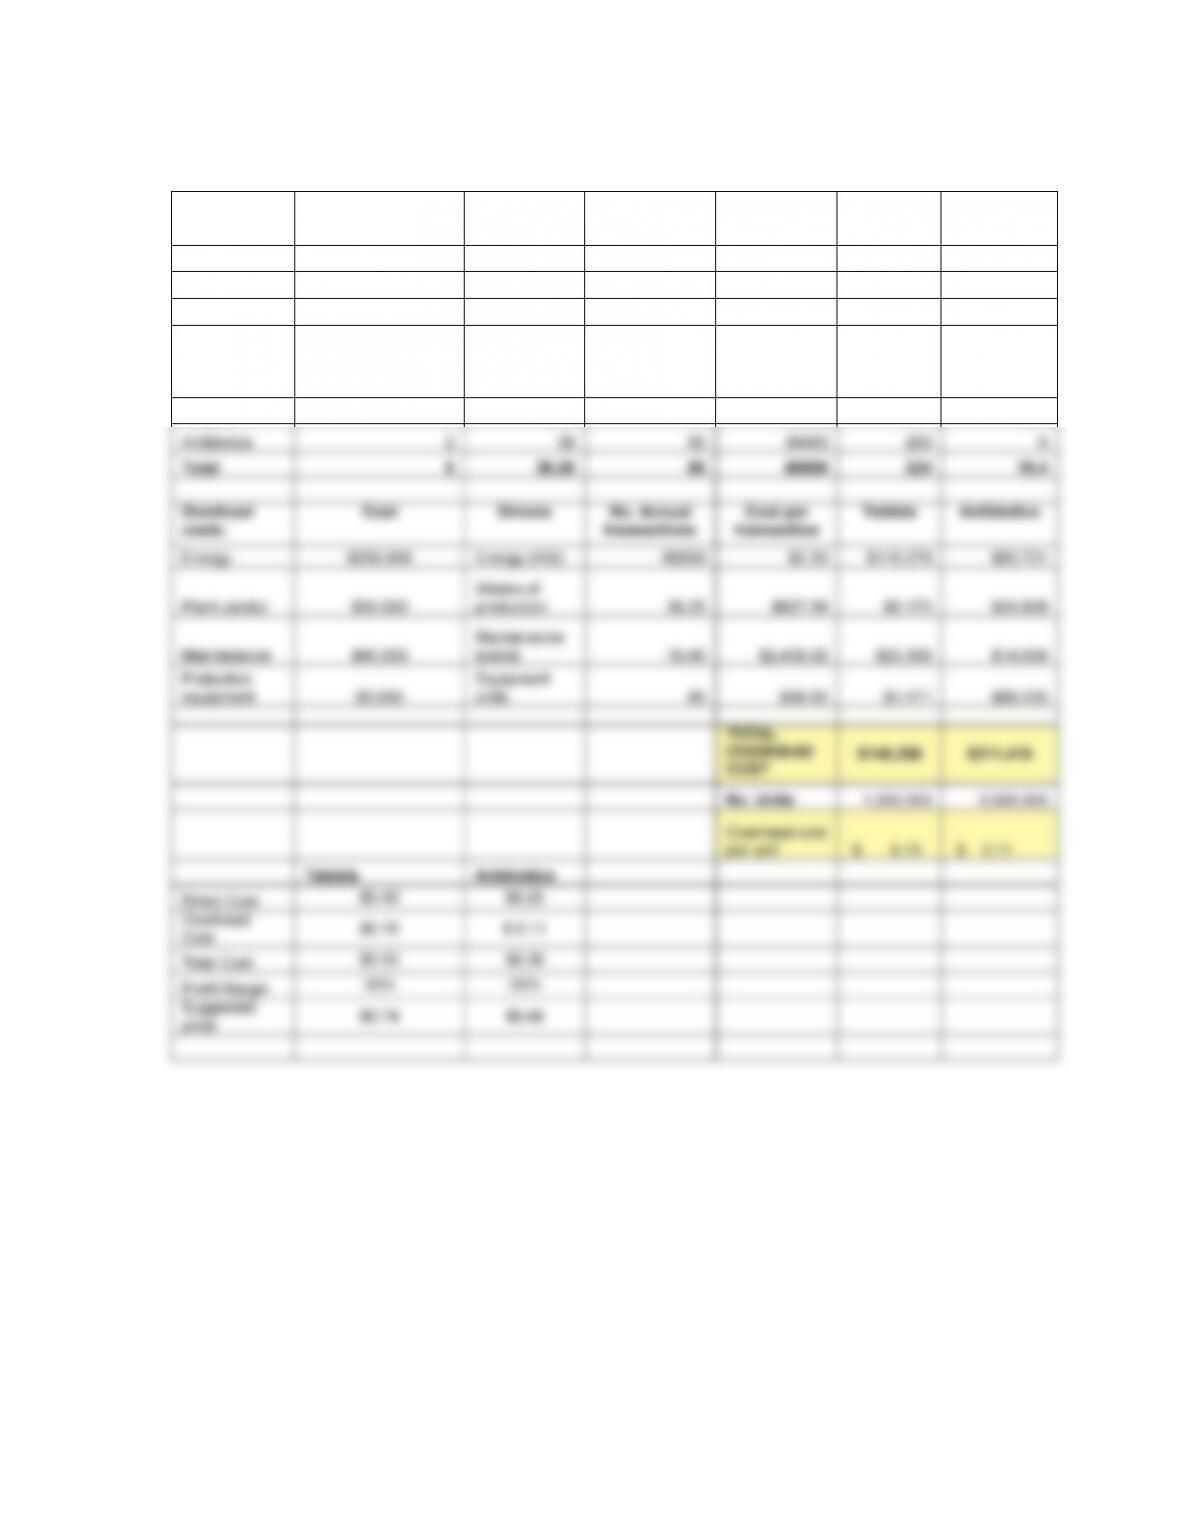
18-11.
Production in units Direct costs: Kg of
production
Energy per
hour of
production
Production
Rate
Production
Hrs
Tablets 1,000,000 $400,000 $50,000 200KW 24 kg/hr 250
Antibiotics 2,000,000 $500,000 $120,000 30KW 100 kg/hr 1200
Operators production
weeks
No. of
protection
equipment
units
Energy
consumption
(KW-HR)
cycles events
Tablets 4 6.25 25 50000 24 10.4
221
18-12.
Cost Item Cost Drivers No. of transactions Cost per
transaction Service A Service B
Sales
representatives
salaries $140,000
Estimated % of
effort 100% $140,000 $35,000 $105,000
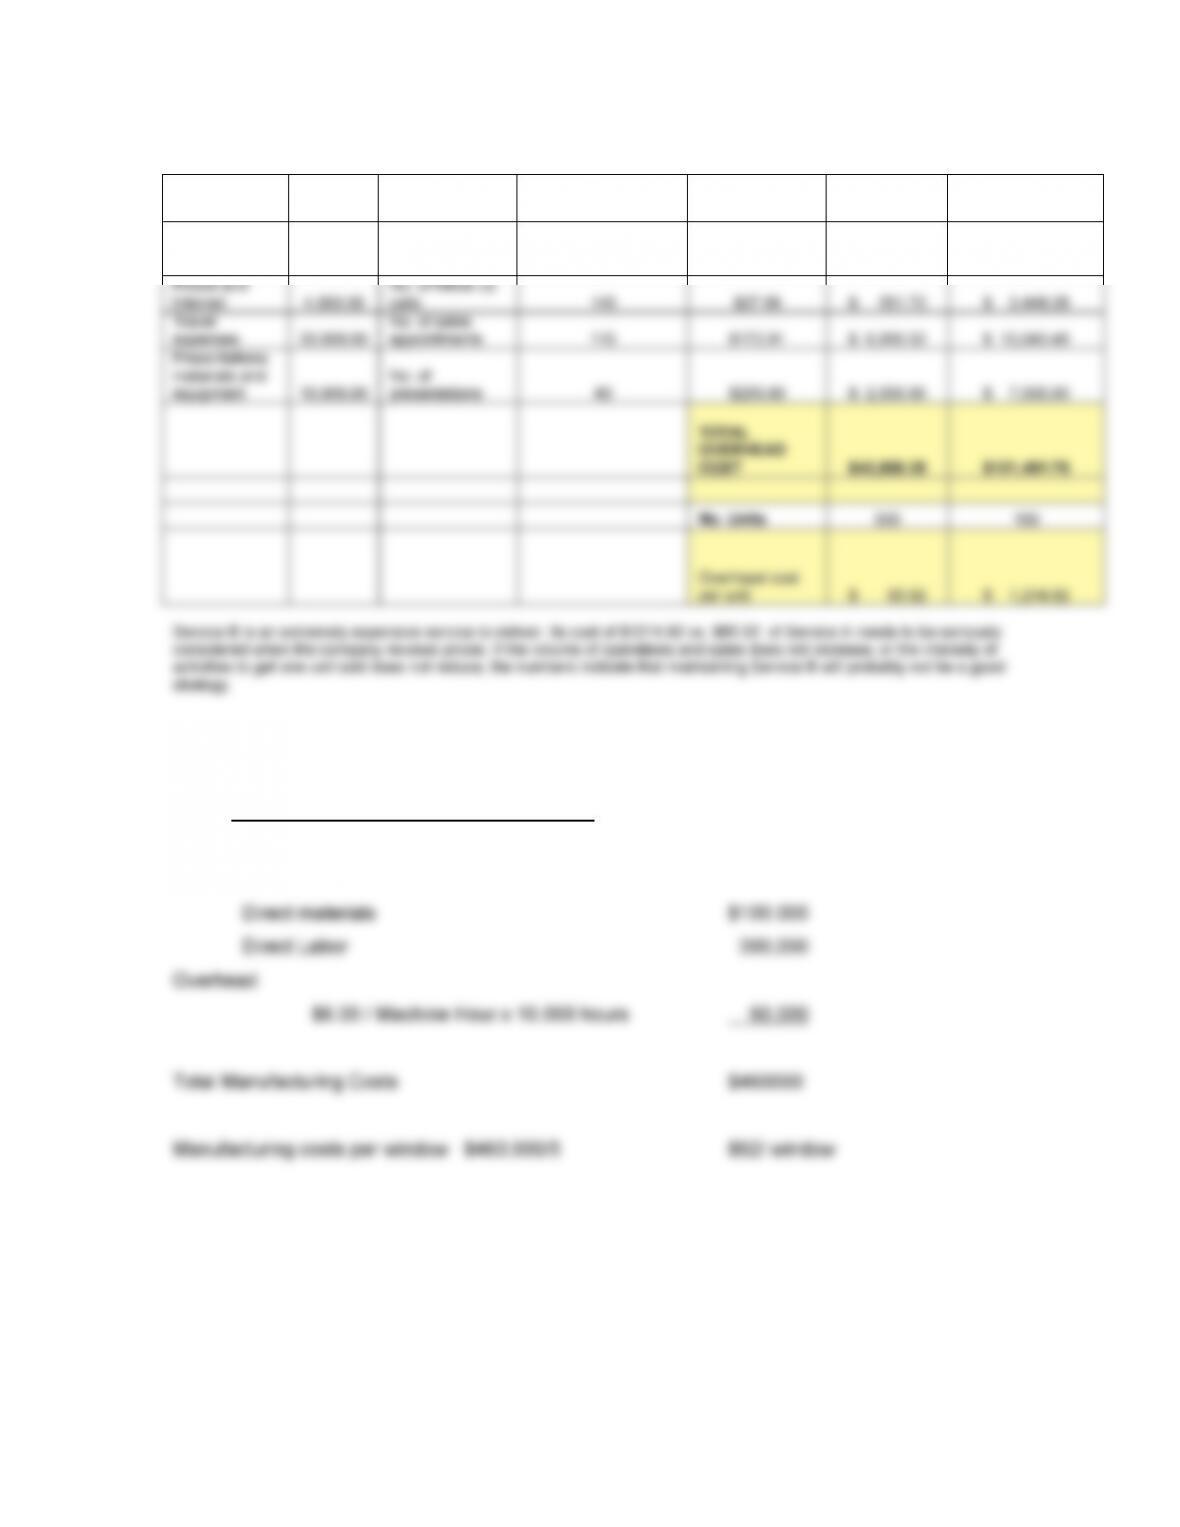
18-13 Manufacturing Costs under current system
Direct Costs :
222
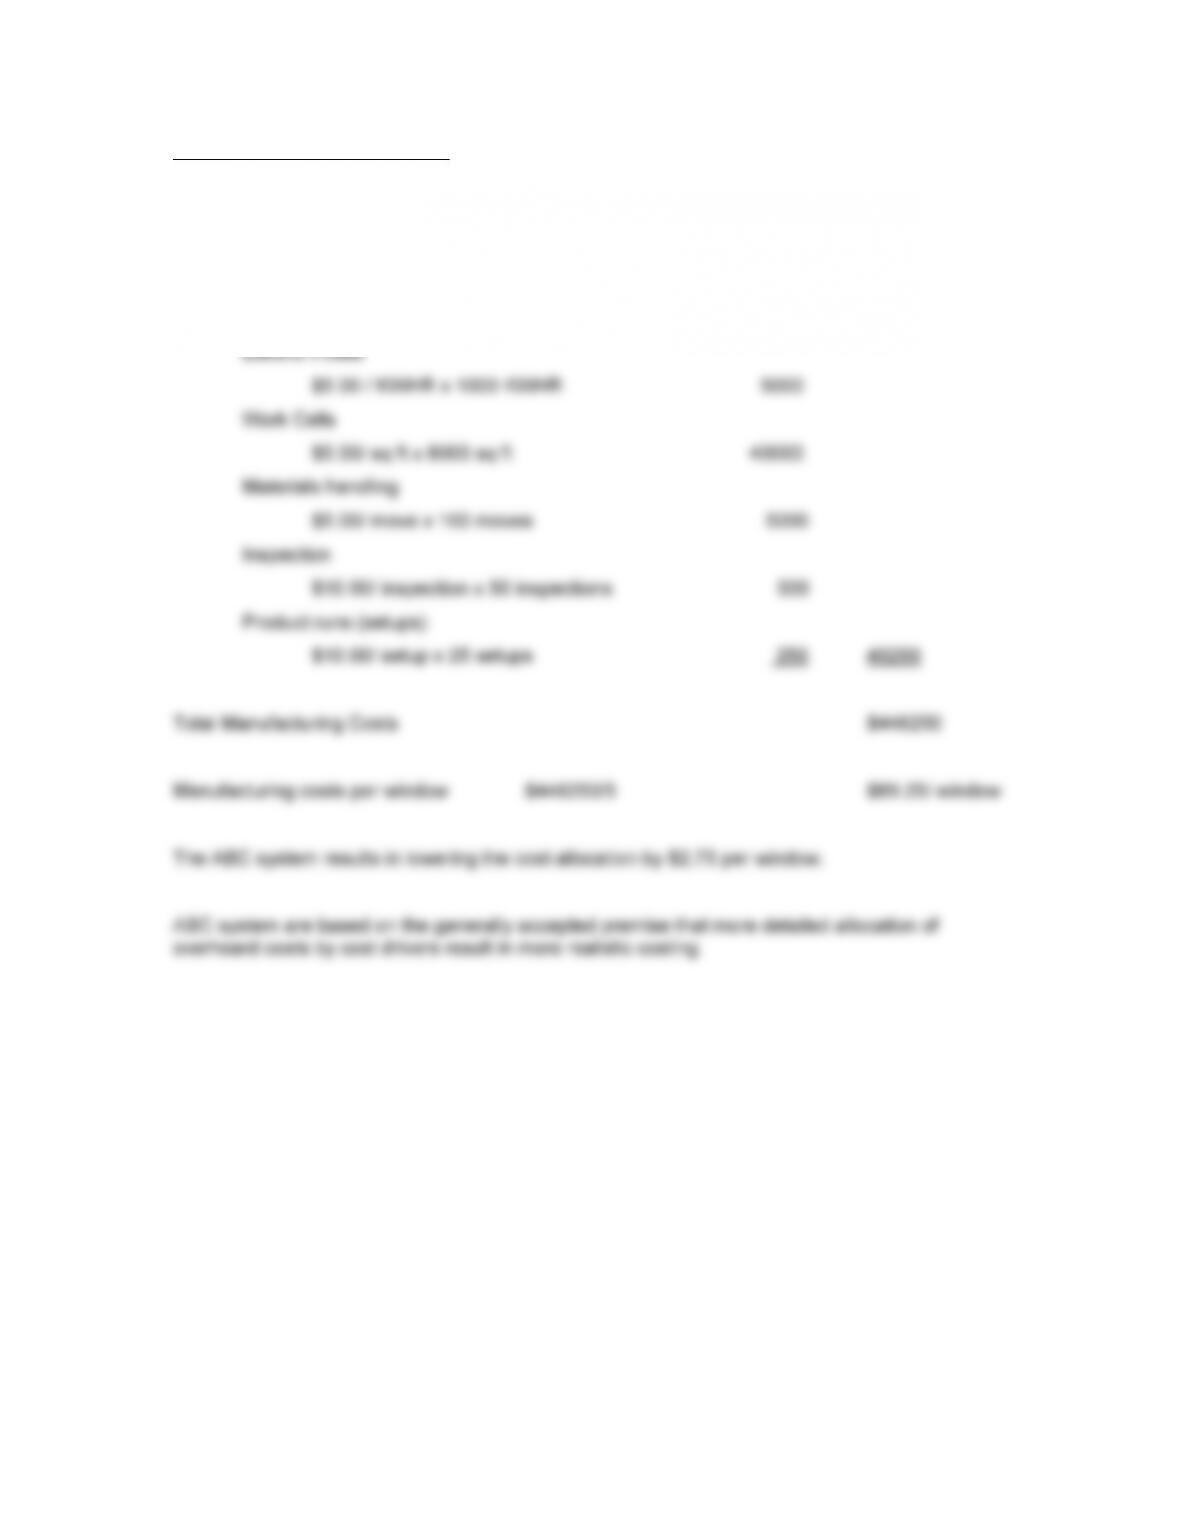
Manufacturing Costs under ABC
Direct Costs :
Direct materials $100.000
Direct Labor 300,000
Overhead
223