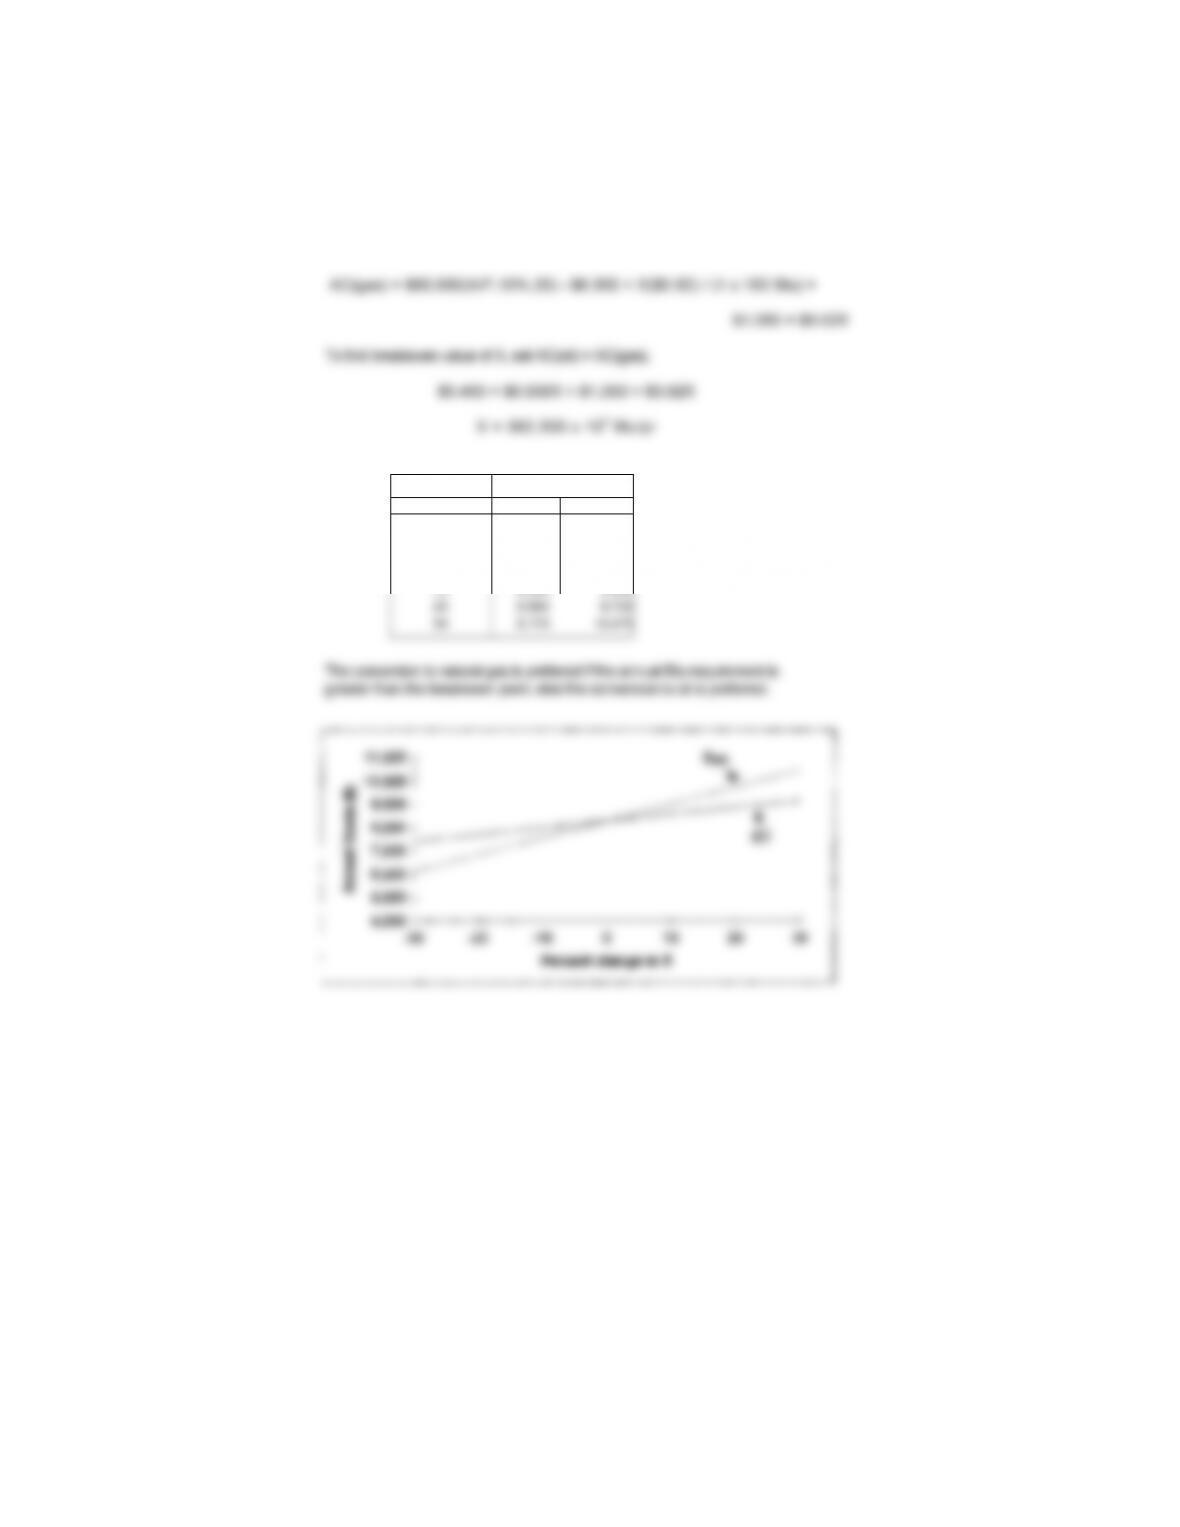
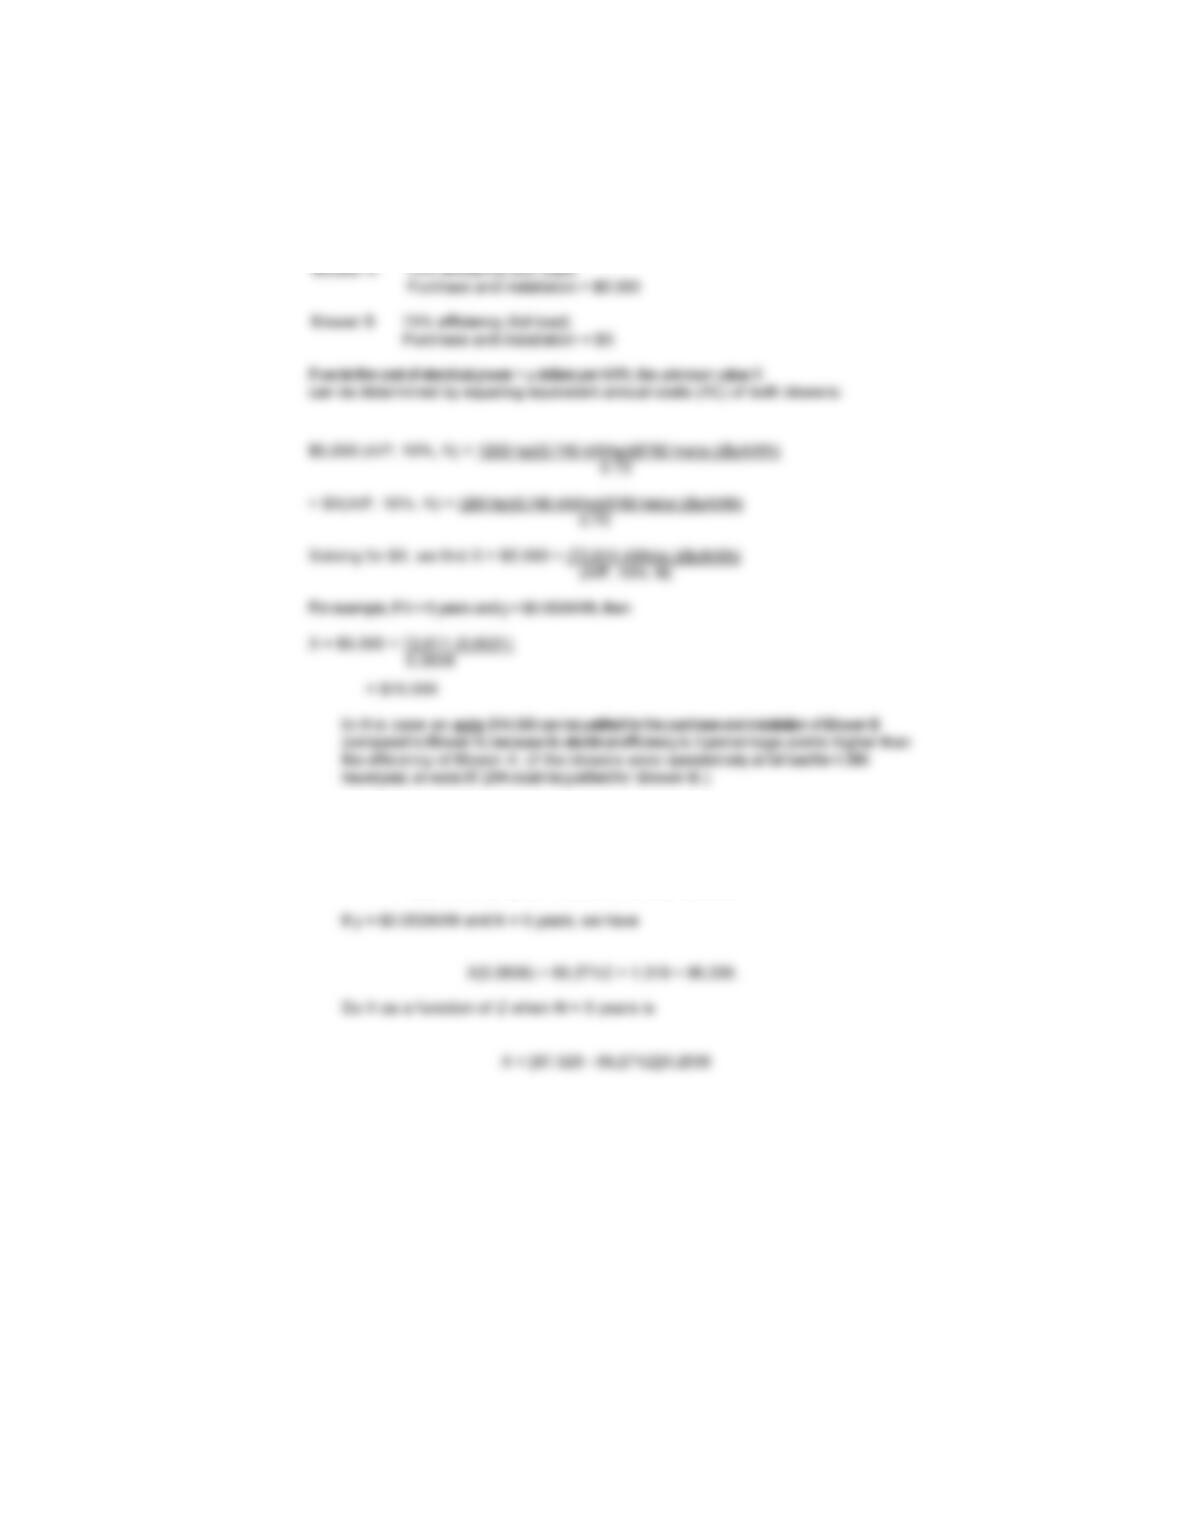
13-12 Let X = annual Btu requirement (in 103 Btu)
AC(oil) = $80,000(A/P,10%,20) – $4,000 + X($1.10) / (140 x 103 Btu) =
$5,400 + $0.008X
Annual Costs ($)
% chan
g
e in X Oil Gas
-30 7,430 6,125
-20 7,720 6,850
-10 8,010 7,575
0 8,300 8,300
10 8,590 9,025
161
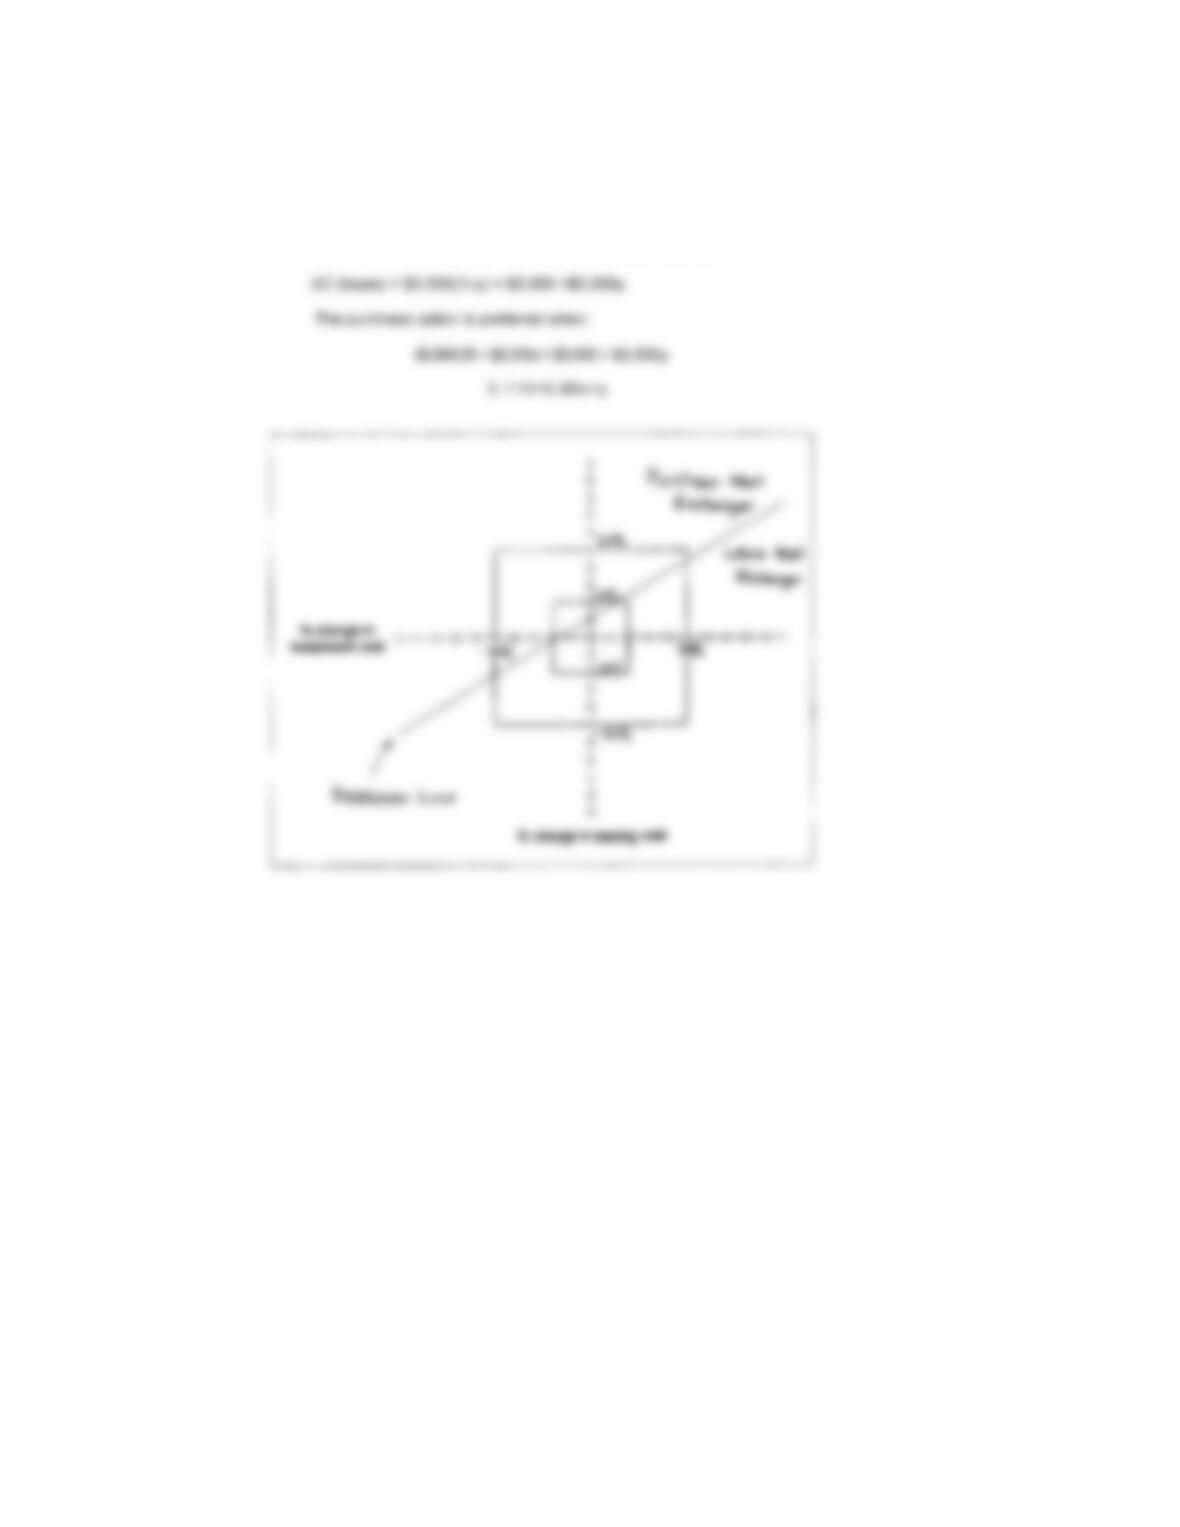
13–13. x =change in initial investment cost of heat exchanger
y = change in annual leasing expense
AC (purchase) = $10,000(1+x)(A/P,5%,5) + $1,000 + $500(A/G,5%,5)
-$2,000(A/F,5%,5) = $3,899.25 + 2,310x
162
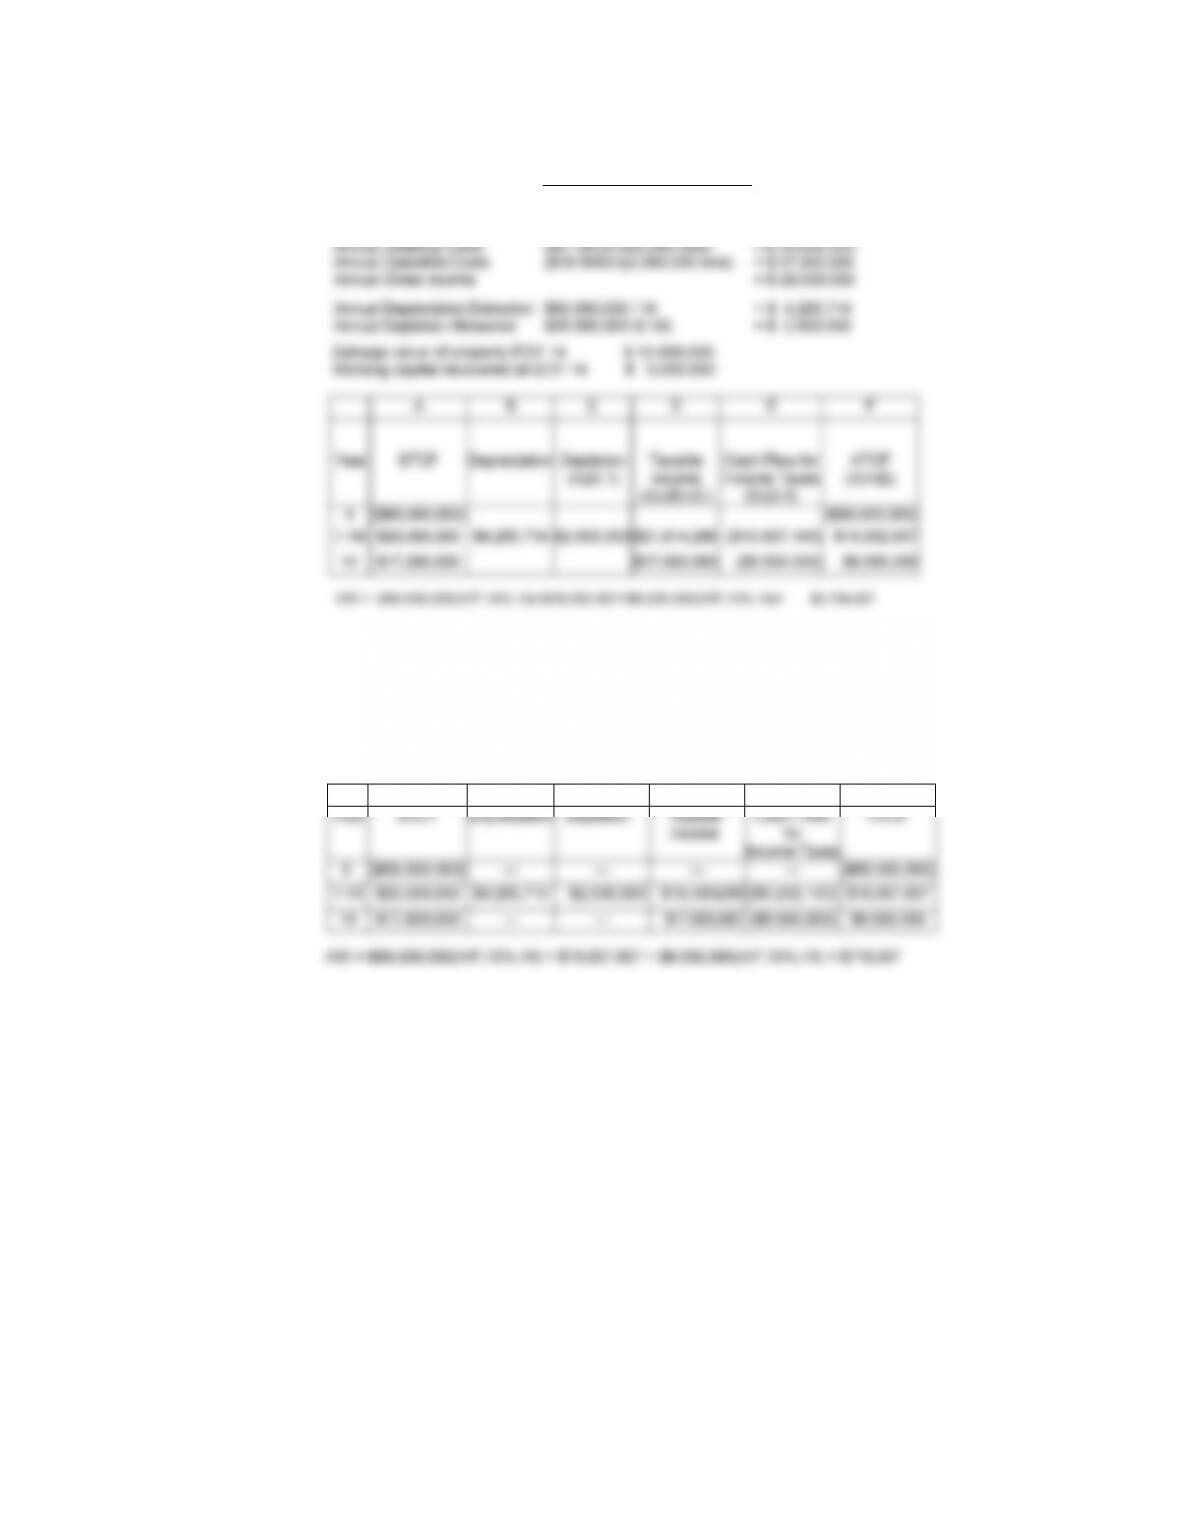
b) +10% change in average operating cost :
Annual Operating Costs = ($1 8.50 / ton)(1. 10)(2,000,000 tons) •$40,700,000
Annual Gross Income = $25,300,000
Annual Depletion Allowance = ($25,300,000)(0.10) = $2,530,000
A B C D E F
13–14 a) Price of Property
Equipment Investment
Workin
g
Ca
p
ital
$24,000,000
$60,000,000
$5,000,000
Total Capital Invested $89,000,000
Annual Revenues ($38/ton)(2,000,000 tons) =$ 76,000,000
163
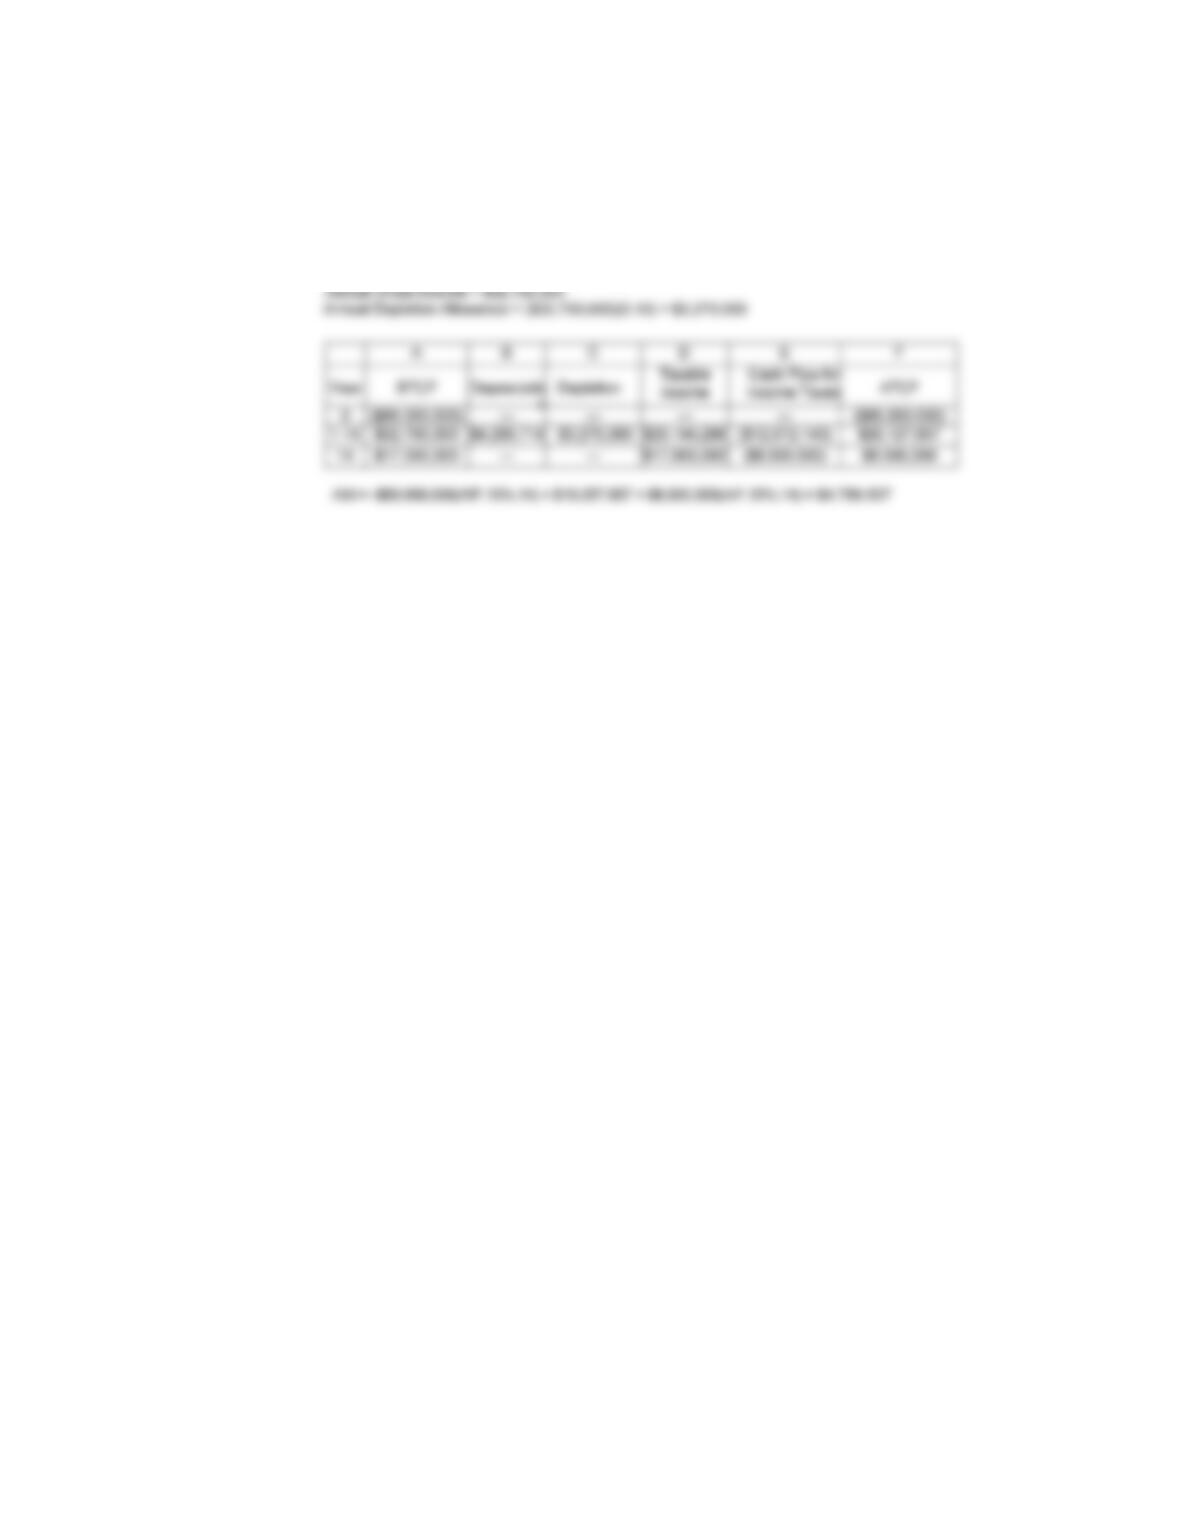
13-14. b) (continued.)
-10% change in average operating cost :
Annual Operating Costs = ($18.50/ton)(0.90)(2,000,000 tons) = $33,300,000
164
13-15
(1) Assume the two blowers are equally desirable and have the same life, N years. Let the
installed cost of Blower B equal $X. Their price difference, $5,000 versus $X, must be
balanced against energy savings arising because of the difference in operating efficiency. Also
assume continuous operation for 8760 hours per year, in addition to negligible salvage
values.
(2) Let the efficiency of the more expensive Blower B be “Z” and let
W = 200(0.746)(8,760). Then
X (A/P, 10%, N) + yW/Z = 5,000 (A/P, 10%, N) + yW/0.72
165
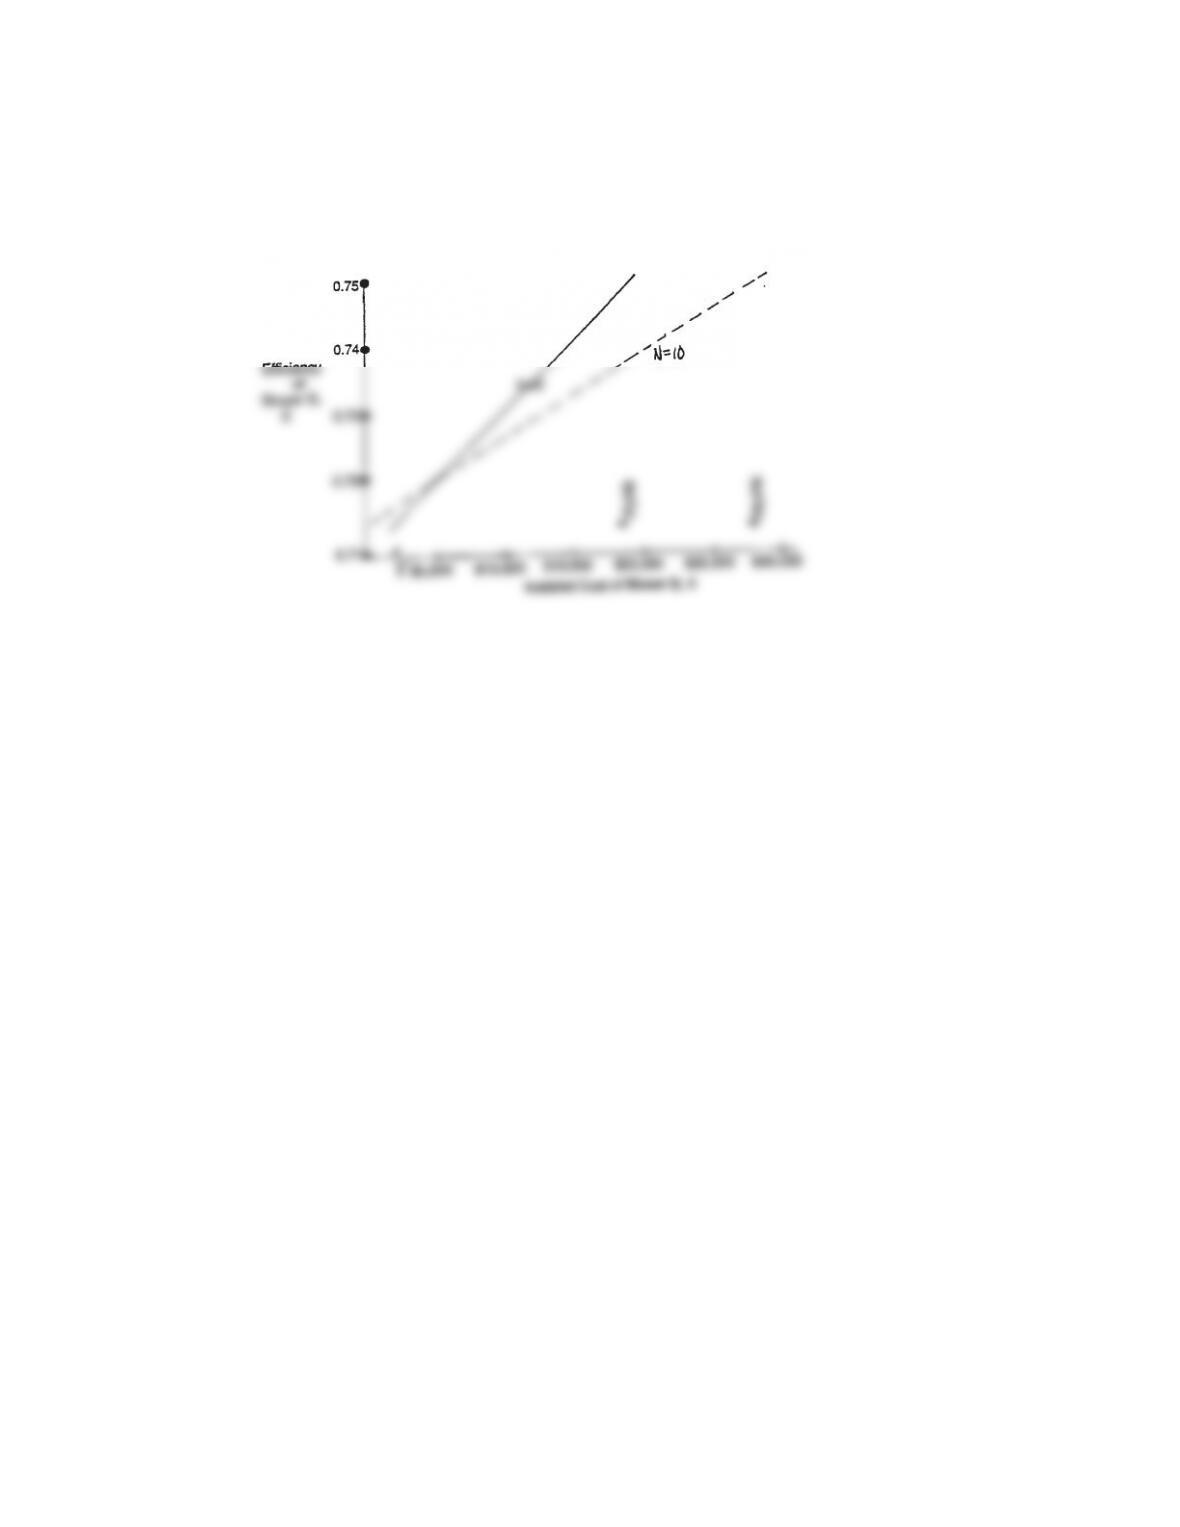
13-15. (continued)
The plot is shown below.
166
13-16 a) AC(A) = $2,000(A/P,10%,6) + $3,500 = $3,959
AC(B) = $6,000(A/P,10%,3) + $1,000 – $4,000(A/F,10%,3) = $2,204
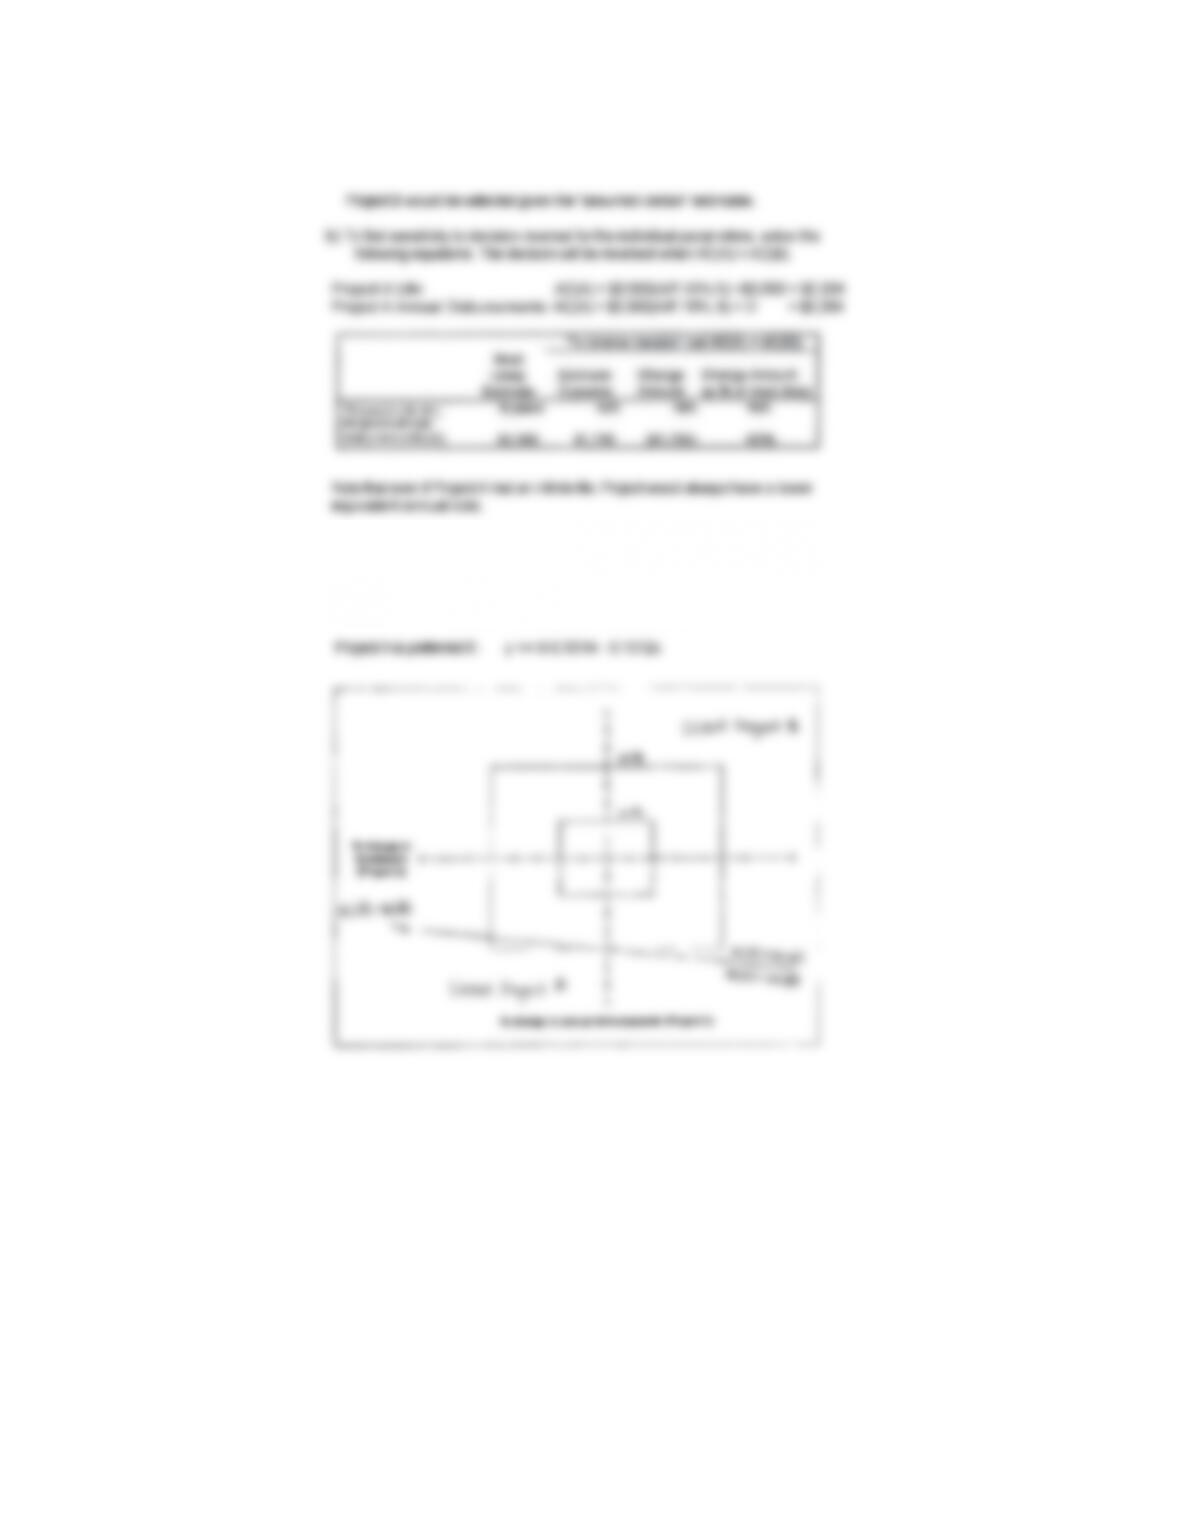
c) Project A is preferred if AC(A) <= AC(B). Let x =proportion change in Project A
investment cost and y = proportion change in Project A annual disbursements.
$2,000(1+x)(A/P,10%,6) + $3,500(1+y) <= $2,204
$3,959 + $459.2x + $3,500y <=$2,204
167
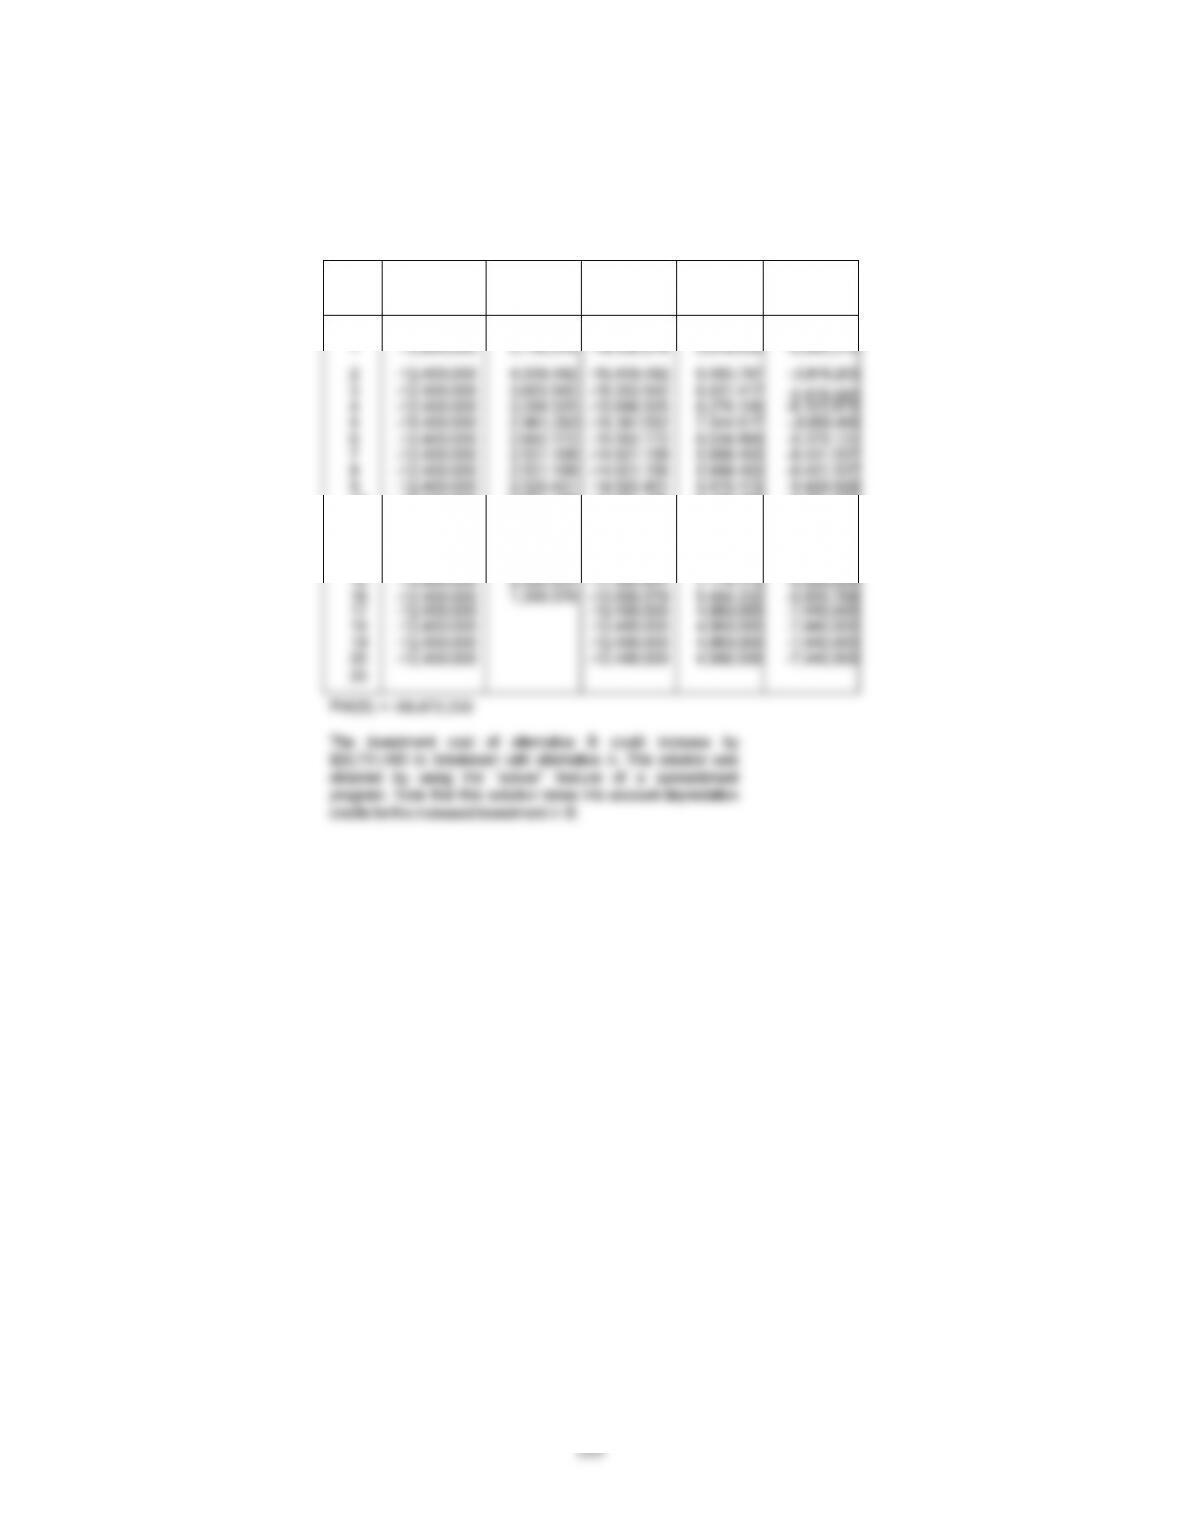
13-17 a) Alternative A
Year BTCF
MACRS
Depreciation
Taxable
Income
Cash Flow
for Income
Taxe
s
ATCF
0 -108
,
000
,
000 – – -108
,
000
,
000
1 -3
,
460
,
000 5
,
400
,
000 -8
,
860
,
000 3
,
544
,
000 84
,
000
2 -3
,
460
,
000 10
,
260
,
000 -13
,
720
,
000 5
,
488
,
000 2
,
028
,
000
3 -3
,
460
,
000 9
,
234
,
000 -12
,
694
,
000 5
,
077
,
600 1
,
617
,
600
4 -3
,
460
,
000 8
,
316
,
000 -11
,
776
,
000 4
,
710
,
400 1
,
250
,
400
5 -3
,
460
,
000 7
,
484
,
400 -10
,
944
,
400 4
,
377
,
760 917
,
760
6 -3
,
460
,
000 6
,
728
,
400 -10
,
188
,
400 4
,
075
,
360 615
,
360
,
,
,
,
,
,
,
,
,
,
,
,
,
,
,
,
,
,
,
,
,
,
,
,
,
,
,
,
,
,
,
,
,
,
,
,
,
,
,
,
,
,
,
,
,
,
,
,
,
,
,
,
,
,
,
,
,
,
,
,
,
,
,
,
,
,
,
,
,
,
,
,
,
,
,
,
,
,
,
,
,
,
,
,
,
,
,
,
,
,
,
,
,
,
,
,
,
,
,
PW(A) = -$99,472,154
Alternative B:
Year BTCF
MACRS
Depreciation
Taxable
Income
Cash Flow
for Income
Taxes ATCF
0
–
17,000,000
— –
17,000,000
1 -12
,
400
,
000 850
,
000 -13
,
250
,
000 5
,
300
,
000 -7
,
100
,
000
2 -12
,
400
,
000 1
,
615
,
000 -14
,
015
,
000 5
,
606
,
000 -6794
,
000
3 -12
,
400
,
000 1
,
453
,
500 -13
,
853
,
500 5
,
541
,
400 -6
,
858
,
600
4 -12
,
400
,
000 1
,
309
,
000 -13
,
709
,
000 5
,
483
,
600 -6
,
916
,
400
,
,
,
,
,
,
,
,
,
,
,
,
,
,
,
,
,
,
,
,
,
,
,
,
,
,
,
,
,
,
,
,
,
,
,
,
,
,
,
,
,
,
,
,
,
,
,
,
,
,
,
,
,
,
,
,
,
,
,
,
,
,
,
,
,
,
,
,
,
,
,
,
,
,
,
,
,
,
,
,
,
,
,
,
,
,
,
,
,
,
,
,
,
,
,
,
,
,
,
,
,
,
,
,
,
,
,
,
,
,
,
,
,
,
,
,
,
,
,
,
,
,
,
,
,
,
,
,
,
,
,
,
,
,
168
,
,
,
,
,
,
,
,
,
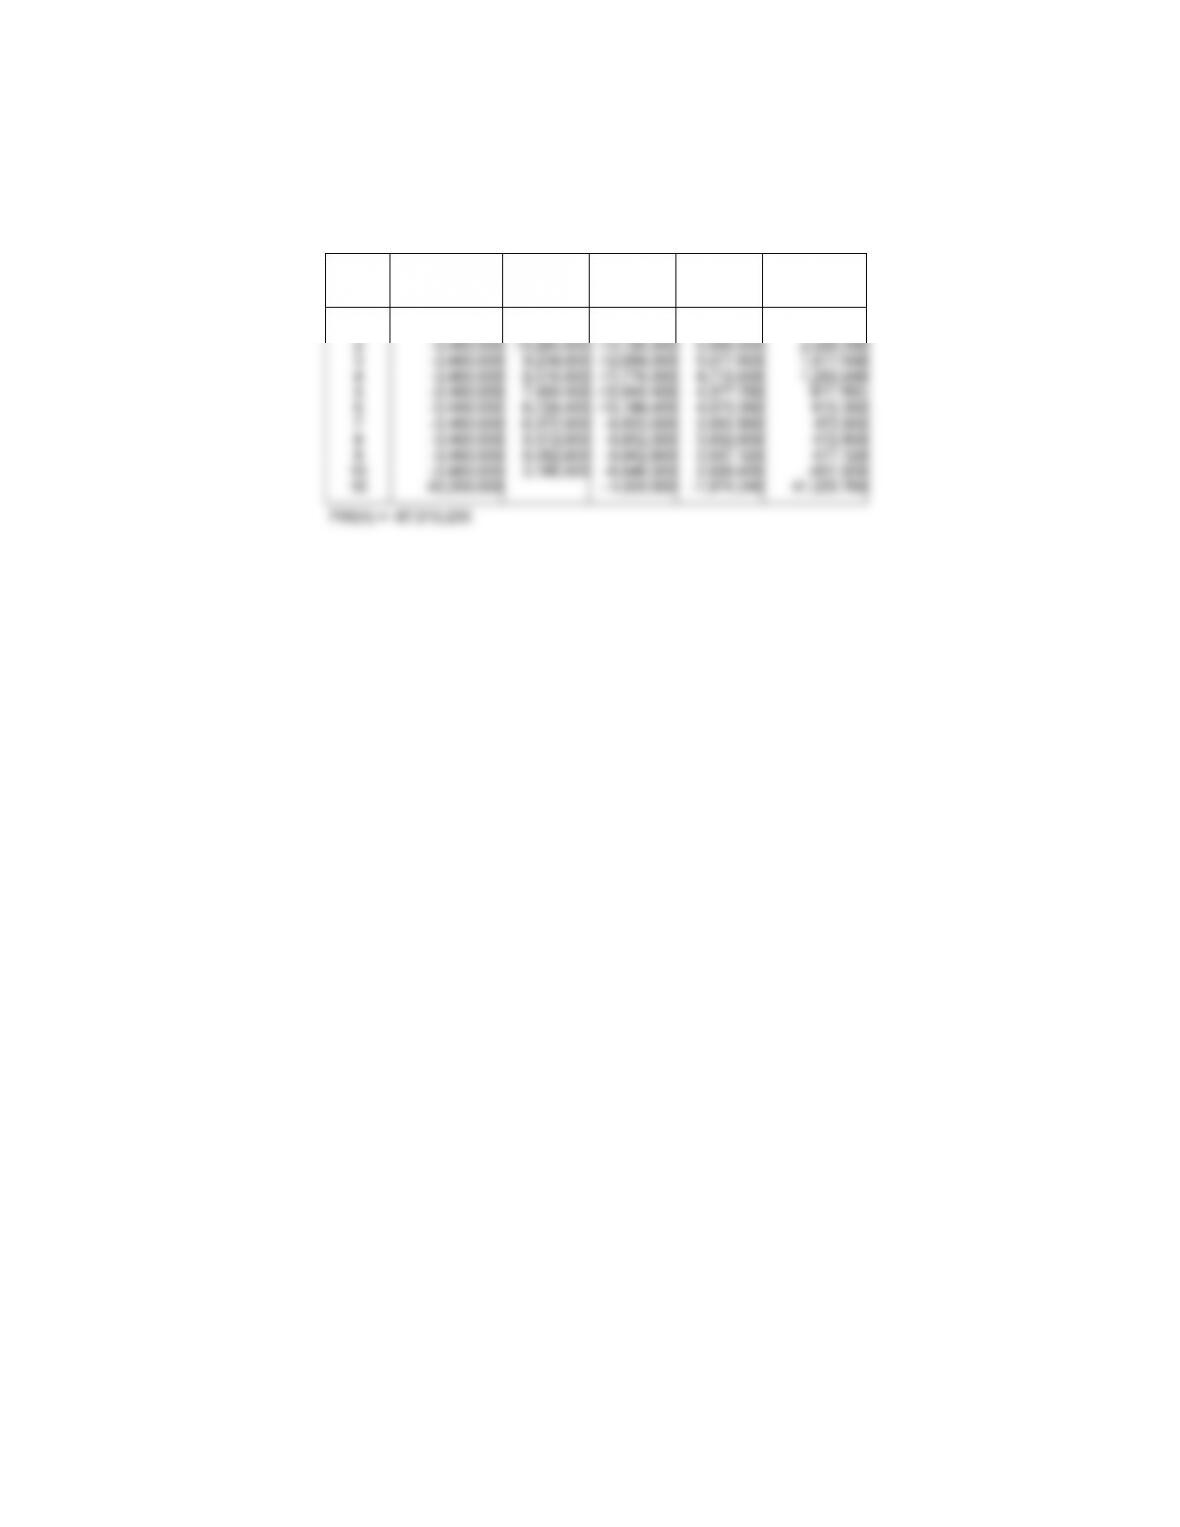
13-17 (continued)
Alternative B (revised to include extra investment permissible to breakeven):
Year BTCF
MACRS
Depreciation Taxable
Income
Cash Flow
for Income
Taxes ATCF
0 -42,731,490 – – — — -42,731,490
10 -15,400,000 2,521,158 -17,921,158 7,168,463 -8,231,537
11 -12,400,000 2,525,431 -14,925,431 5,970,172 -8,429,828
12 -12,400,000 2,521,158 -14,921,158 5,968,463 -8,431,537
13 -12,400,000 2,525,431 -14,925,431 5,970,172 -6,429,828
14 -12,400,000 2,521,158 -14,921,158 5,968,463 -5,431,537
169
b) Alternative A:
Year BTCF
MACRS
Depreciation Taxable
Income
Cash Flow
for Income
Taxes ATCF
0 -108,000,000 – – -108,000,000
1 -3,460,000 5,400,000 -8,860,000 3,544,000 84,000
170
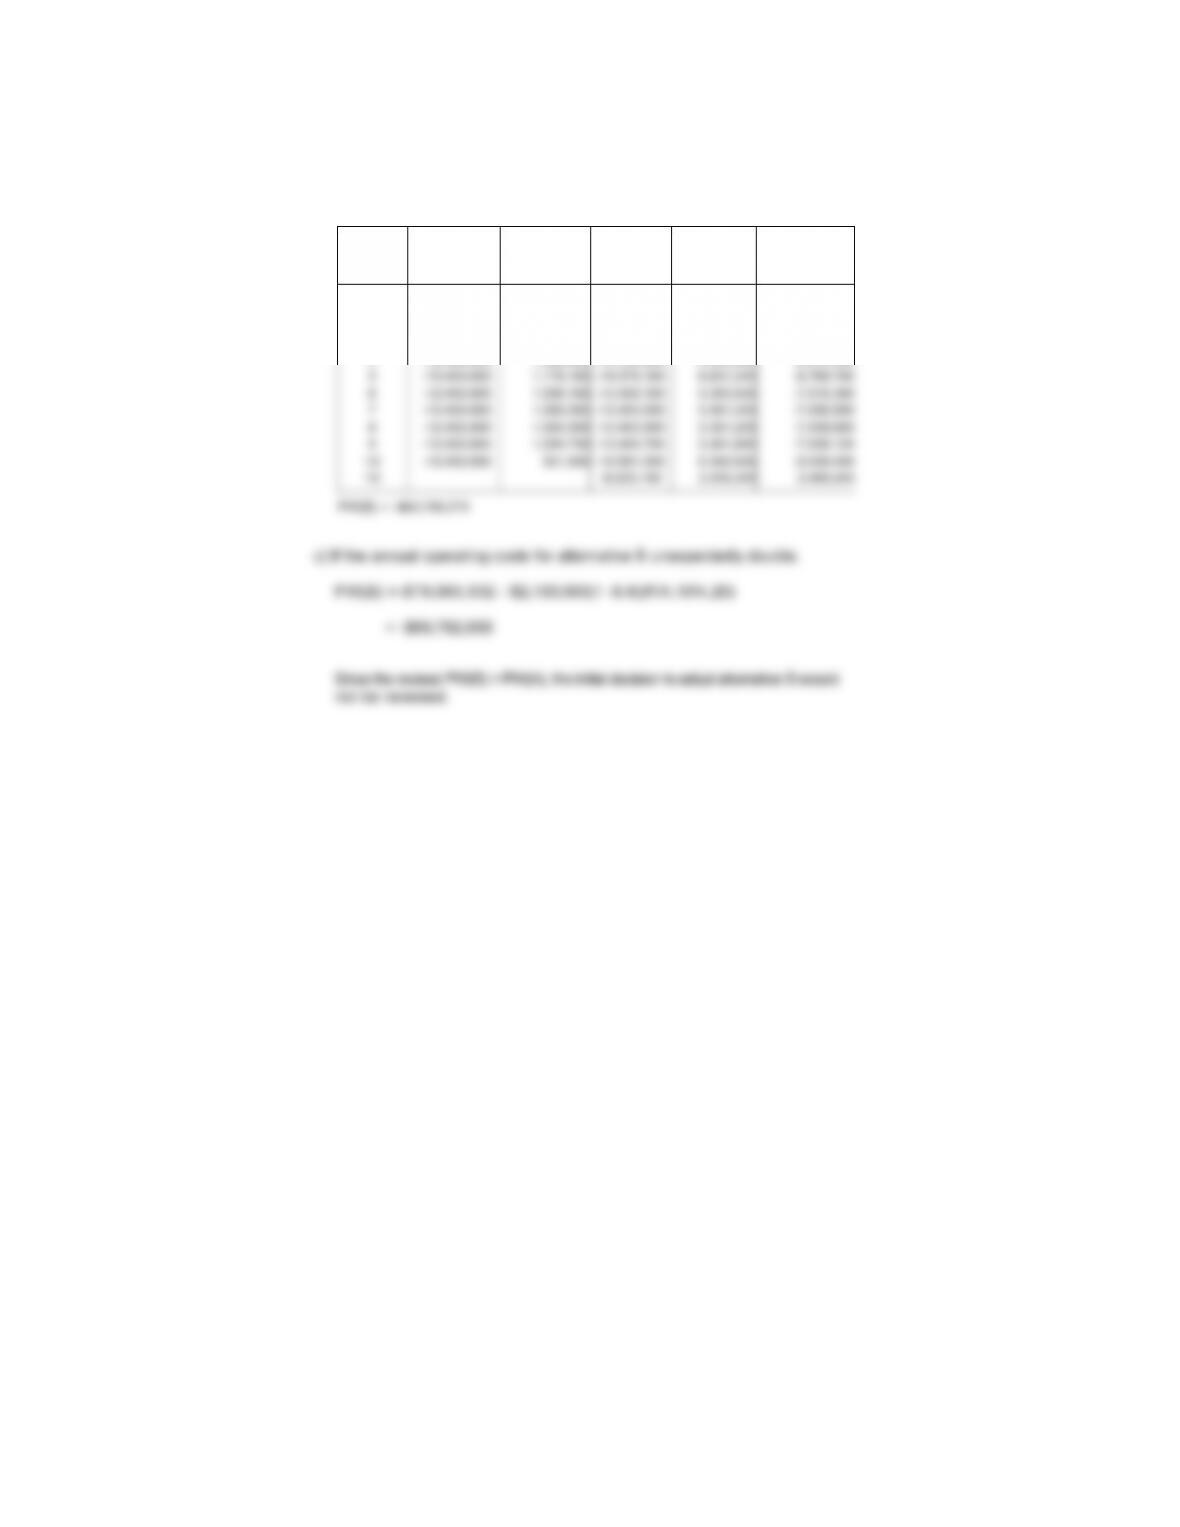
13-17 (continued)
Alternative B:
Year BTCF
MACRS
Depreciation
Taxable
Income
Cash Flow
for Income
Taxes ATCF
0 -17,000,000 — -17,000,000
1 -12,400,000 850,000 –13,250,000 5,300,000 -7,100,000
2 -12,400,000 1,615,000 -14,015,000 5,808,000 –8,794,000
3 -12,400,000 1,453,500 -13,853,500 5,541,400 -8,858,600
4 -12,400,000 1,309,000 -13,709,000 5,483,600 -8,916,400
171
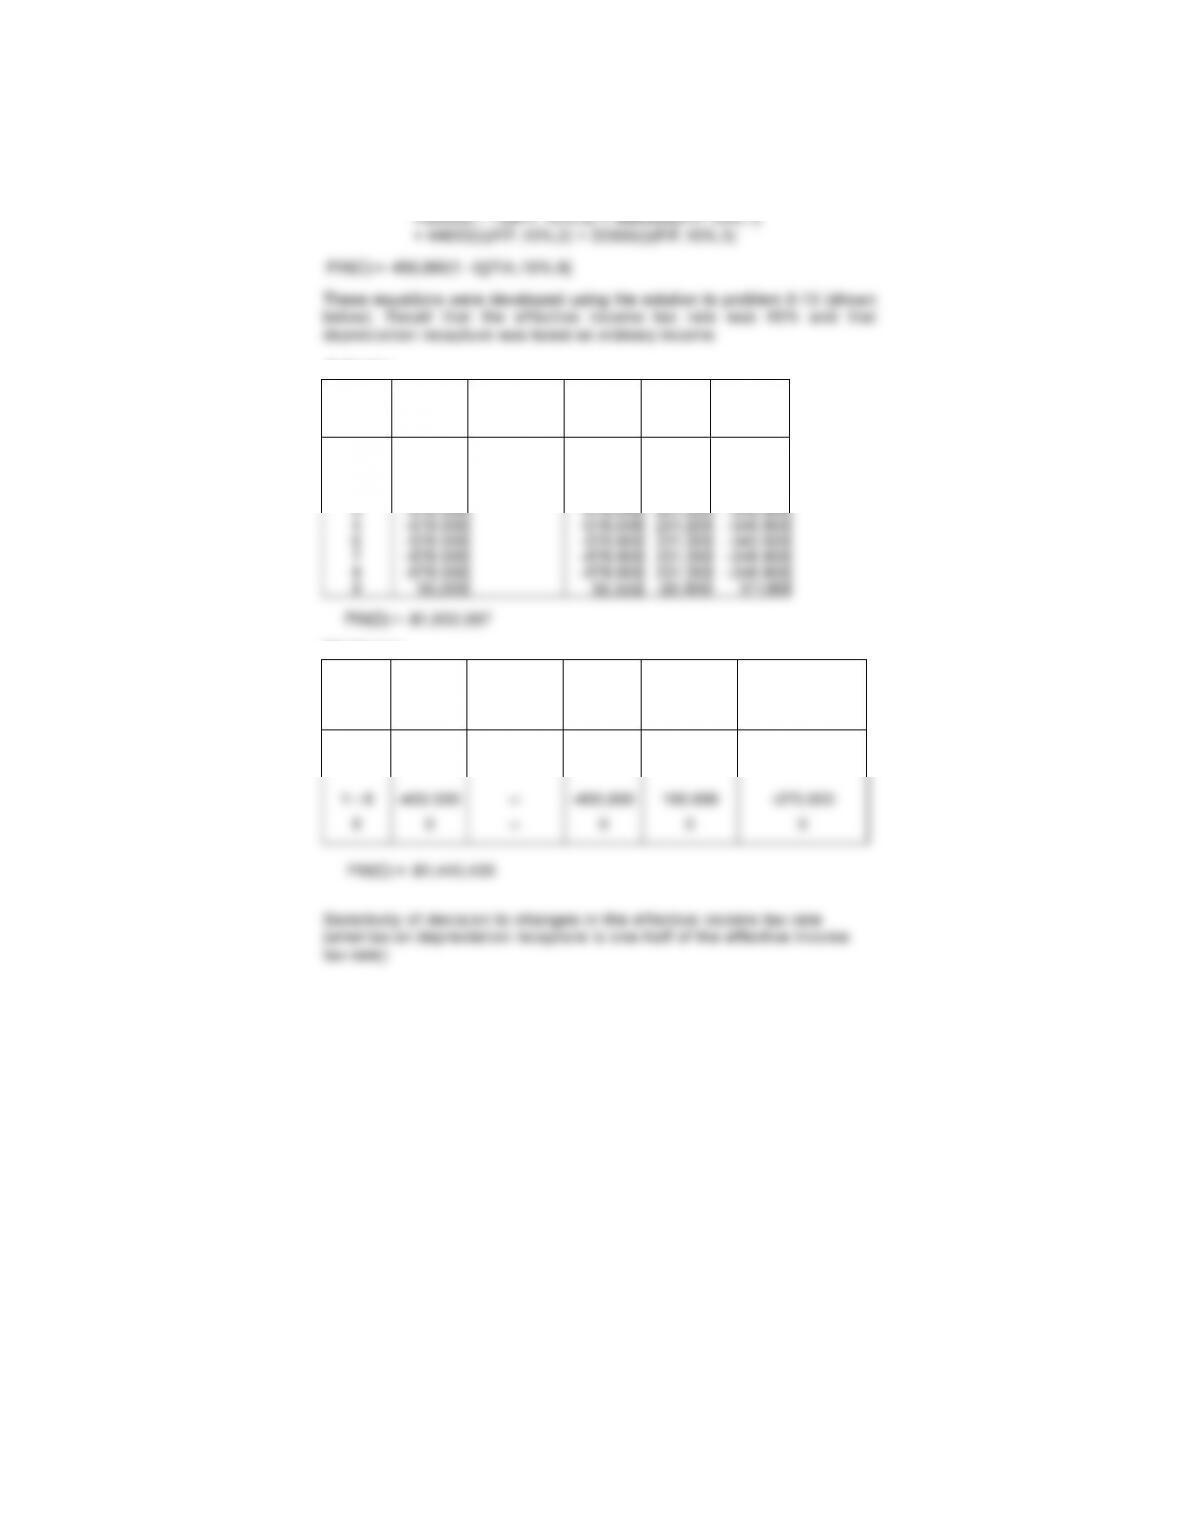
13-18 The following equations represent the present worths of the defender
(D) and the challenger (C) as a function of the effective income tax
rate, t:
PW(0) = –150,000 + 38450(t / 2) – 578,000(1 – t)(P/A,10%,8)
Defender:
Year BTCF
MACRS
Depreciation
Taxable
Income
Cash
Flow
for ATCF
0 -150
,
000 -38
,
450 15
,
380 -134
,
620
1 -578
,
000 44
,
600 -622
,
600 249
,
040 -328
,
960
2 -578
,
000 44
,
650 -622
,
650 249
,
060 -328
,
940
3 -578
,
000 22
,
300 -600
,
300 240
,
120 -337
,
880
,
,
,
,
,
,
,
,
,
,
,
,
,
,
,
,
,
Challenger:
Year BTCF
MACRS
Depreciation
Taxable
Income
Cash Flow
for Income
Taxes ATCF
0 — — — — —
172
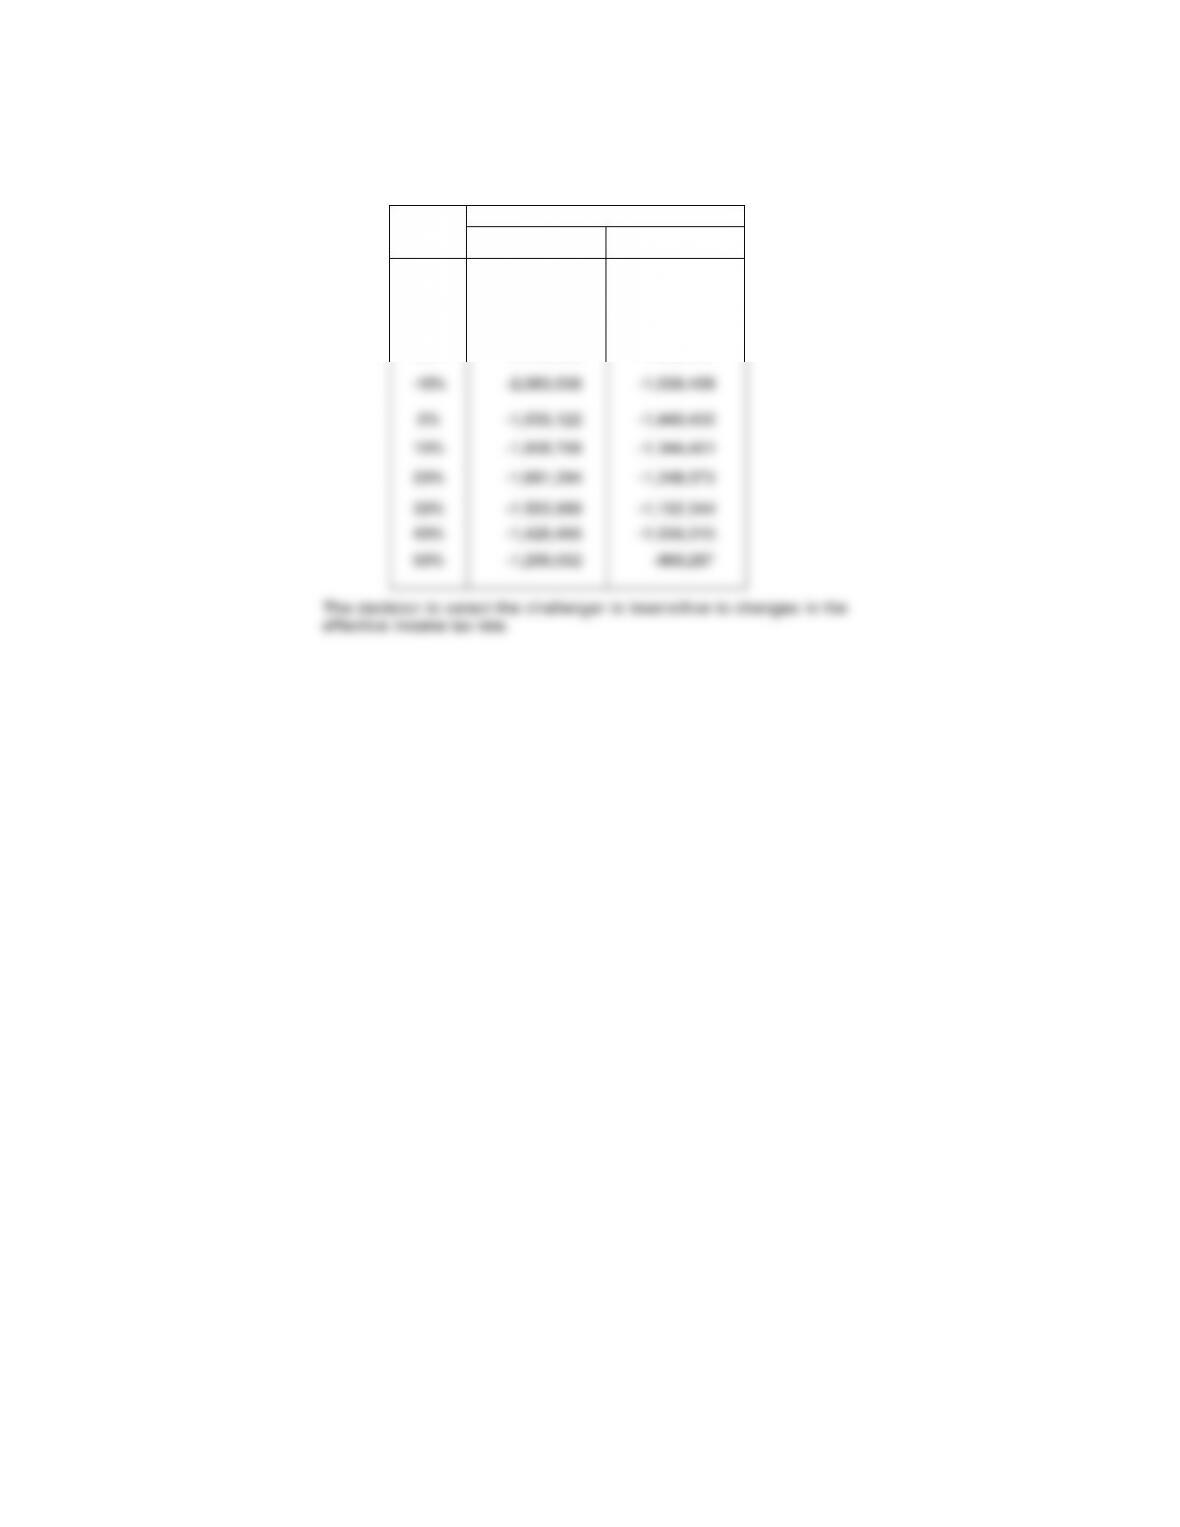
Present Worth
% change Defender Challenger
–50% -2,573,192 -1,920,573
–40% -2,445,778 -1,824,545
–30% -2,318,364 –2,728,516
–20% -2,190,950 –1,632,487
173