Marketing Performance Tools and Application Exercises
8.1 Value-in-Use Pricing: This marketing performance tool is used with Figure 8-6 in addressing items A and
Bbelow.
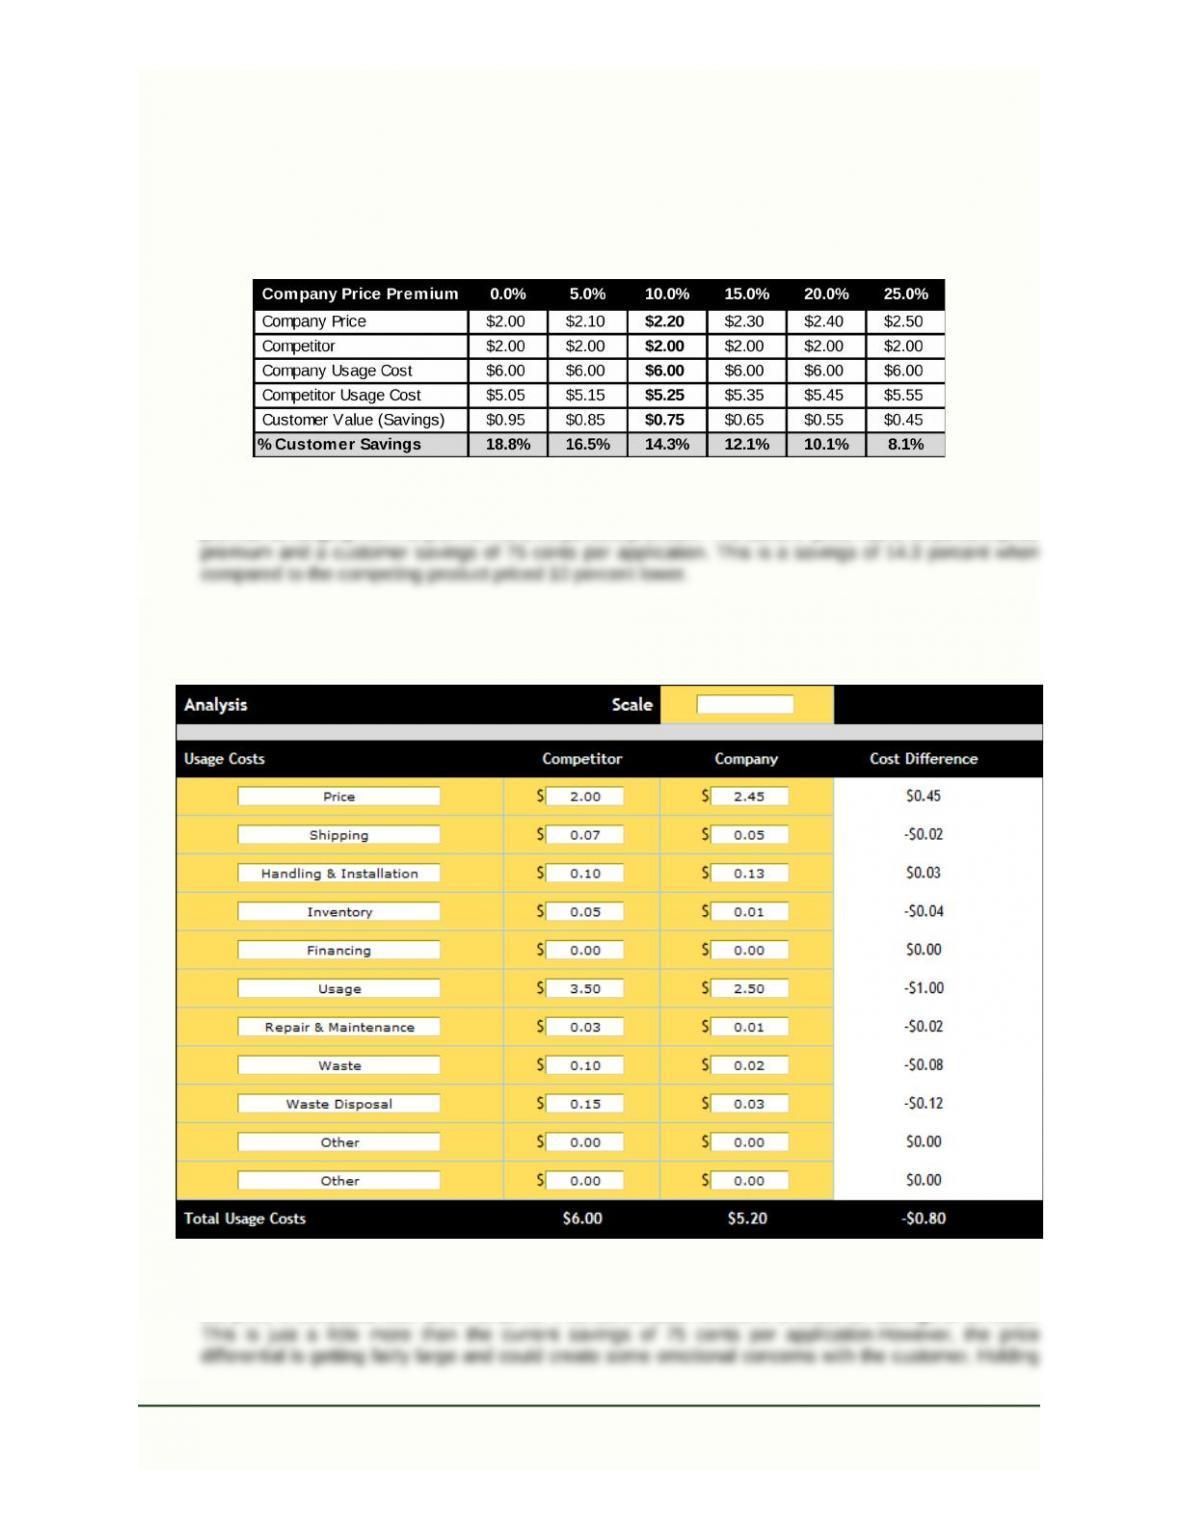
A. The ownership costs for a business’s products that extend the life of machine fluids appear in the first
example. Assess the economic value for several price points and select a price that creates a
meaningful value for customers.
Teaching Note:The table above presents the variance in customer value (savings) for different price
premiums, ranging from no premium to a 25 percent premium. The current price has a 10 percent price
B. In this example, let’s assume that the usage cost for the business’s product is further reduced to $2.50
per pound. How would this affect customer value and the perception of the value price of $2.45?
Teaching Note: In the analysis above, the company’s usage cost is reduced from $2.80 to $2.50 and
the price is increased from $2.20 to $2.45. This combination results in a customer savings of 80 cents.
Market-Based Management Copyright © 2012
Sixth Edition –39– Pearson Education, Inc.
Instructor’s Manual– Chapter 4 Publishing as Prentice Hall
8.2 Perceived-Value Pricing: This marketing performance tool is used with Figures8-8 and 8-9in addressing items A
(below) and B (next page).
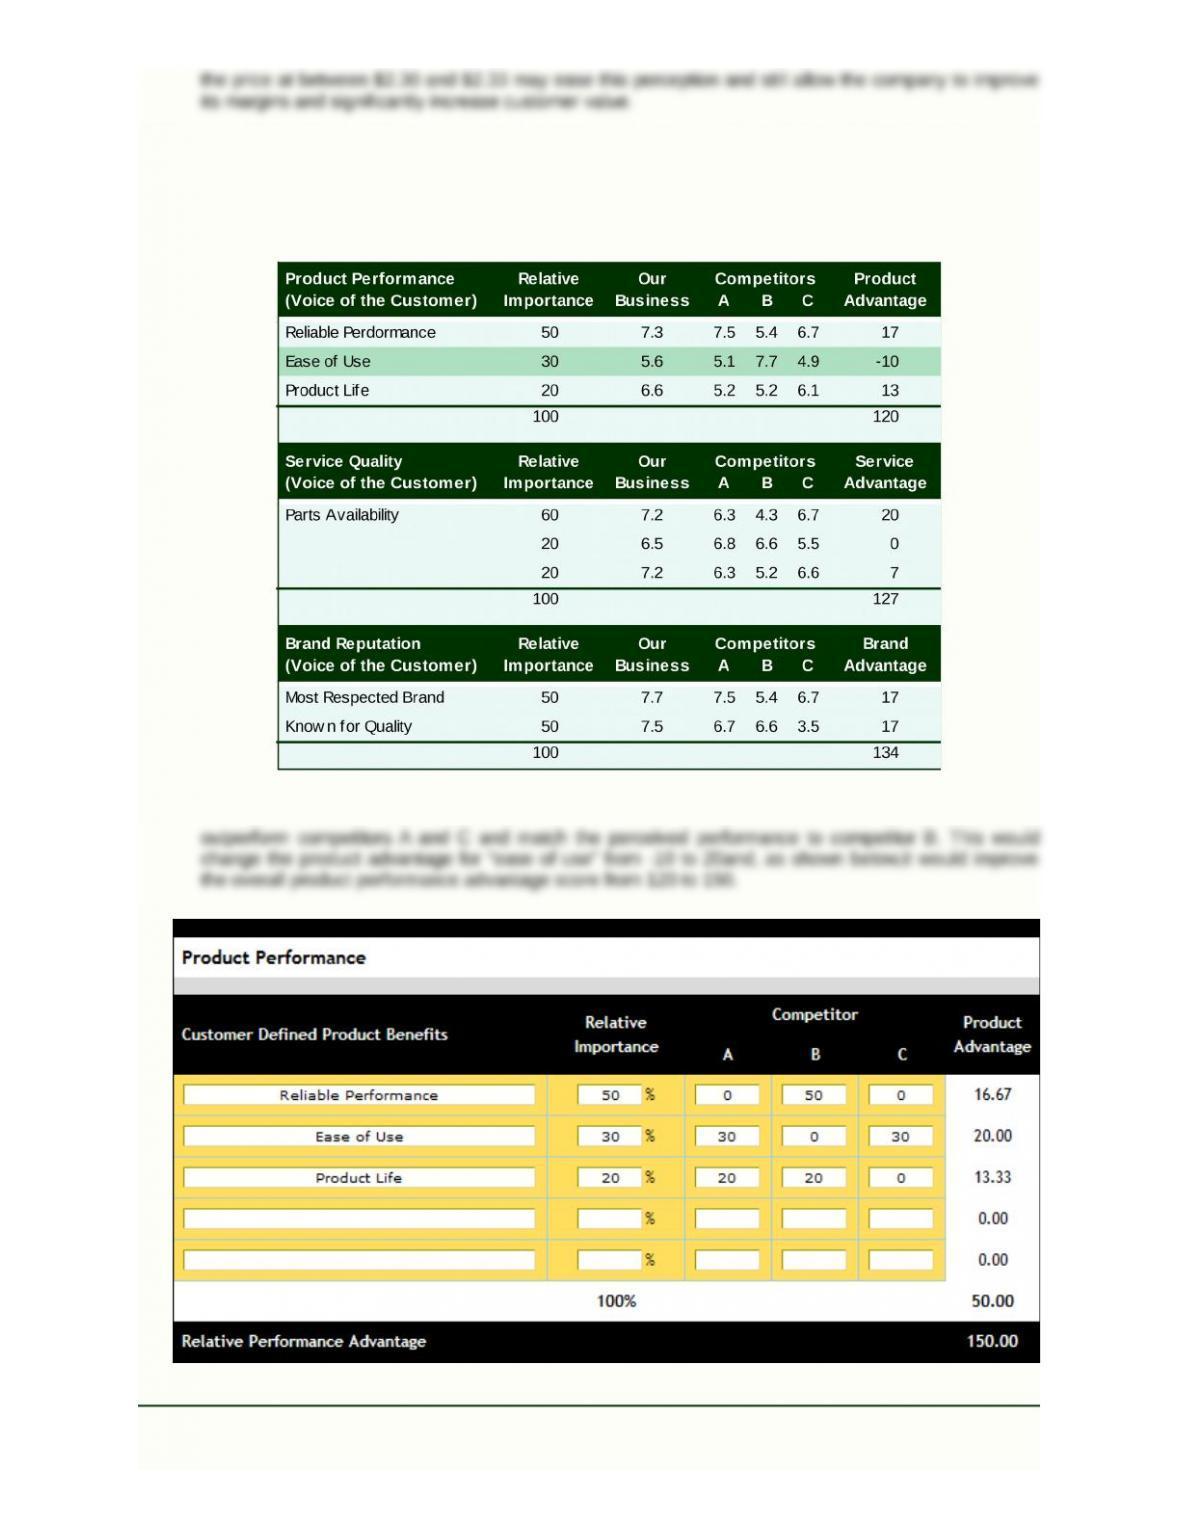
A. Assume the business can improve its ease of use from a 5.6 rating to a 7.5 rating. How would this
change the overall benefits and customer value at the current price of $6,250?
Teaching Note: Improving “ease of use” from a 5.6 rating to 7.5 would allow the company to
Market-Based Management Copyright © 2012
Sixth Edition –40– Pearson Education, Inc.
Instructor’s Manual– Chapter 4 Publishing as Prentice Hall
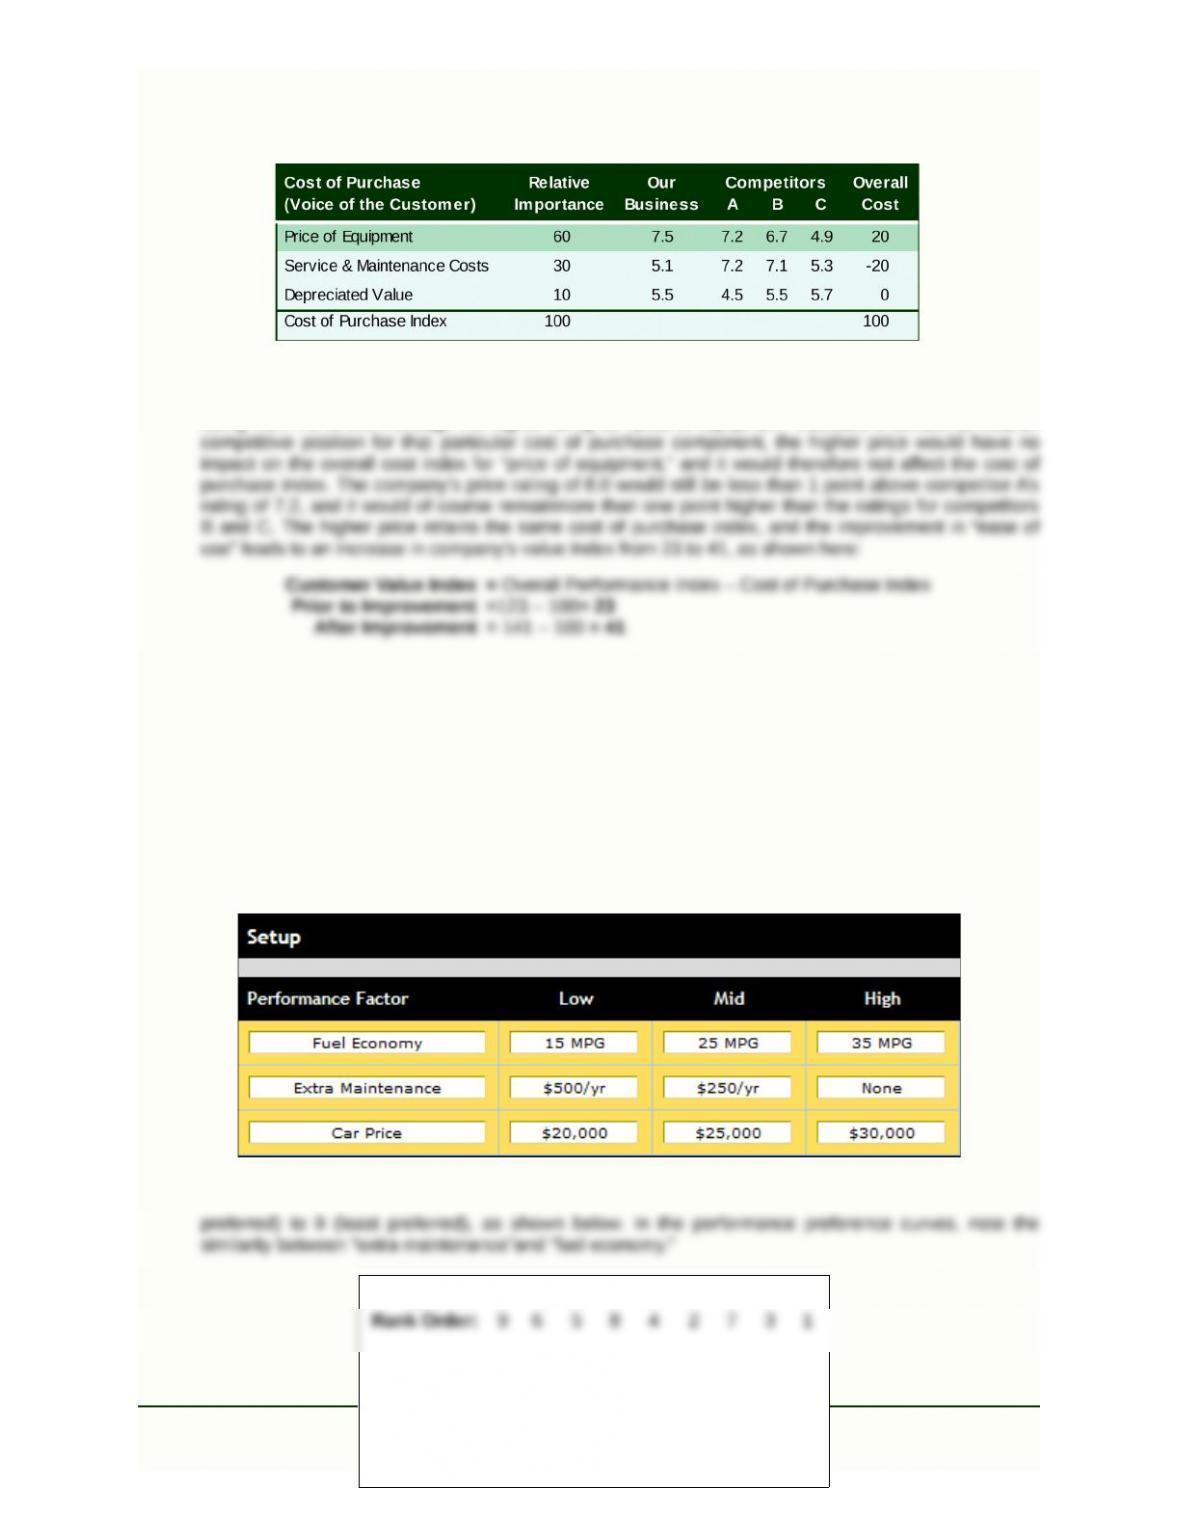
B. With this higher ease-of-use rating, how would the customer value index change if the business raised
its price to $6,500 and the business’s rating on price of equipment increased from 7.5 to 8.0? Would
you recommend this price increase?
Teaching Note:Assume raising the price from $6,250 to $6,500 would increase the perceived price
rating from 7.5 to 8.0. Although the higher rating for “price of equipment” indicates a somewhat weaker
8.3 Performance-Based Value Pricing: This marketing performance tool is used with Figures 8-11and8-12 in
addressing items A (below) and B (next page).
A. Replace the existing data with two car performance factors each with three levels of performance (e.g.,
<20 MPG, 25 MPG, and >30 MPG) and a price factor with three price levels (e.g., $20,000, $25,000
and $30,000). Then rank the nine alternatives from 1 (most preferred) to 9 (least preferred) and
interpret the performance and price curves.
Teaching Note: The setup is shown above. The nine options created were then ranked from 1 (most
Market-Based Management Copyright © 2012
Sixth Edition –41– Pearson Education, Inc.
Instructor’s Manual– Chapter 4 Publishing as Prentice Hall
Options: A B C D E F G H I
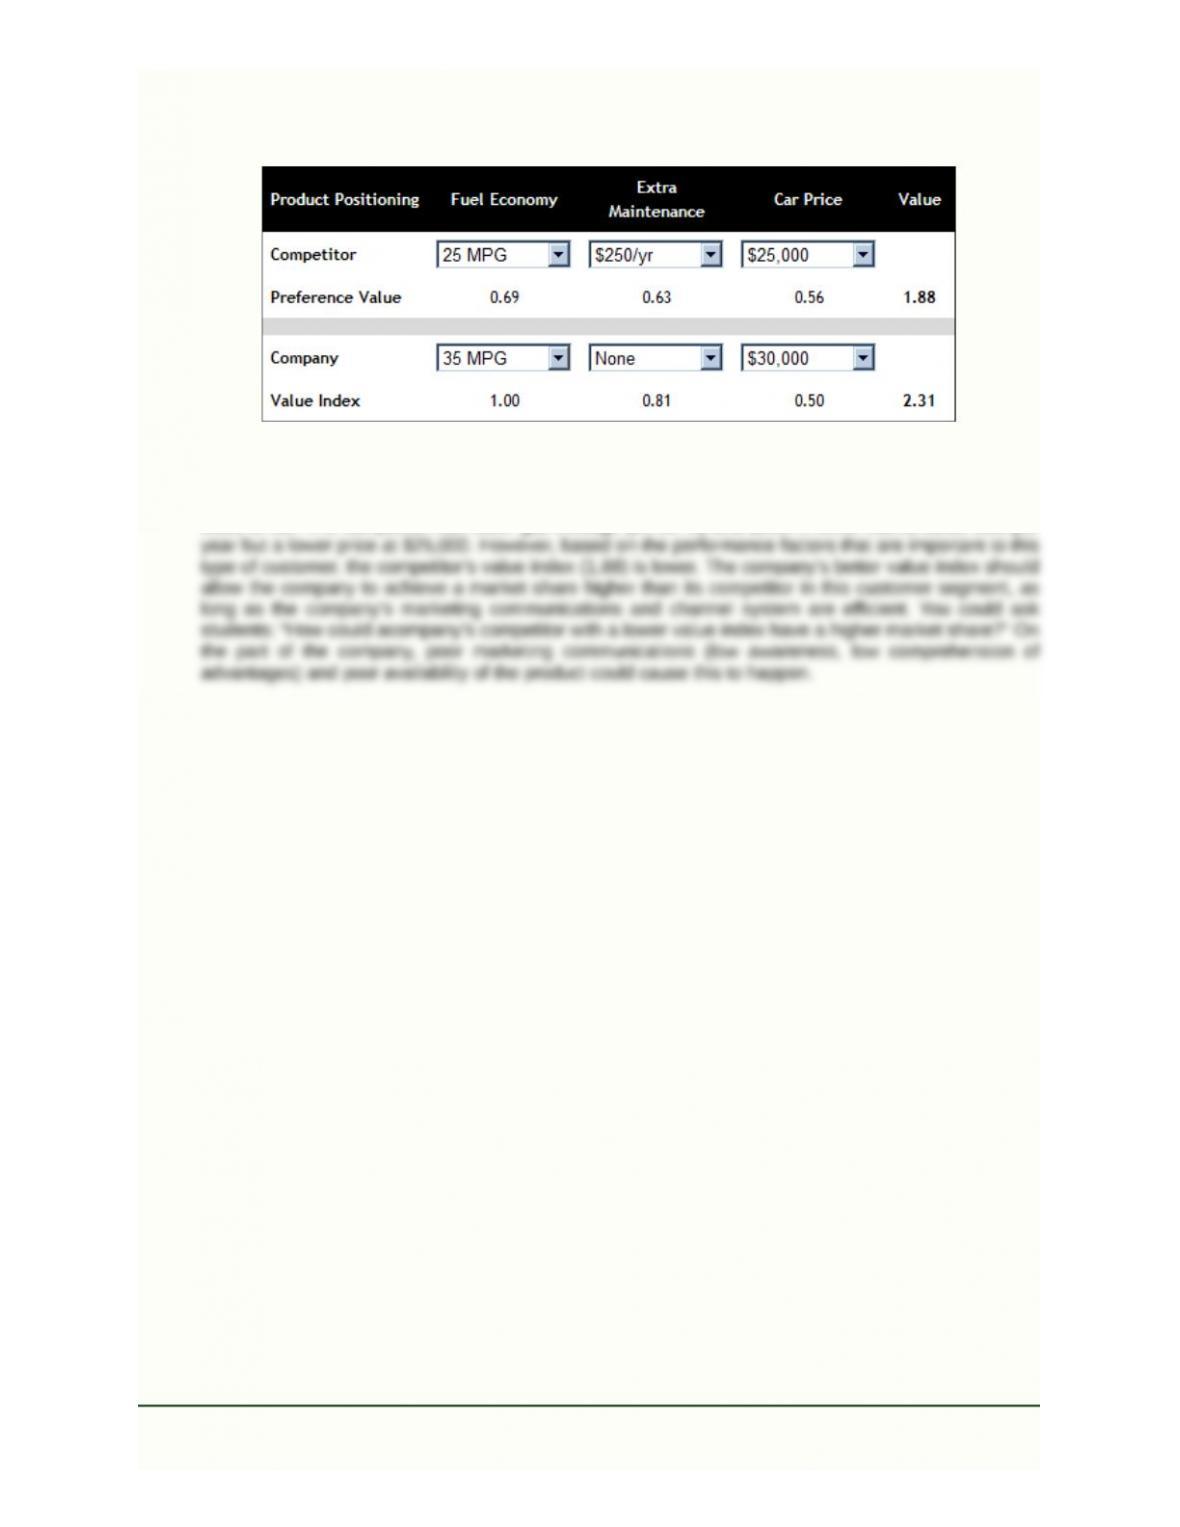
B. Input the product positioning (position on each performance factor and price) for your company auto
and competing auto. Interpret the value index for each automobile and how each might influence
market share.
Teaching Note: Compared to its benchmark competitor, the company has a value index of 2.31 based
on better fuel economy (35 MPG), no extra maintenance cost, and the better price ($30,000) for this
class of car. The competitor had lower gas mileage (25 MPG) and $250 in extra maintenance cost per
8.4 Price-Volume Pricing: This marketing performance tool is used with Figures 8-23 to 8-25 in addressing items A
and B below.
A. The price elasticity for personal computers is estimated to be –2. For the PC manufacturer shown,
evaluate the sales and profit impact of a 10 percent price increase and a 10 percent price decrease.
Market-Based Management Copyright © 2012
Sixth Edition –42– Pearson Education, Inc.
Instructor’s Manual– Chapter 4 Publishing as Prentice Hall
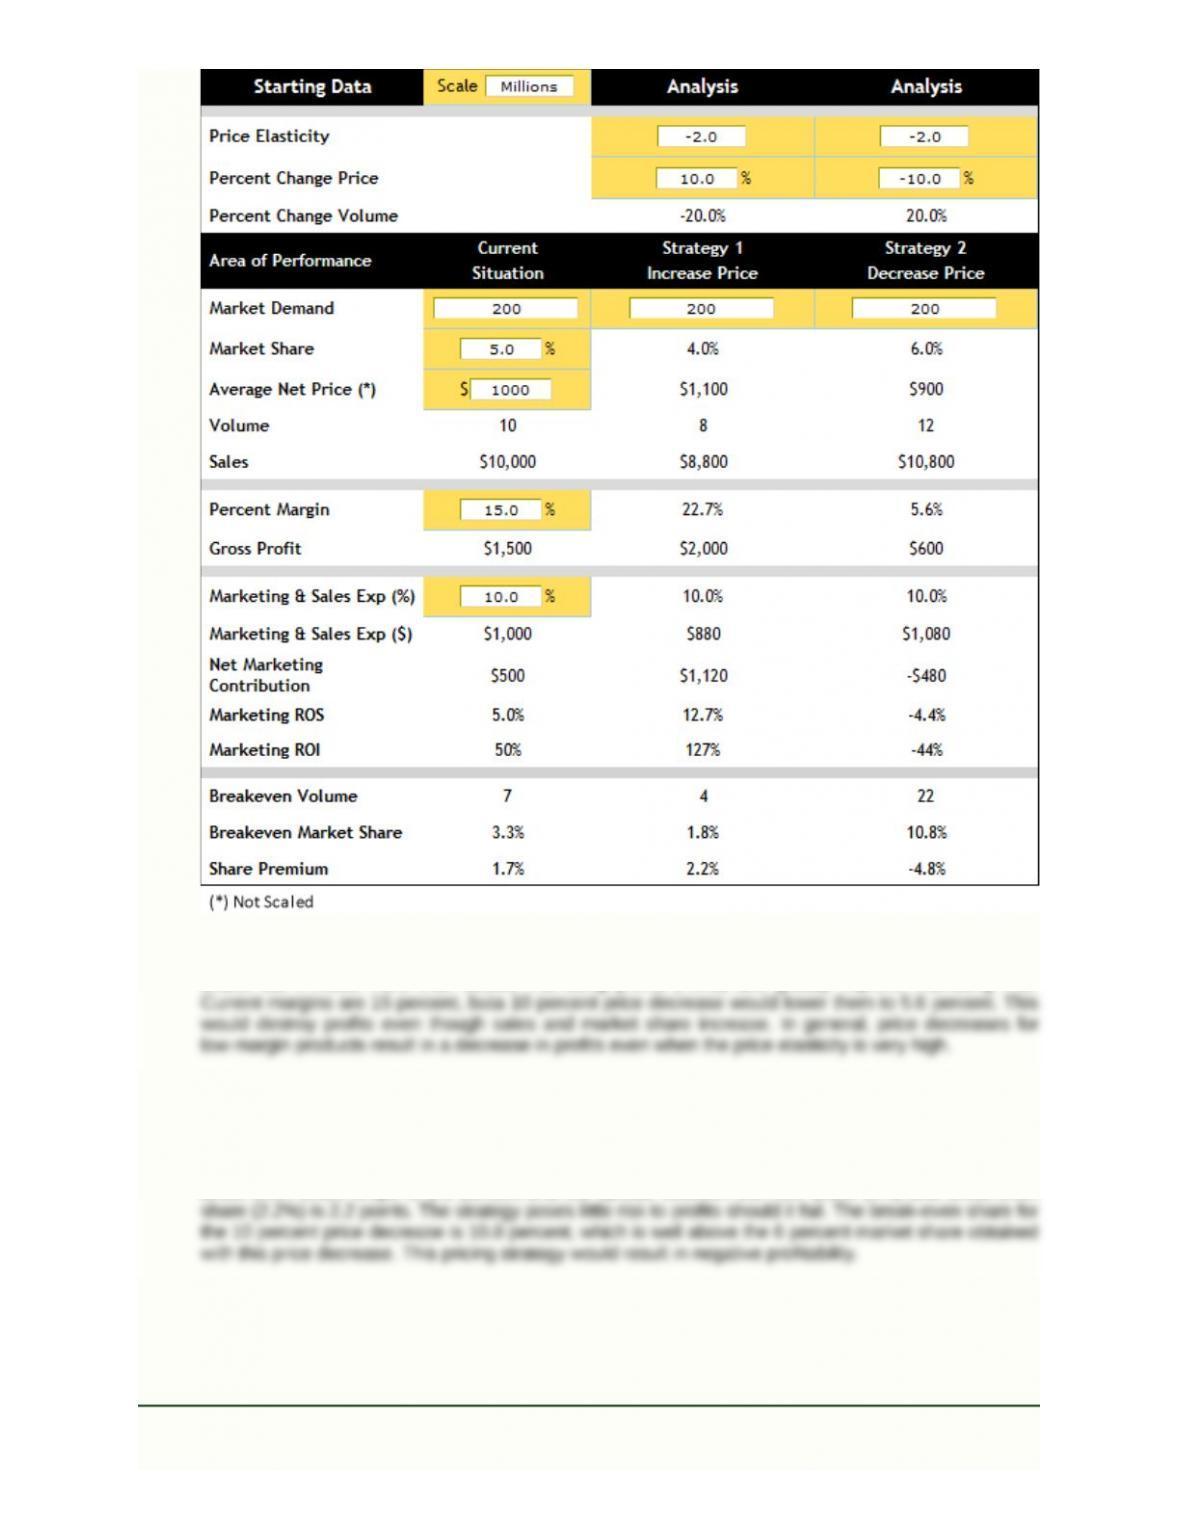
Teaching Note: As shown above,a 10 percent price increase would lower volume, sales, and market
share, but it would more than double marketing profits (NMC) and greatly improve marketing ROI.
B. For each pricing strategy, determine the break-even market share and discuss the profit risk associated
with it.
Teaching Note: The current break-even share is 3.3 percent and the current share is 5 percent.This
means there is ashare cushion of 1.7 points over zero profits. With the 10 percent increase in price,the
break-even share drops to 1.8 percent and the spread between the new share (4%) and break-even
Market-Based Management Copyright © 2012
Sixth Edition –43– Pearson Education, Inc.
Instructor’s Manual– Chapter 4 Publishing as Prentice Hall