
CHAPTER3
Market Potential, Market Demand, and Market Share
You have to see more to sell more.
— Jack Welch
CEO, General Electric Co.,1981–2001
Jack Welch’s comment could be used to open a discussion on the importance of a business having a broad
vision of its market. A narrow market vision slowed Coca-Cola’s entry into several newly emerged markets for
beverages that directly compete with soft drinks. Those businesses that succeed in marketing have better
antennae for sensing new trends and emerging marketing opportunities. Those that lack this quality are in a
follower position, always trying to catch up.
IntroductoryExercise
The following factors describe the U.S. market demand for coffee and the customer demand
needed for a coffee shop to break even:
Americans consume about 2.4 billion pounds of coffee annually. In the U.S., 114 million people consider
themselves coffee drinkers.
The current average consumption per coffee drinker is about 1.5 cups a day, but in 1960 those who
considered themselves coffee drinkers drank three cups a day.
Coffee shop customers spend an average of $3 per visit.
To break even, the average coffee shop must have sales revenues of $6,500 per week.
The average margin is 40 percent.
Using this information, you can discuss market demand by addressing the following questions:
What would the market demand be if coffee drinkers consumed at the same daily rate as they did in 1960?
What are the possible factors contributing to the reduced rate of consumption?
How many customers does a coffeehouse need to break even? (Revenue of $6,500 per week divided by $3
per customer equals 2,167 customers per week.)
Teaching Objectives
Delineate the difference between market demand and market potential, and identify the factors that impact
the rate of market growth.
Introduce the concept of the market development index and how it can be used to assess market growth and
market development opportunities.
Introduce the concept of the share development index and the factors that determine a business’s market
share, and discuss how the SDI helps, along with the market development index, a business to quickly
assess its opportunities for growth.
Harvard Business School Case Materials
Cola Wars Continue: Coke and Pepsi in 2006–2007. HBS Case 9-706-447. This case examines the
industry structure and competitive strategy of Coca-Cola and Pepsi over their 100-year rivalry. New
challenges in 2006 included boosting flagging carbonated soft drink (CSD) sales and finding new revenue
streams. Both companies also began to modify their bottling, pricing, and branding strategies. They looked to
emerging international markets to fuel growth and broaden their portfolios with alternate beverages like tea,
juice drinks, sports drinks, energy drinks, and bottled water. In vying for the “throat share” of the world’s
beverage market, Coke and Pepsi fought their most intense battles over the $66 billion CSD industry in the
United States, where annual per-person CSD consumption is an average of 52 gallons. During a 20-year
“carefully waged competitive struggle” from 1975 to 1995, both companies achieved average annual growth
of around 10 percent, as U.S. and worldwide CSD consumption consistently rose. This cozy situation was
threatened in the late 1990s, however, when U.S. CSD consumption declined slightly before reaching a
plateau. The case considers whether Coke and Pepsi’s era of sustained growth and profitability might be
coming to a close or whether this slowdown would be just a blip in the course of over a century of enviable
performance. 28 pages.
Market-Based Management Copyright © 2012
Sixth Edition –11– Pearson Education, Inc.
Instructor’s Manual– Chapter 2 Publishing as Prentice Hall
Taco Bell (1994).HBS Case 9-694-076. Taco Bell’s CEO John Martin boldly proclaims a growth goal of
200,000 points of access by the year 2000 (the company had approximately 3,600 in 1991). To realize such
dramatic growth, Martin embraces a philosophy of continual change. The implications for Taco Bell are
extensive changes in organizational structure, culture, human resources, technology, and communications.
In redefining its market and “thinking outside the box” in all aspects of its business, Taco Bell hopes to
become a “super brand”―transcending not only categories, but industries as well.
NTT DoCoMo: Marketing I-mode.HBS Case 9-502-031. I-mode is a wireless Internet service offered by
Japan NTT DoCoMo. Just 3 years into the product life cycle, the company has 30 million customers and a 60
percent share of Japan’s mobile Internet market. This case looks at a successful launch of a new product
and the factors that contributed to its rapid adoption. The case offers a good way to talk about product life
cycles and why they progress at different rates. 25 pages.
MSA: The Software Company–Planning the AMAP Product Line.HBS Case 9-590-069. MSA has
commissioned a major market research study to assess demand potential for a computer software system
designed for aerospace and defense contractors. Students must evaluate the results of the study (including
conjoint analysis) to assess whether MSA should invest in R&D to upgrade the technology or build a sales
organization. Teaching Note: 5-592-102.
Market Analysis.HBS Case 9-576-056. This reading provides students with a basic understanding of
conducting a demand analysis, defining a market, and projecting a product life cycle.
Market-Based Strategic Thinking
1. How does a product-focused market definition differ from a strategic market definition for a
company like Coca-Cola?
A product-focused market definition is narrowly defined around products, not customer needs. A strategic
market definition is much broader. It enables a business like Coca-Cola to see the market in terms of
2. How would a strategic market definition help a company like Nike?
The benefits of a strategic market definition include: (1) a market definition built around customer needs,
(2) a much broader picture of current and potential customers, and (3) a better understanding of the forces
3. Why is Facebook’s market vision an important element of the market demand Facebook creates?
Market vision is the ability to see beyond current customers and products to a broader range of unserved
customers and unarticulated customer needs, as illustrated in Figure 3-6. Each year Facebook is able to
4. Why is it important for Pampers to understand the market potential for disposable diapers?
We cannot know the growth potential of a market without knowing the maximum market potential. The
growth rate of a market is restricted by its current products, prices, and forms of distribution and
Market-Based Management Copyright © 2012
Sixth Edition –12– Pearson Education, Inc.
Instructor’s Manual– Chapter 2 Publishing as Prentice Hall
Average usage is 2.5 years;
There are 387 million worldwide younger than 2.5 years;
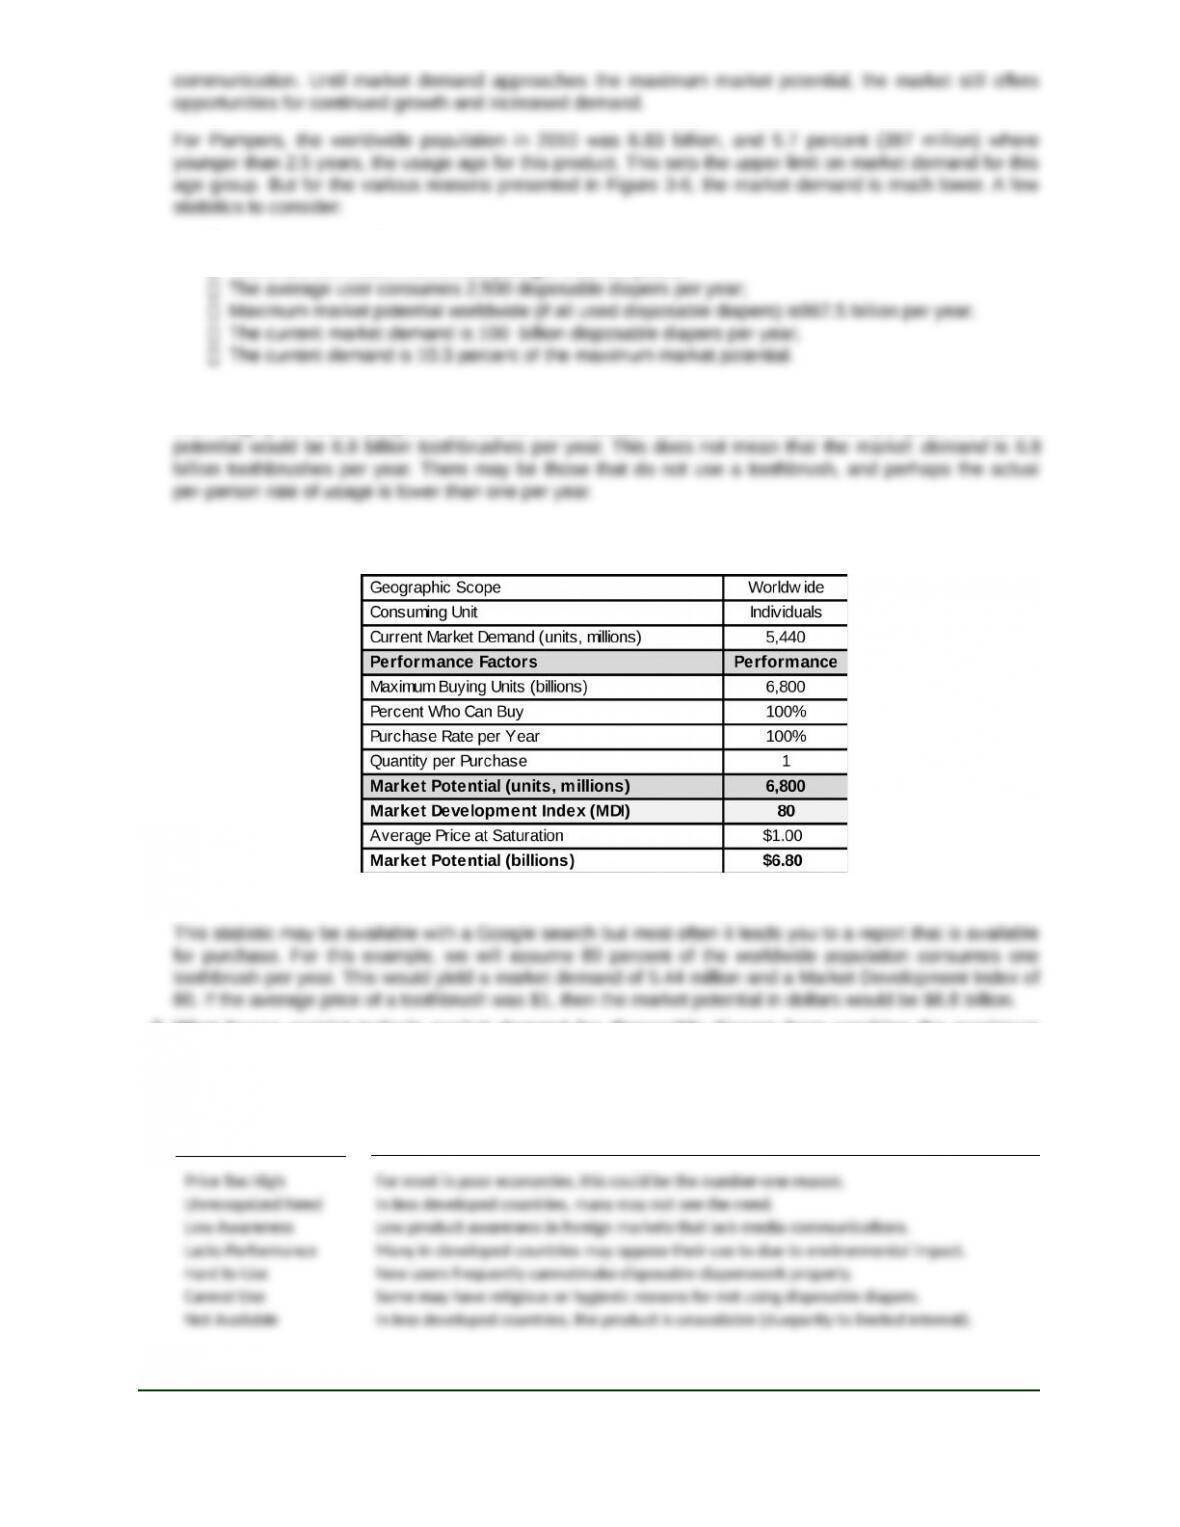
5. How would you estimate the worldwide market potential for toothbrushes?
With roughly 6.8 billion people in the world, if each person consumed one toothbrush per year, the market
6. What would be your estimate of the MDI for toothbrushes?
7. What forces restrict today’s market demand for disposable diapers from reaching the maximum
market demand?
Shown here are the factors that restrict market development, as presented in Figure 3-6, along with
comments for each with respect to how that factor may act to limit worldwide usage of disposable diapers.
Inuencing Factor Impact on Usage of Disposable Diapers
Market-Based Management Copyright © 2012
Sixth Edition –13– Pearson Education, Inc.
Instructor’s Manual– Chapter 2 Publishing as Prentice Hall
8. What factors help accelerate market growth and market demand for Apple’s iPad? How could Apple
influence these factors to further accelerate market growth?
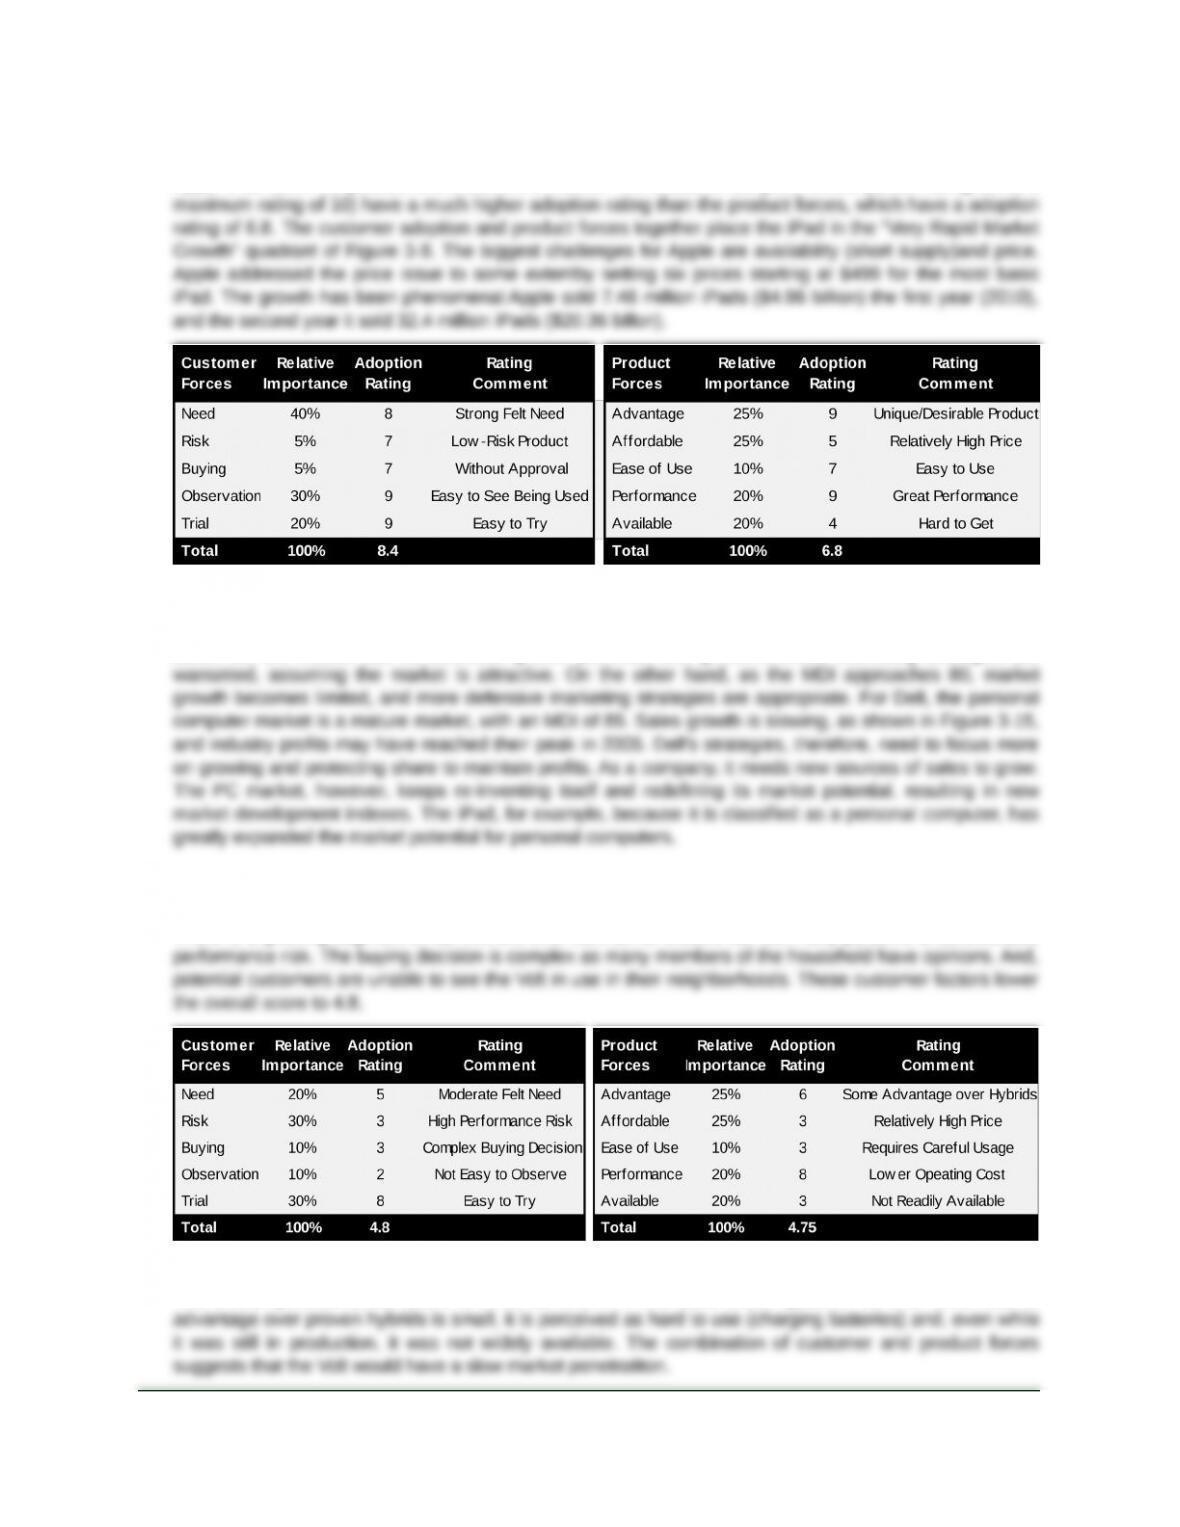
Two fundamental forces slow or accelerate market demand: customer adoption forces and product
adoption forces, as presented in Figure 3-7. The table here presents an assessment of these forces for the
Apple iPad when the product first entered the market. The customer adoption forces (an 8.4 rating out of a
9. How does anMDI help Dell forecast its sales of personal computers?
The market development index is the ratio of current market demand to market potential. When the index is
below 50, the market has considerable growth potential, and growth-oriented marketing strategies are
10. How do customer adoption forces accelerate or impede market penetration of electric cars like
GM’s Volt?
There is a growing segment of car owners who want an all electric car but many perceive a considerable
11. How do product adoption forces accelerate or impede market penetration of electric cars like the Volt?
The overall product forces score is 4.75, as shown in the table under question 10.The Volt’s relative
Market-Based Management Copyright © 2012
Sixth Edition –14– Pearson Education, Inc.
Instructor’s Manual– Chapter 2 Publishing as Prentice Hall
12. How could Apple accelerate the rate of market penetration for iPads?
example, could offer trial demos at high schools, college bookstores, and at kiosks in airports.
13. Why do iPod’s sales volumes, prices, and margins vary over the product life cycle?
During the introductory stage of the product life cycle, prices are typically high and volumes are low due to
limited production. Margins are often very high to help pay for the high marketing and sales expenses
14. Referring to Figure 3-10, why would the net marketing contribution be negative in the introductory
stage for GM’s Volt car?
Volume sold is low in the introductory stage when many potential customers are still evaluating the newly
introduced car. The resulting low level of sales typically would not cover the high cost of marketing and
15. Why would the NMC for a personal computer peak during the late growth stage of the product life
cycle?
At the late growth stage of the PC product life cycle, the optimal combination of volume, margin, and
marketing and sales expenses is achieved. Prior to this point, lower PC volumes yield a lower net
16. What share performance metrics underlie the market share performance of Apple’s Mac computer?
Market-Based Management Copyright © 2012
Sixth Edition –15– Pearson Education, Inc.
Instructor’s Manual– Chapter 2 Publishing as Prentice Hall
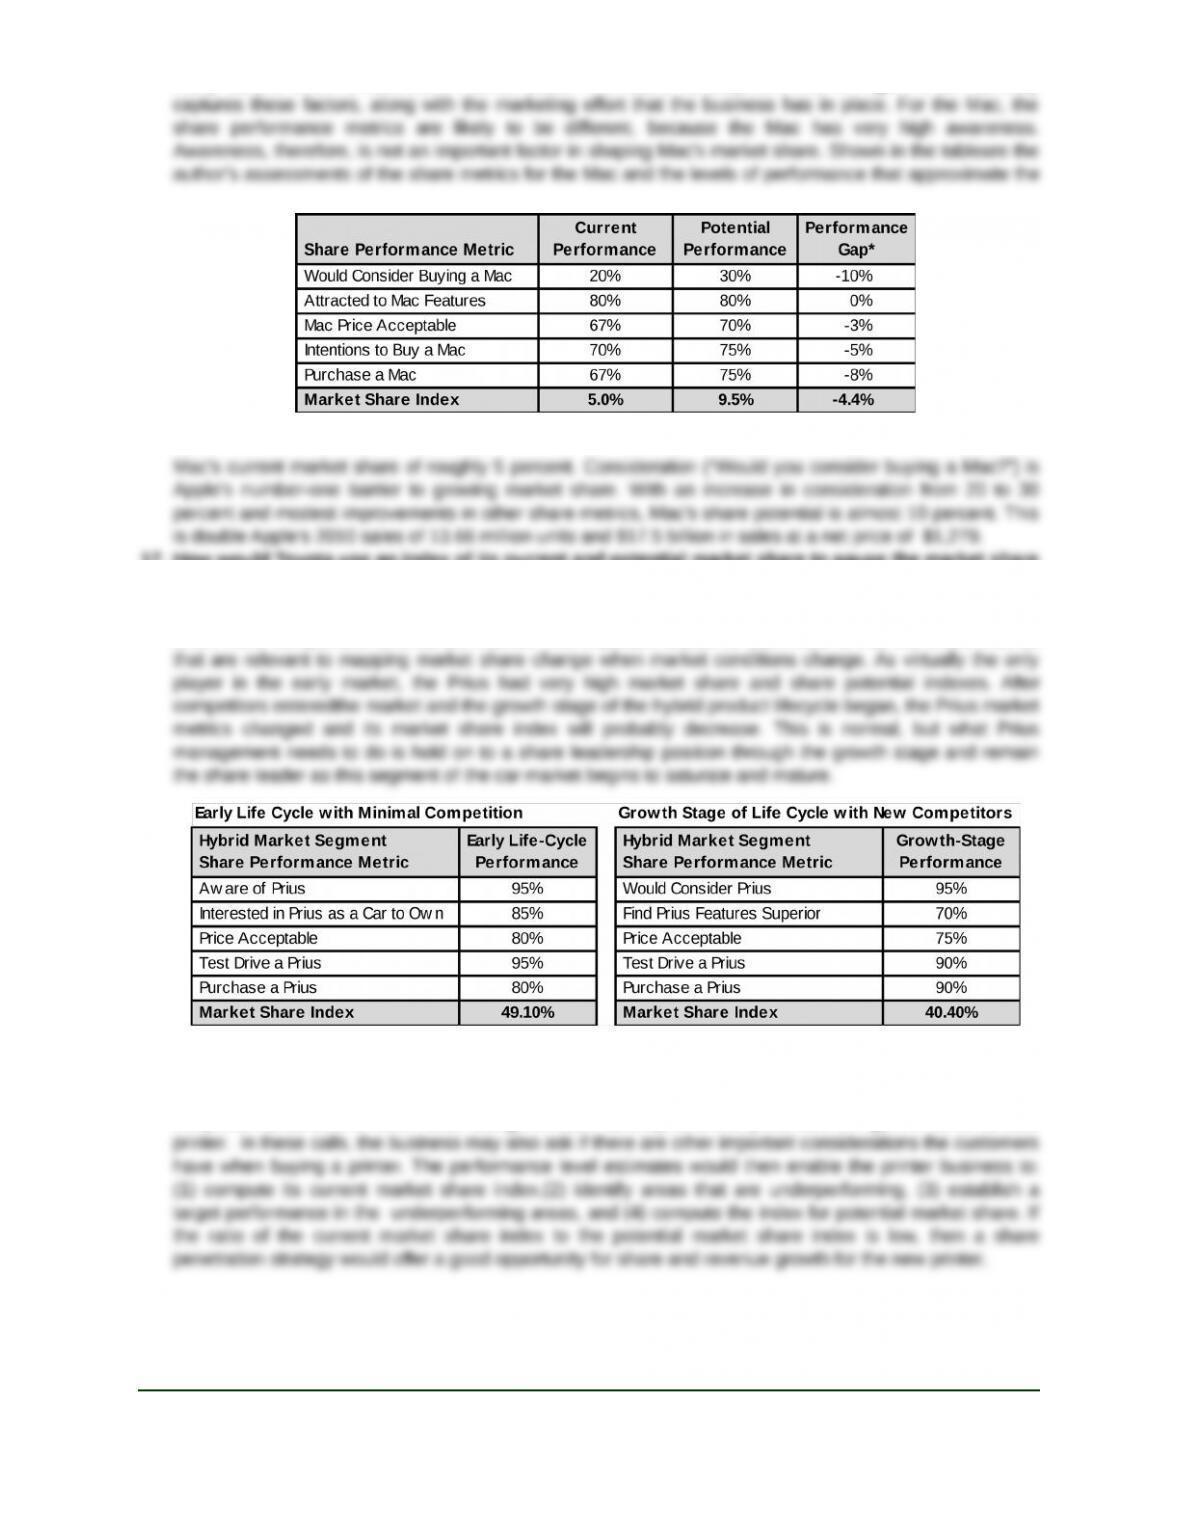
Many factors affect a business’s market share. The share development tree in Figure 3-16 indirectly
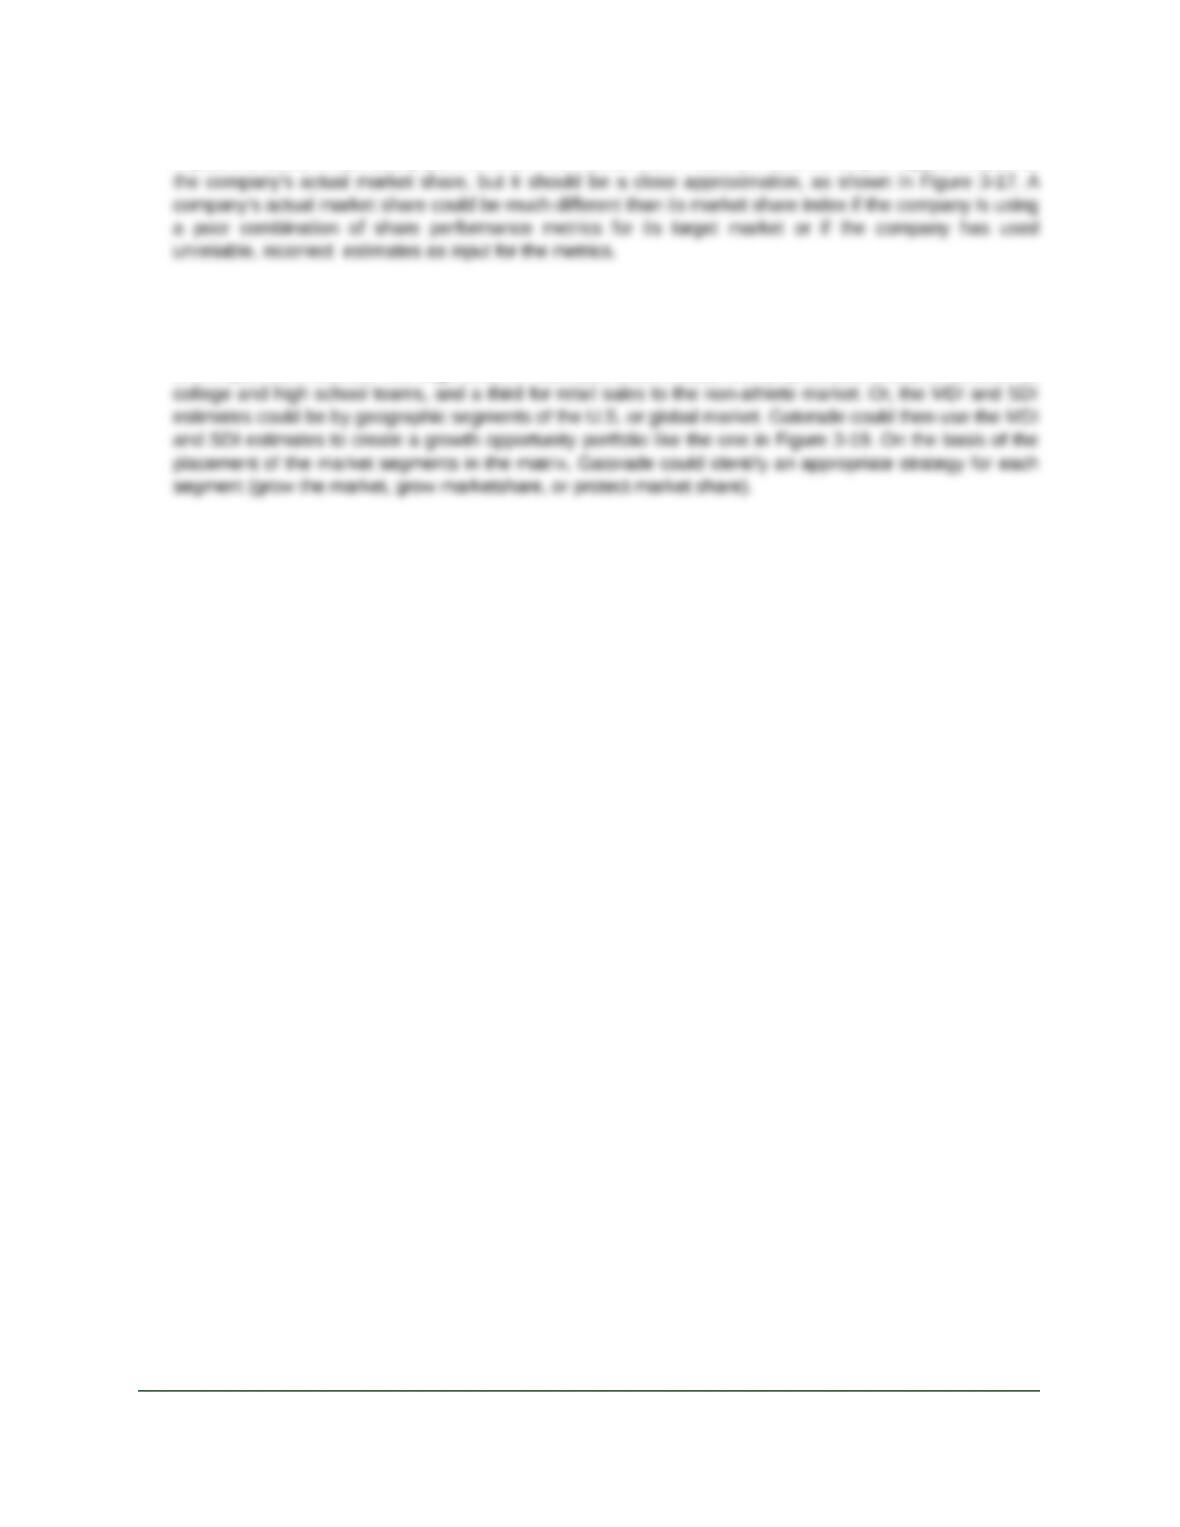
17. How would Toyota use an index of its current and potential market share to gauge the market share
growth of the Prius?
The Toyota Prius dominated the hybrid car segment in the U.S. market with a 50 percent share until 2009
when more competitors entered the market. The important lesson to learn here is that the share metrics
18. What are the advantages of computing a market share index for a new printer?
A business could sample target market customers with a telephone survey, using the findings to estimate
the performance level of each factor along the share development tree presented in Figure 3-16 for its new
Market-Based Management Copyright © 2012
Sixth Edition –16– Pearson Education, Inc.
Instructor’s Manual– Chapter 2 Publishing as Prentice Hall
19. Why would Netflix’s actual market share be different from its market share index for a given target
market?
There are a variety of market forces (e.g., customers, competitors, distributors, and environment) that can
impact the actual share at any point in time. The market share index for Netflix is only an approximation of
20. How could a matrix combining the MDI and SDI be used to develop international marketing strategy
for Gatorade?
Gatorade could estimate its marketdevelopment index and share development index for different segments
of the sport drink market. The segments, for example, could include one for professional teams, another for
Market-Based Management Copyright © 2012
Sixth Edition –17– Pearson Education, Inc.
Instructor’s Manual– Chapter 2 Publishing as Prentice Hall