Marketing Performance Tools and Application Exercises
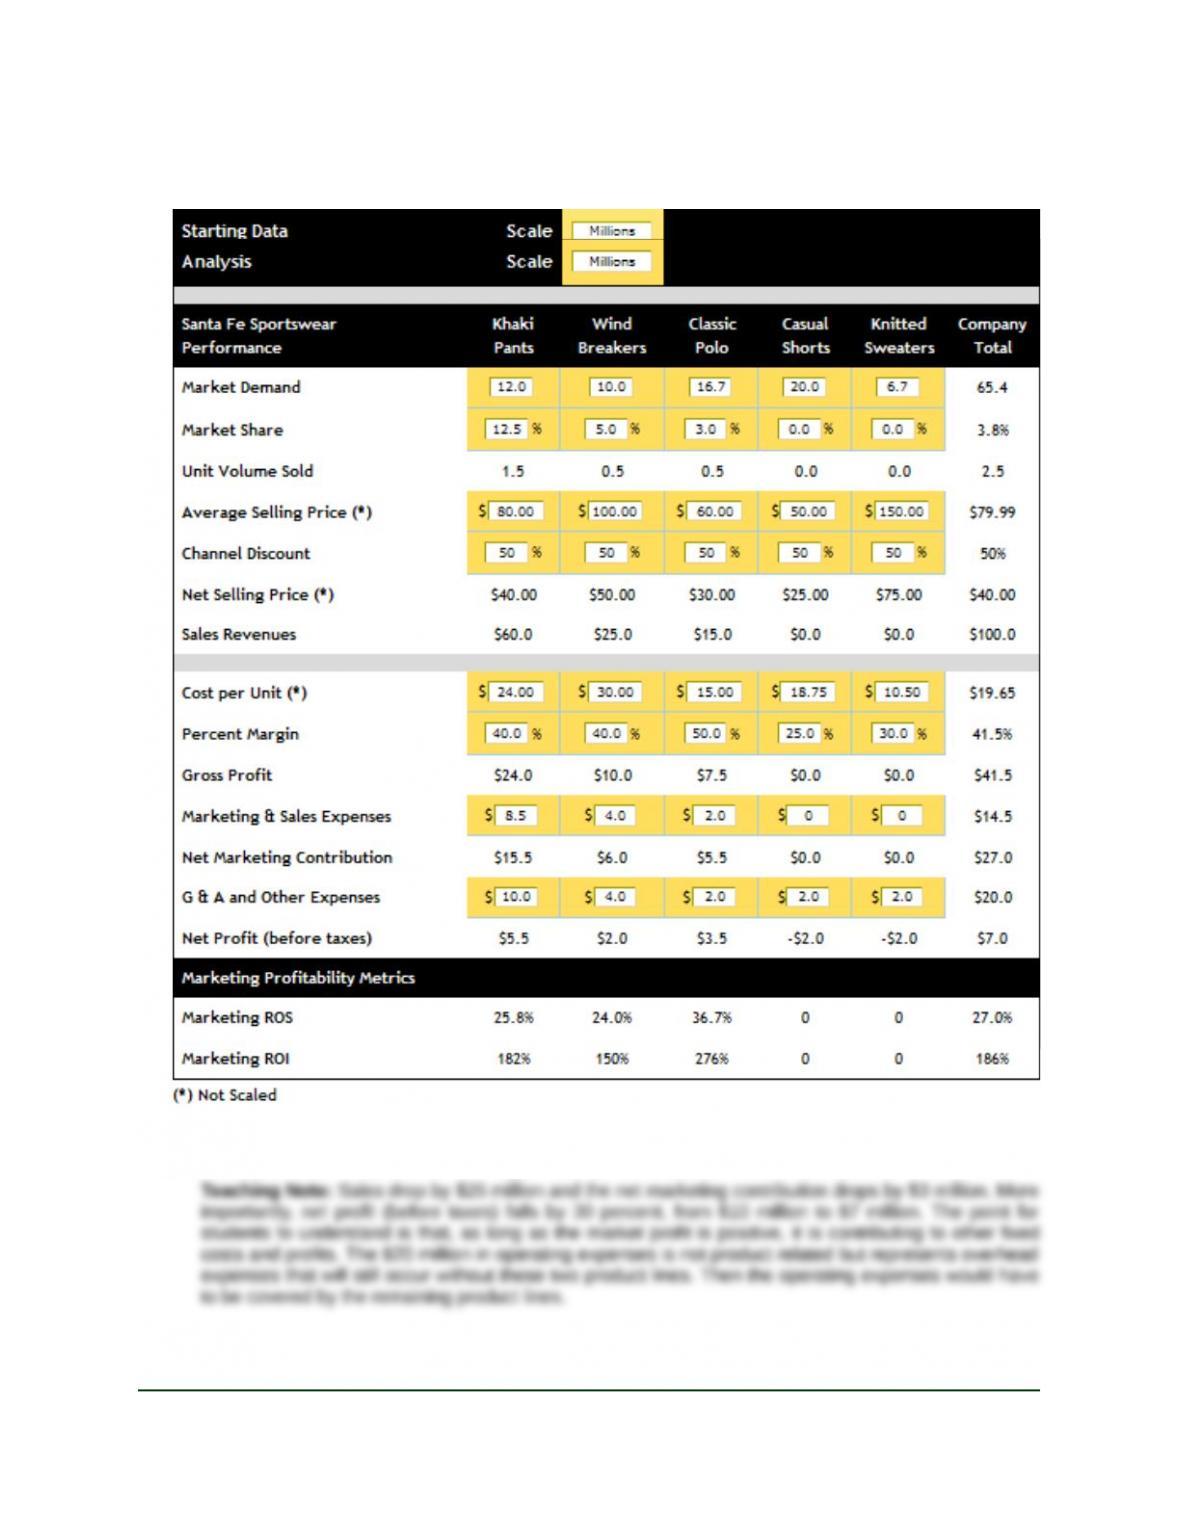
2.1 Company-Level Net Marketing Contribution: Figure 2-15 is used with this marketing performance tool to
address analysis items A (next page) and B (page 19). The starting data are shown here to make
comparisons with the analysis items easy.
A. Evaluate the profit impact of eliminating the casual shorts and knitted sweaters product lines.
Market-Based Management Copyright © 2012
Sixth Edition –11– Pearson Education, Inc.
Instructor’s Manual– Chapter 2 Publishing as Prentice Hall
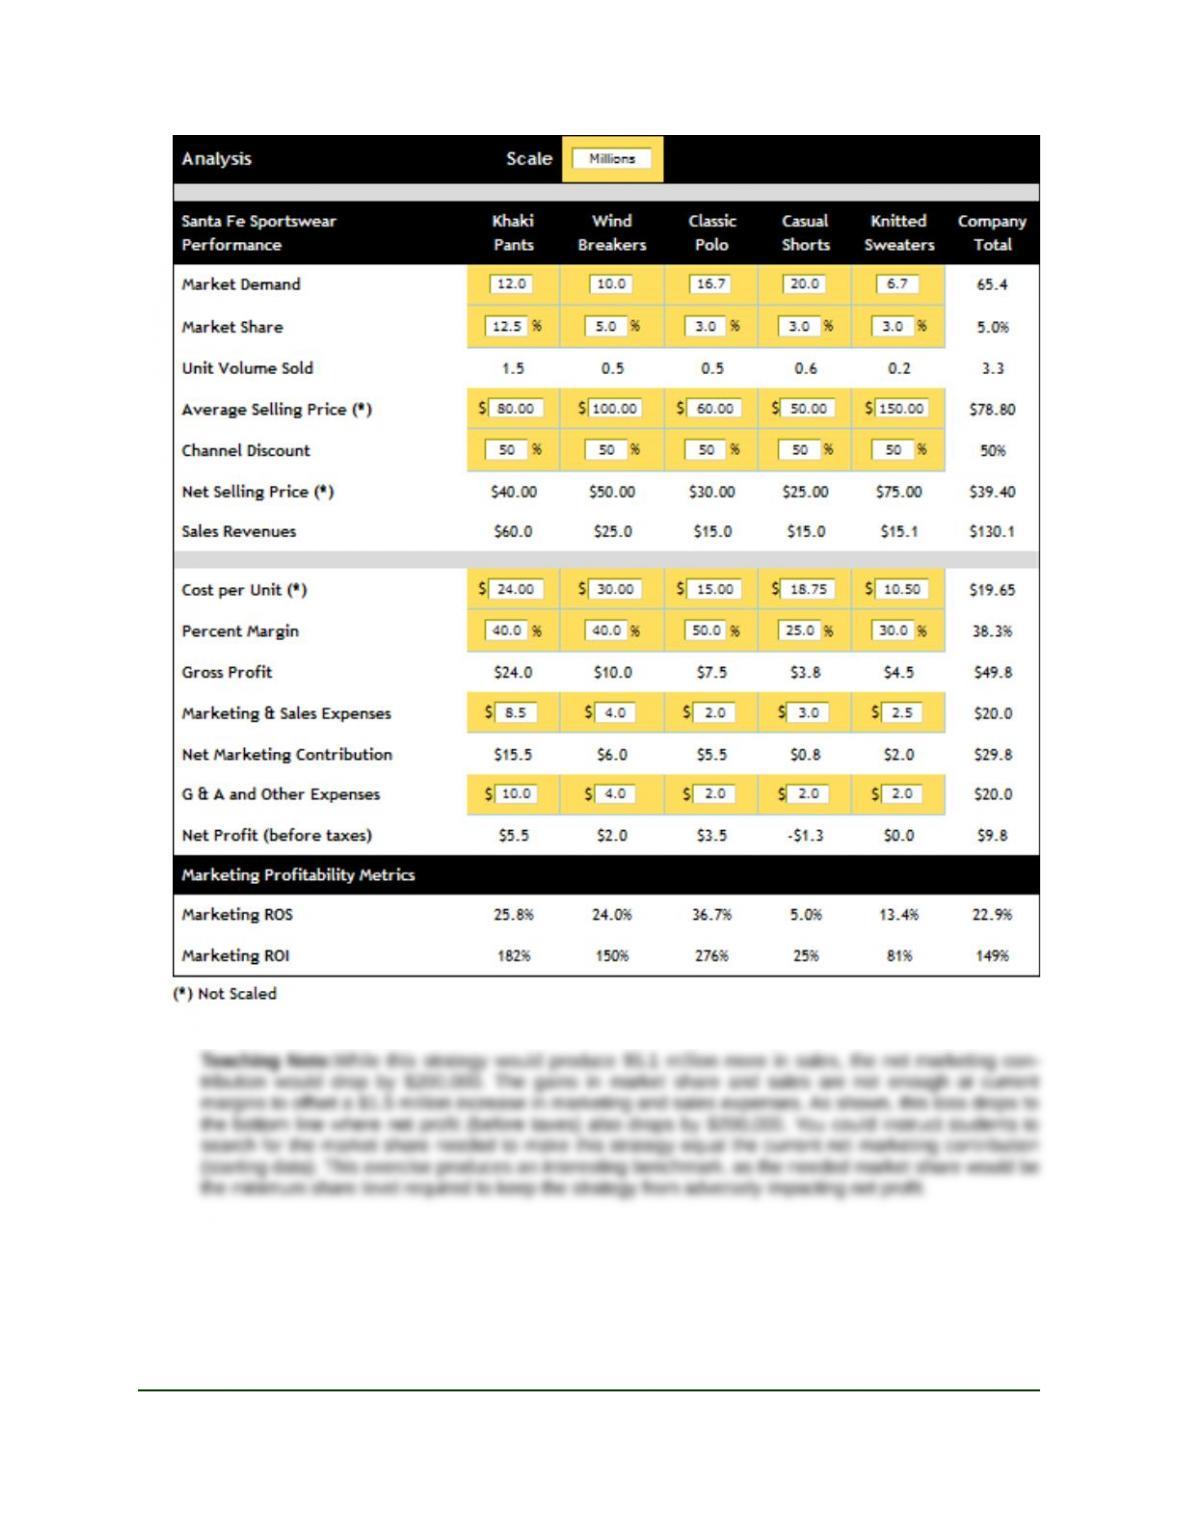
B. What would be the profit impact of increasing market share from 2 to 3 percent for the casual shorts
product line if marketing and sales expenses were doubled ($1.5 million to $3 million)?
Market-Based Management Copyright © 2012
Sixth Edition –12– Pearson Education, Inc.
Instructor’s Manual– Chapter 2 Publishing as Prentice Hall
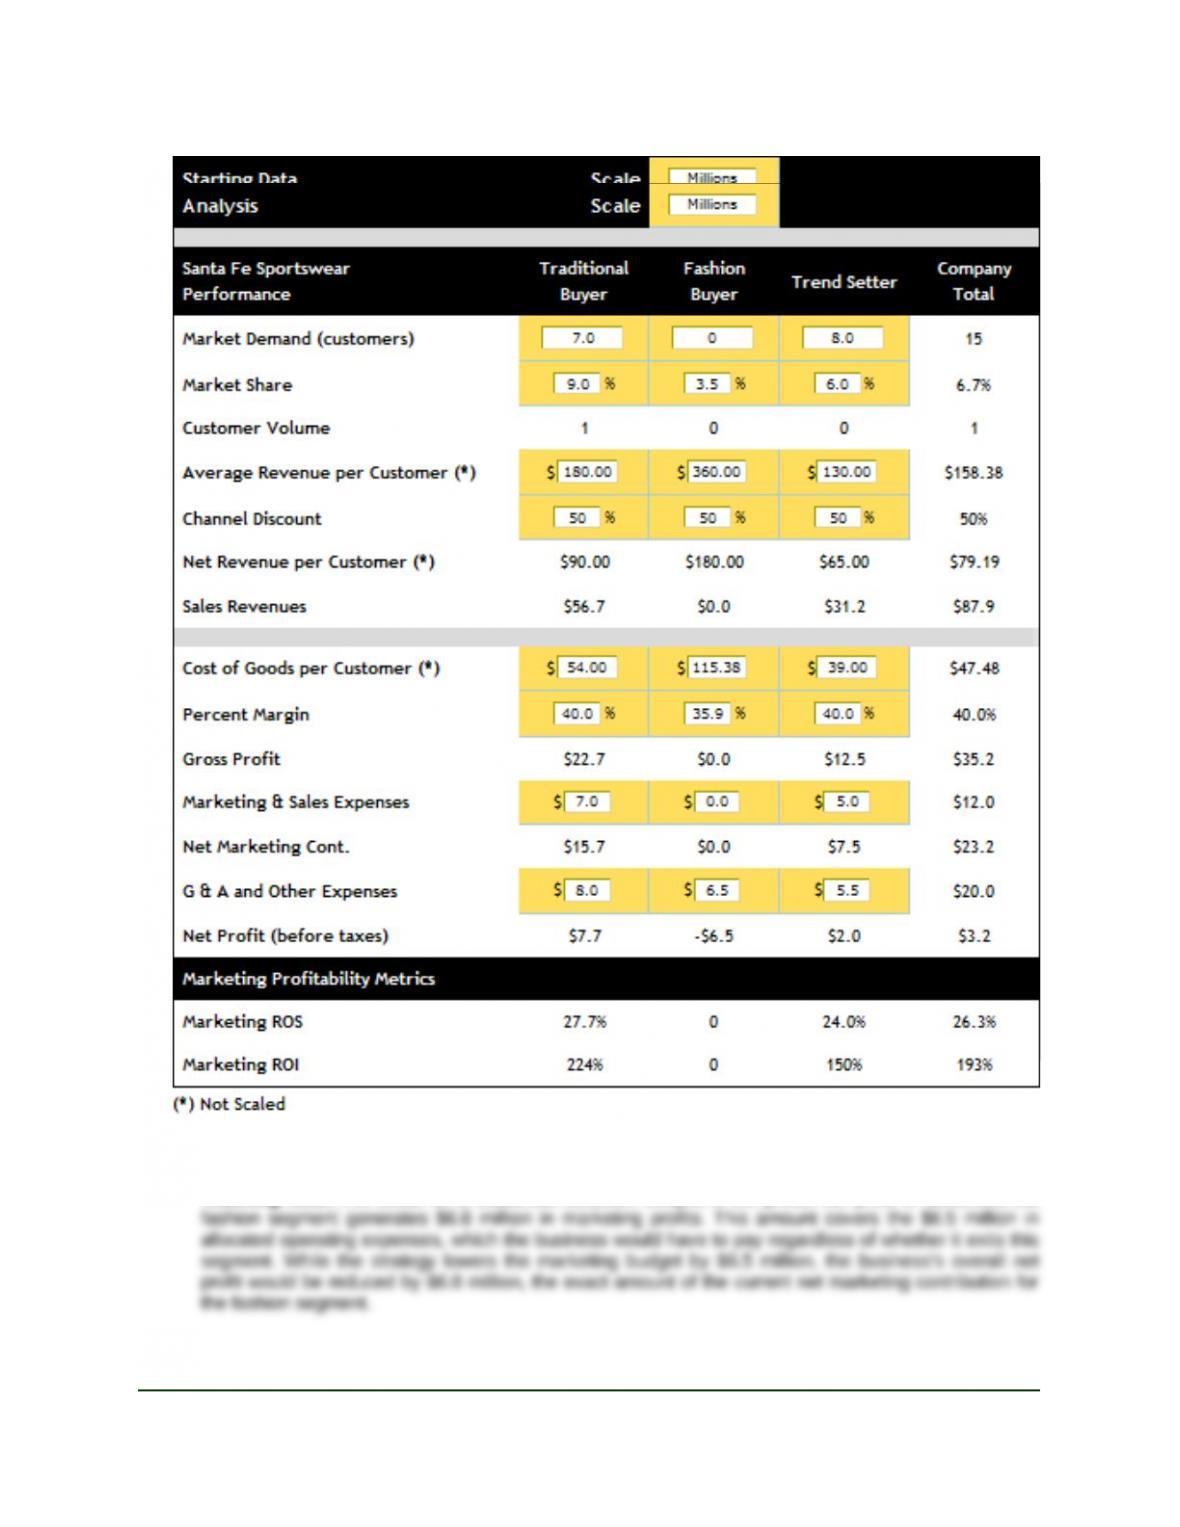
2.2 Market-Level NMC, Marketing ROS, and Marketing ROI:Figure 2-18 is used with this marketing
performance tool to address analysis items A (next page) and B (page 22). The starting data
are shown here to make comparisons with the analysis items easy.
A. Evaluate the profit impact of exiting the fashion segment.
Teaching Note:This would be a disastrous decision. Despite a low pretax net profit of $300,000, the
Market-Based Management Copyright © 2012
Sixth Edition –13– Pearson Education, Inc.
Instructor’s Manual– Chapter 2 Publishing as Prentice Hall
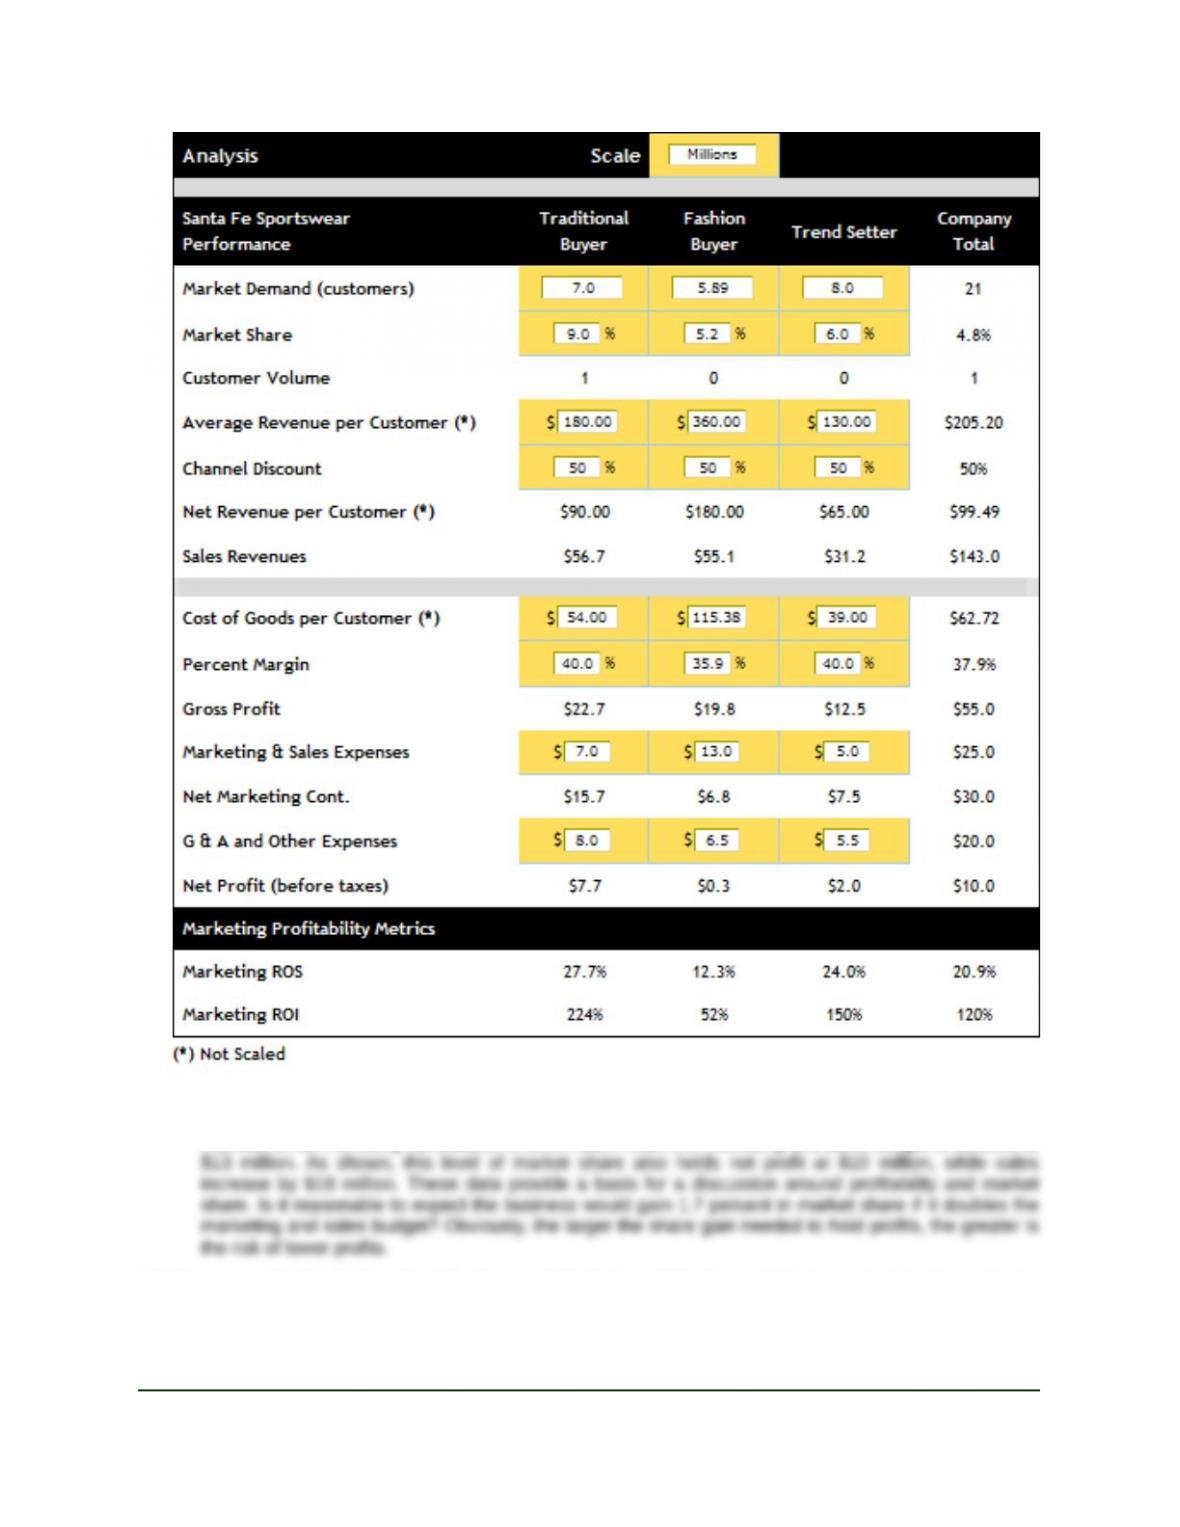
B. In the fashion segment, how much market share would the business have to obtain to keep the same
level of marketing profits if the business doubled marketing and sales expenses in that segment?
Teaching Note:The current market share of 3.5 percent would have to increase to 5.2 percent to
maintain a net marketing contribution of $6.8 million when the marketing and sales budget is doubled to
2.3 Company Net Marketing Contribution and Marketing ROI: Figure 2-13 is used with this marketing
performance tool to address items A and B (below) and C (next page).
Market-Based Management Copyright © 2012
Sixth Edition –14– Pearson Education, Inc.
Instructor’s Manual– Chapter 2 Publishing as Prentice Hall
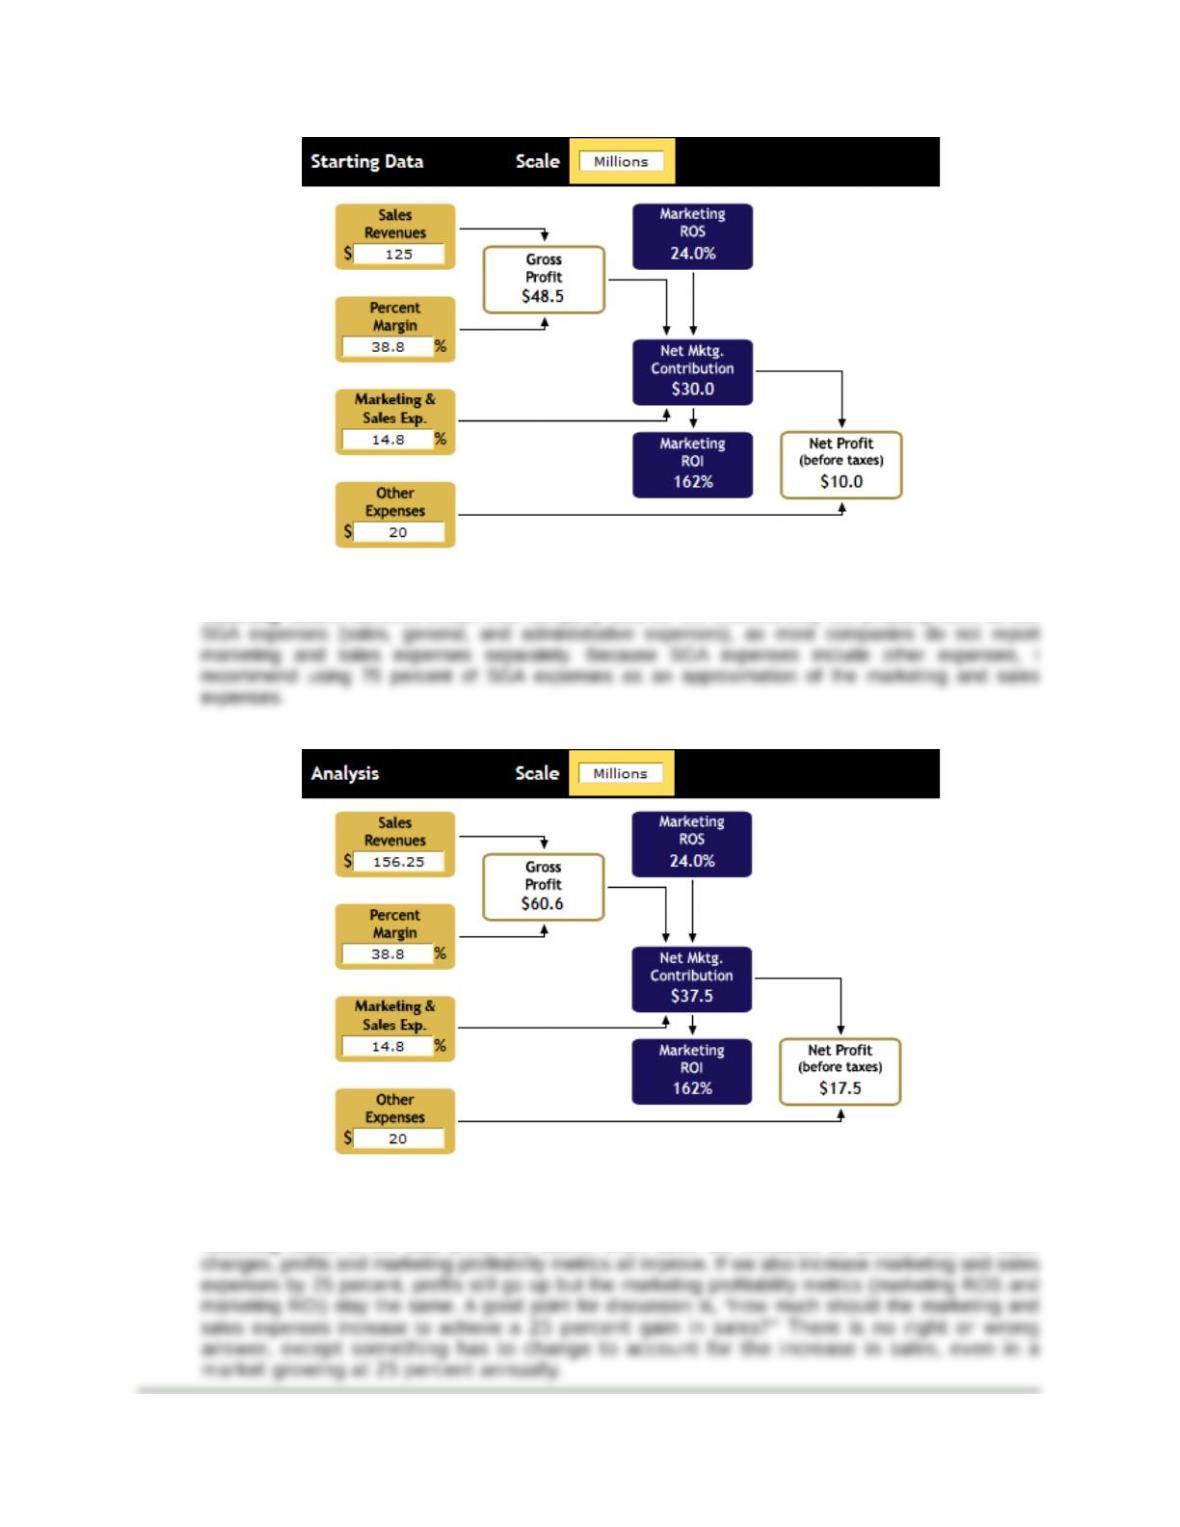
A. For a company of interest, obtain the required input from a company annual report. Evaluate the
company’s marketing profitability and how it contributes to net profit before taxes.
Teaching Note:If students obtain their company data off the Internet, they will probably have to use
B. How would marketing profits and net profit change if sales increased by 25 percent?
Teaching Note:For the data presented above, when sales are increased 25 percent with no other
Market-Based Management Copyright © 2012
Sixth Edition –15– Pearson Education, Inc.
Instructor’s Manual– Chapter 2 Publishing as Prentice Hall
C. Evaluate the profit impact of a strategy in which the percent margin is increased by 5 points and
marketing and sales expenses are increased by 2 percentage points.
Teaching Note: As shown, this strategy produces an increase of $3.375 million in the net marketing
contribution. An additional assignment would be to instruct students to find the level of percent margin
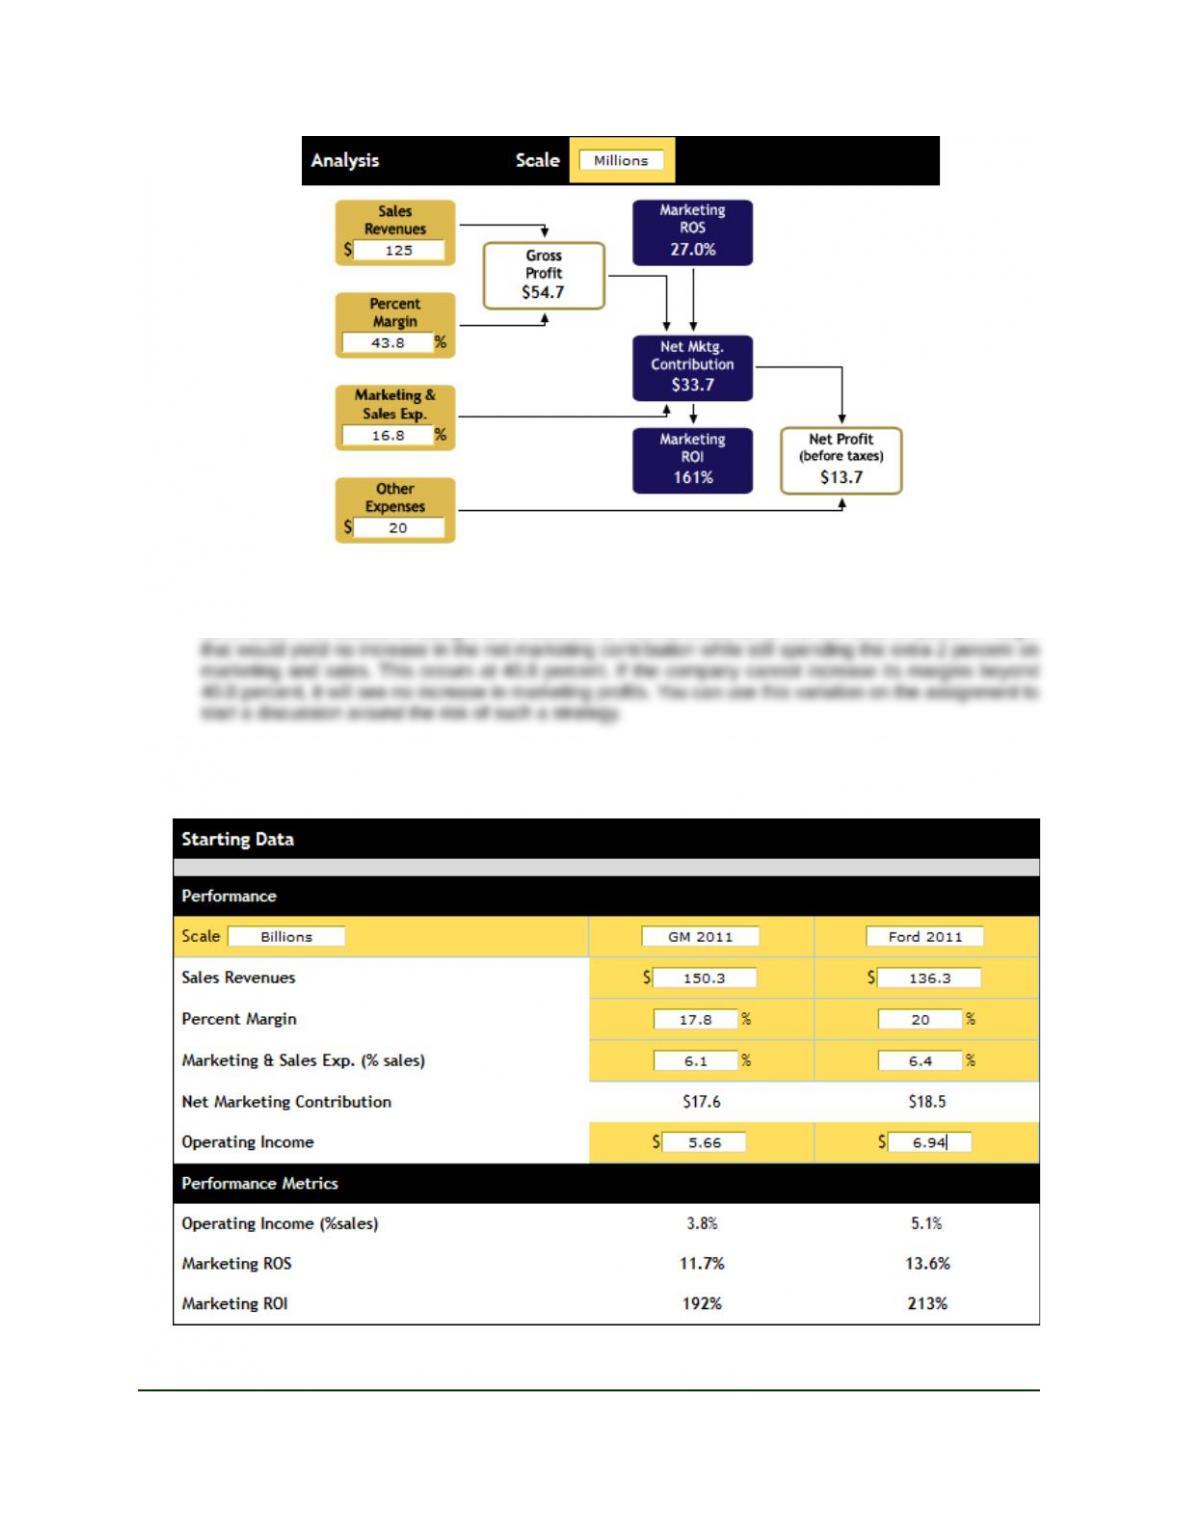
2.4 Benchmarking Marketing ROI versus Operating Income as a Percentage of Sales: Figure 2-23 is
used with this marketing performance tool to create the data needed to address items A (below) and B
(next page).
Market-Based Management Copyright © 2012
Sixth Edition –16– Pearson Education, Inc.
Instructor’s Manual– Chapter 2 Publishing as Prentice Hall
Ford
GM
GM
Ford
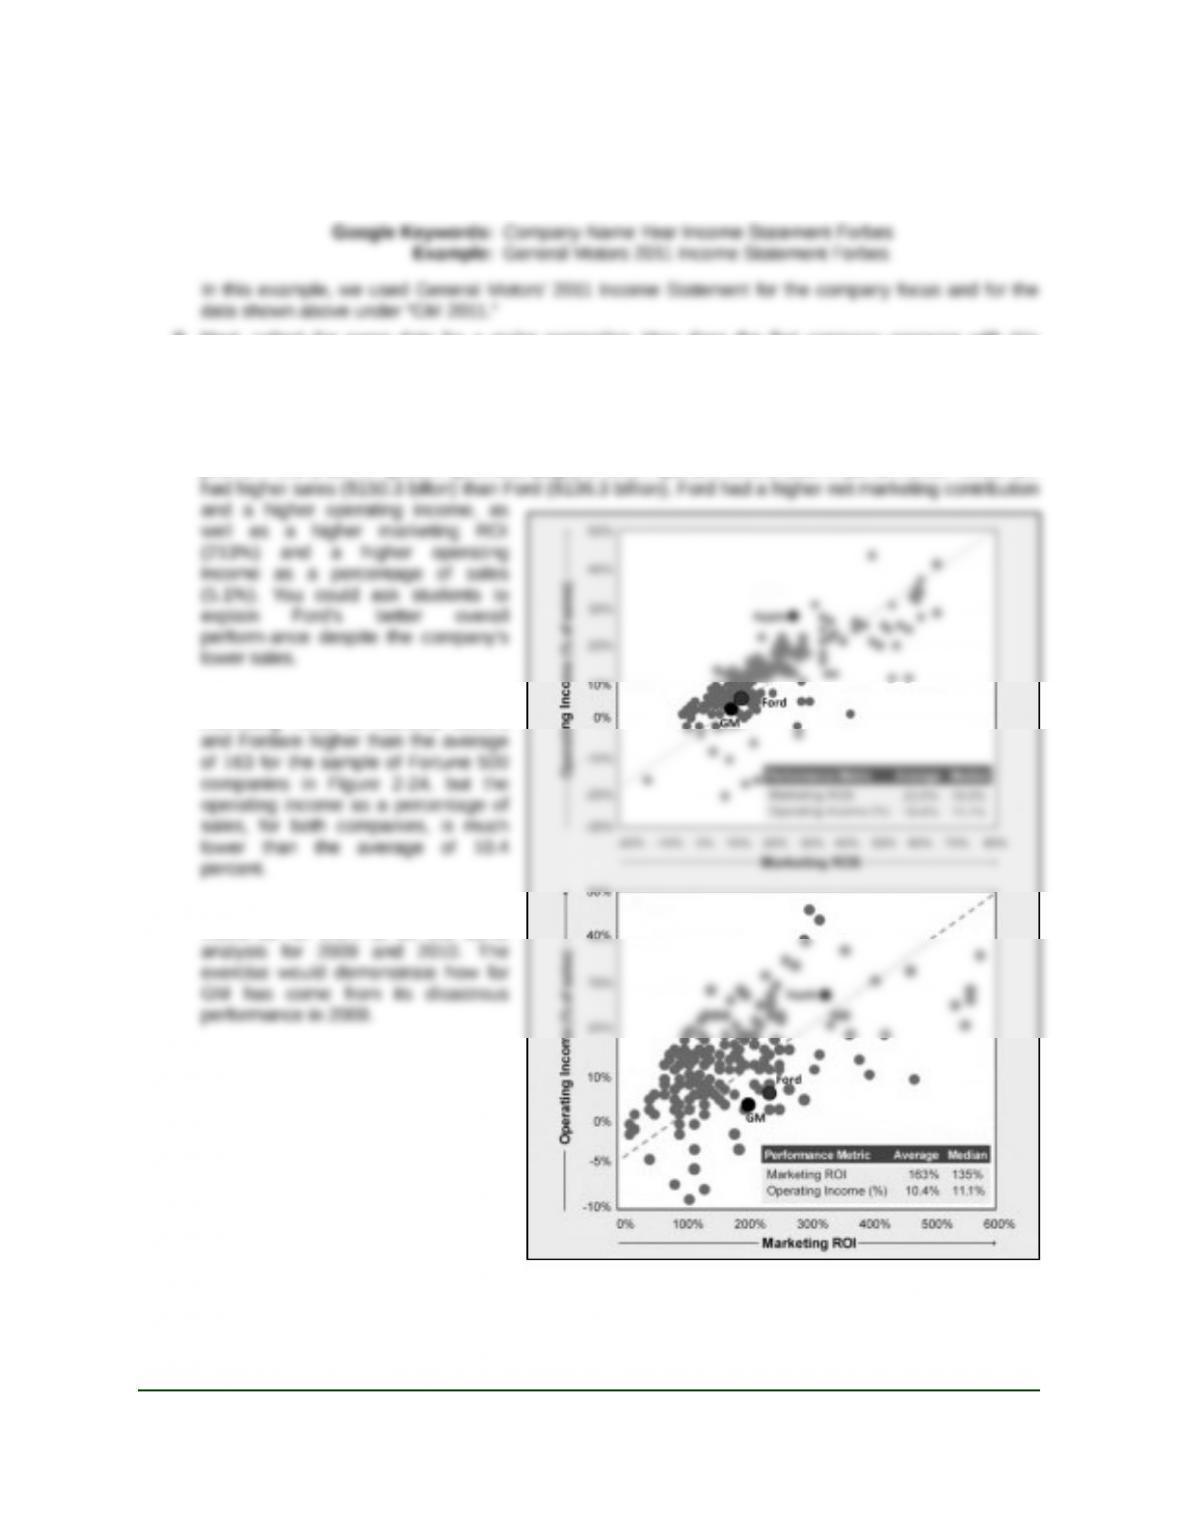
Performance Metric Average Median
Markeng ROI 163% 135%
Operang Income (%) 10.4% 11.1%
A. For a company of interest, go online and obtain the operating income and the data needed to
estimatethe company’s marketing ROI. You will probably need to use 75 percent of SGA expenses as
your estimate of marketing and sales expenses, because companies rarely report marketing and sales
expenses separately in their financial statements.
Teaching Note: I recommend using the following keywords to search for a company income statement:
B. Next, collect the same data for a major competitor. How does the first company compare with this
competitor in terms of the marketing profitability metrics (marketing ROS and marketing ROI) and
operating income as a percentage of sales? How would these results compare with the average
performance shown in Figure 2-24?
Teaching Note: For the GM’s benchmark competitor, we used Ford’s 2011 Income Statement. The
profile in the chart on quest A (previous page) shows important differences in performance. While GM
With respect to Figure 2-24, the
marketing ROIs for General Motors
A very good exercise for students
would be for them to do the same
Market-Based Management Copyright © 2012
Sixth Edition –17– Pearson Education, Inc.
Instructor’s Manual– Chapter 2 Publishing as Prentice Hall