
CHAPTER2
Marketing Metrics and Marketing Profitability
IntroductoryExercise
FedEx measures customer satisfaction monthly but measures its service quality daily with a
process metric that tracks the top ten mistakes, weighted by their negative impact on the
customer, that result in customer dissatisfaction. The day on which this internal forward-looking
metric was at its lowest (fewest mistakes), FedEx produced its highest daily profit.
1. Discuss the value of both measures (customer satisfaction and service quality) and how one relates to
the other.
2. Discuss why these are important forward-looking metrics, and how each contributes to performance.
3. Discuss why FedEx’s profit would be at its highest when the company’s internal measure of service
quality was at its lowest (fewest errors).
Teaching Objectives
Present the importance of marketing performance metrics and make clear the characteristics and roles of
external and internal metrics and of forward-looking and backward-looking performance metrics.
Illustrate how a market-based business continues to reengineer itself around markets as customer needs
and competition change and new market opportunities emerge.
Demonstrate the importance of market-level measures of profitability and how the mechanics of the net
marketing contribution can be applied to a variety of marketing strategies.
Harvard Business School Case Materials
Harrah’s Entertainment, Inc. HBS Case 50201. Describes a situation facing Philip Satre, chairman and
CEO of Harrah’s Entertainment Inc. Satre has just read a May 2000 Wall Street Journal story that discussed
the company’s marketing success in targeting low rollers, the 100 percent growth in stock price and profits
for 1999, and the revenue growth of 50 percent, which significantly outpaced the industry. The exciting article
aroused Satre’s desire to know more about the activities of then-COO Gary Loveman and his team of
“propeller heads” with respect to their database marketing efforts and the Total Reward Program. Satre was
interested in two questions: He wanted to know how much these marketing efforts had contributed to
Harrah’s overall performance and whether these marketing results were a one-time event or could be
repeated year after year, especially as competitors move to introduce similar programs. 27 pages.
Buy Low, Sell High: Creating and Extracting Customer Value by Enhancing Organizational
Performance.HBS Case 9-0597-0071. This case study provides a framework for creating customer value
and managing firm-level profitability. It focuses on the use of product line management and customer service
to achieve customer satisfaction and high profitability.
Guest First Hotel (A).HBS Case 9-602-099. Presents a hotel management situation in which customer
loyalty is linked to financial performance. This case uses years of hotel data that students need to analyze to
uncover the relationship between customer loyalty and financial performance. Although there is no
relationship in a single year, over time a key marketing profitability relationship emerges. 4 pages.
Winchell Lighting, Inc.HBS Case 9-187-074. This case documents how a midsize lighting company tracks
it marketing costs, as well as unit costs and allocated costs, to more fully understand its profitability.
Teaching Note: 5-192-034. Supplement: 9-187-075.
Direct Product Profitability at Hannaford Brothers Co.HBS Case 9-591-002. Concerns the pioneering
use of a method of accounting in retailing which takes into account not only sales and the cost of goods sold
but, at the item level, all of the variable costs associated with each item sold. This case focuses on the
strengths and weaknesses of Hannaford’s use of direct product profit and the opportunities for, and
obstacles hindering, improvement and extension of the direct product profit system.
The Customer Pyramid.HBS Case CRM 211. This reading provides students with an insight into different
levels of customer profitability. “The Customer Pyramid” provides a marketing management tool that
strengthens the link between service quality and profitability. 26 pages.
Market-Based Strategic Thinking
1. How could marketing metrics help General Motors turn around its decline in sales and profits?
GM has many internal performance metrics with regard to production, employee productivity, and financial
performance. Metrics for these categories are standard for manufacturing companies. The importance of
marketing metrics rests in their external measurements of performance. Ratings of customer satisfaction,
2. If a company dominates a market the way Microsoft, Google, and Intel dominate their markets, why
should that company bother to track marketing metrics?
All market leaders stumble at some point. U.S. Steel, GM, and IBM all seemed invincible at one time.
Without external marketing metrics, a company is vulnerable to listening to itself and not the voice of the
3. How would marketing metrics help a company like McDonald’s better manage its profitability?
By measuring the net marketing contribution, marketing ROI, and marketing ROS of each of its
restaurants, McDonald’s could better understand average performance as well as above- and
4. How would Toyota use forward-looking marketing metrics to better understand future sales and
profits in the U.S. market?
Changes in customer satisfaction, and particularly changes in the percentage of “very satisfied” customers,
5. How could a Wall Street analyst benefit from access to a company’s marketing metrics for a
company like BioTronics?
Wall Street analysts could benefit from measuring a company’s marketing ROI and marketing ROS.
Improvements or declines in these marketing profitability metrics provide a measure of company
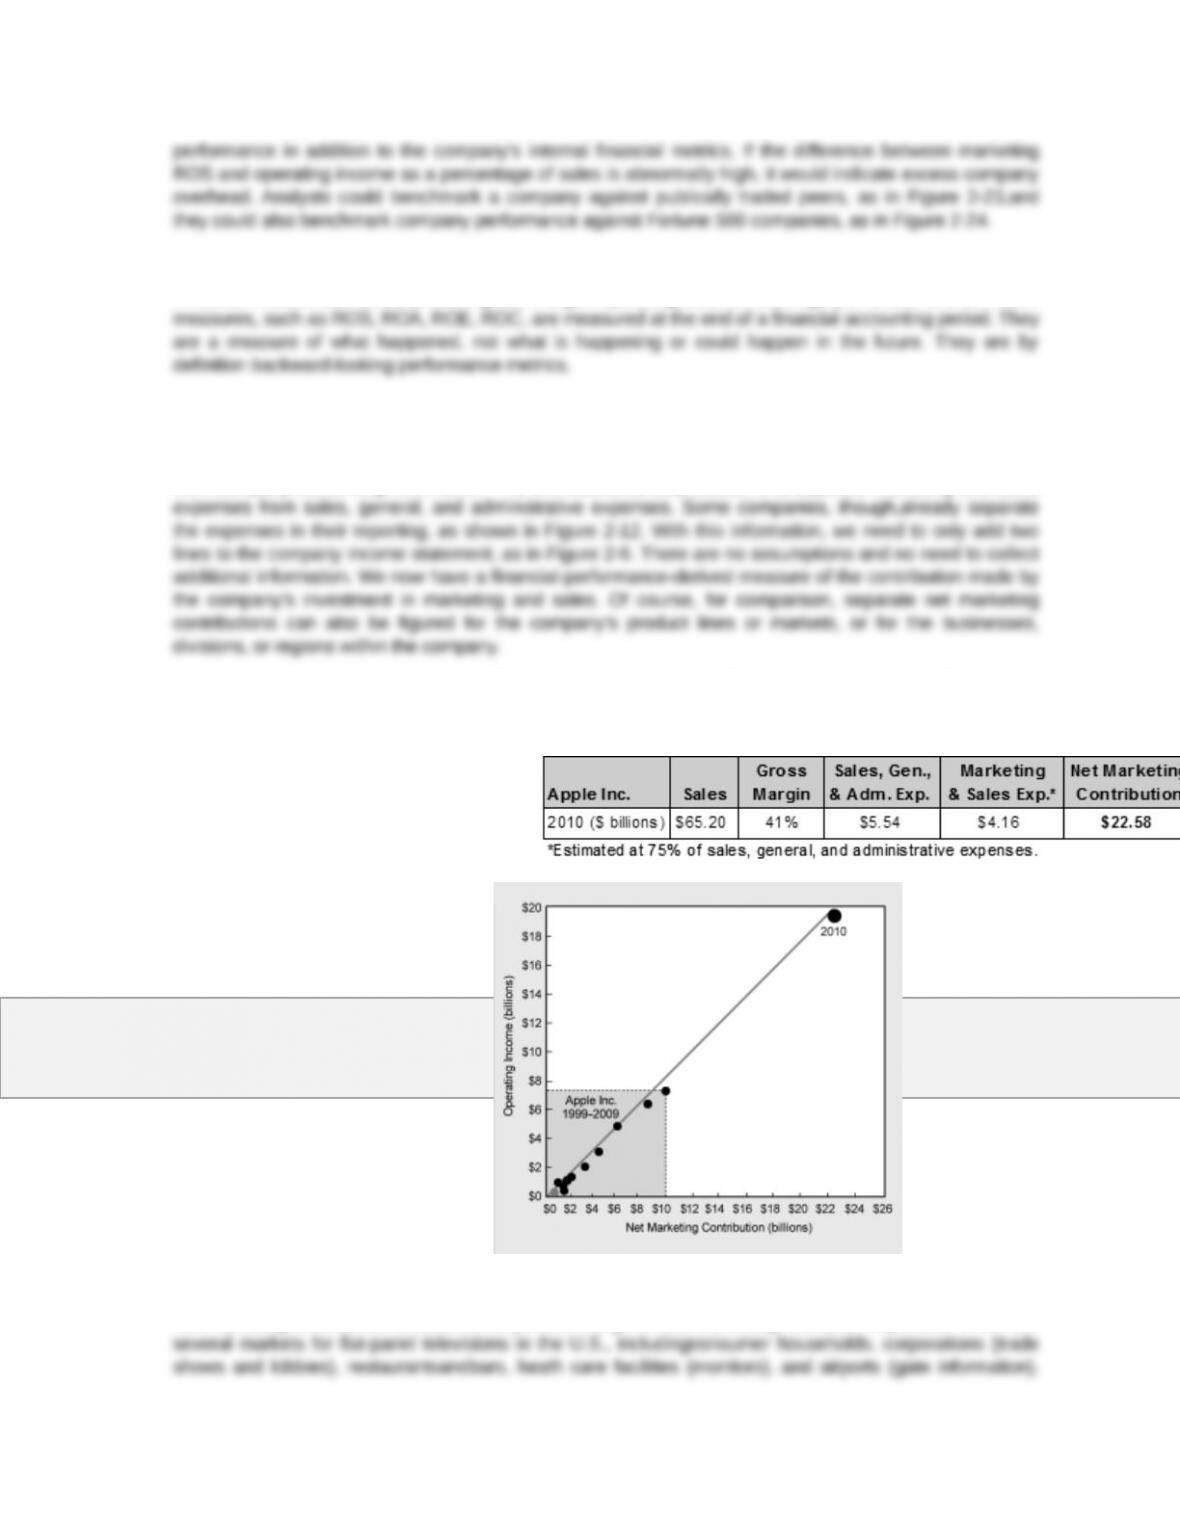
Shown above are Apple’s 2010 nancial results. The net markeng contribuon of $22.58 billion is based on esmated markeng and sales expenses of $4.16 billion. Apple’s operang income in 2010 was $18.82 billion.
In the graphwe can see how Apple’snet markeng contribuon went through the roof in 2010. And, as shown, the pa)ern establishedbetween the net markeng contribuon and operang income during the previous 10 years stays intact.
6. Why are most financial metrics backward-looking metrics?
Financial metrics like sales, percent gross margin, operating income, earnings per share, and all return
7. Why would chief financial officers and senior management be comfortable with net marketing
contribution as a financial measure of marketing profitability?
CFOs and senior managers can easily see that the net marketing contribution is a financial metric derived
from company accounting information. The one additional stepneeded is to separate marketing and sales
8. Compute Apple’s net marketing contribution for company’s last fiscal year and add it to Figure 2-22.
Then explain how this level of net marketing contribution could be used in Apple’s marketing plans
to project Apple’s operating income for the current year.
9. How would Vizio use net marketing contribution at the market level to increase its knowledge of the
U.S. flat-panel television market?
Net marketing contribution is sales times percent margin minus marketing and sales expenses. There are
Each market has a net marketing contribution based on sales, percent margin, and theinvestment in
10. How would Procter & Gamble use a product-level measure of net marketing contribution for the
Tide brand in the U.S. market?
Tide is but one of nine brands in P&G’s detergent product line. The others are Bold, Cascade, Cheer,
Dash, Dawn, Dreft, ERA, and Gain. Each has a net marketing contributionbased on sales, percent margin,
and marketing and sales expenses. Computing the NMC for each brand allows P&G to see which ones
11. How could Apple’s chief marketing officer use Figure 2-23 to explain to Apple’s CFO the value of
marketing ROS and marketing ROI as corporate performance metrics?
CFOs are interested in financial numbers. They are less impressed by survey data or the opinions of
marketing managers. Figure 2-23 is based on the financial results of Apple and four competing benchmark
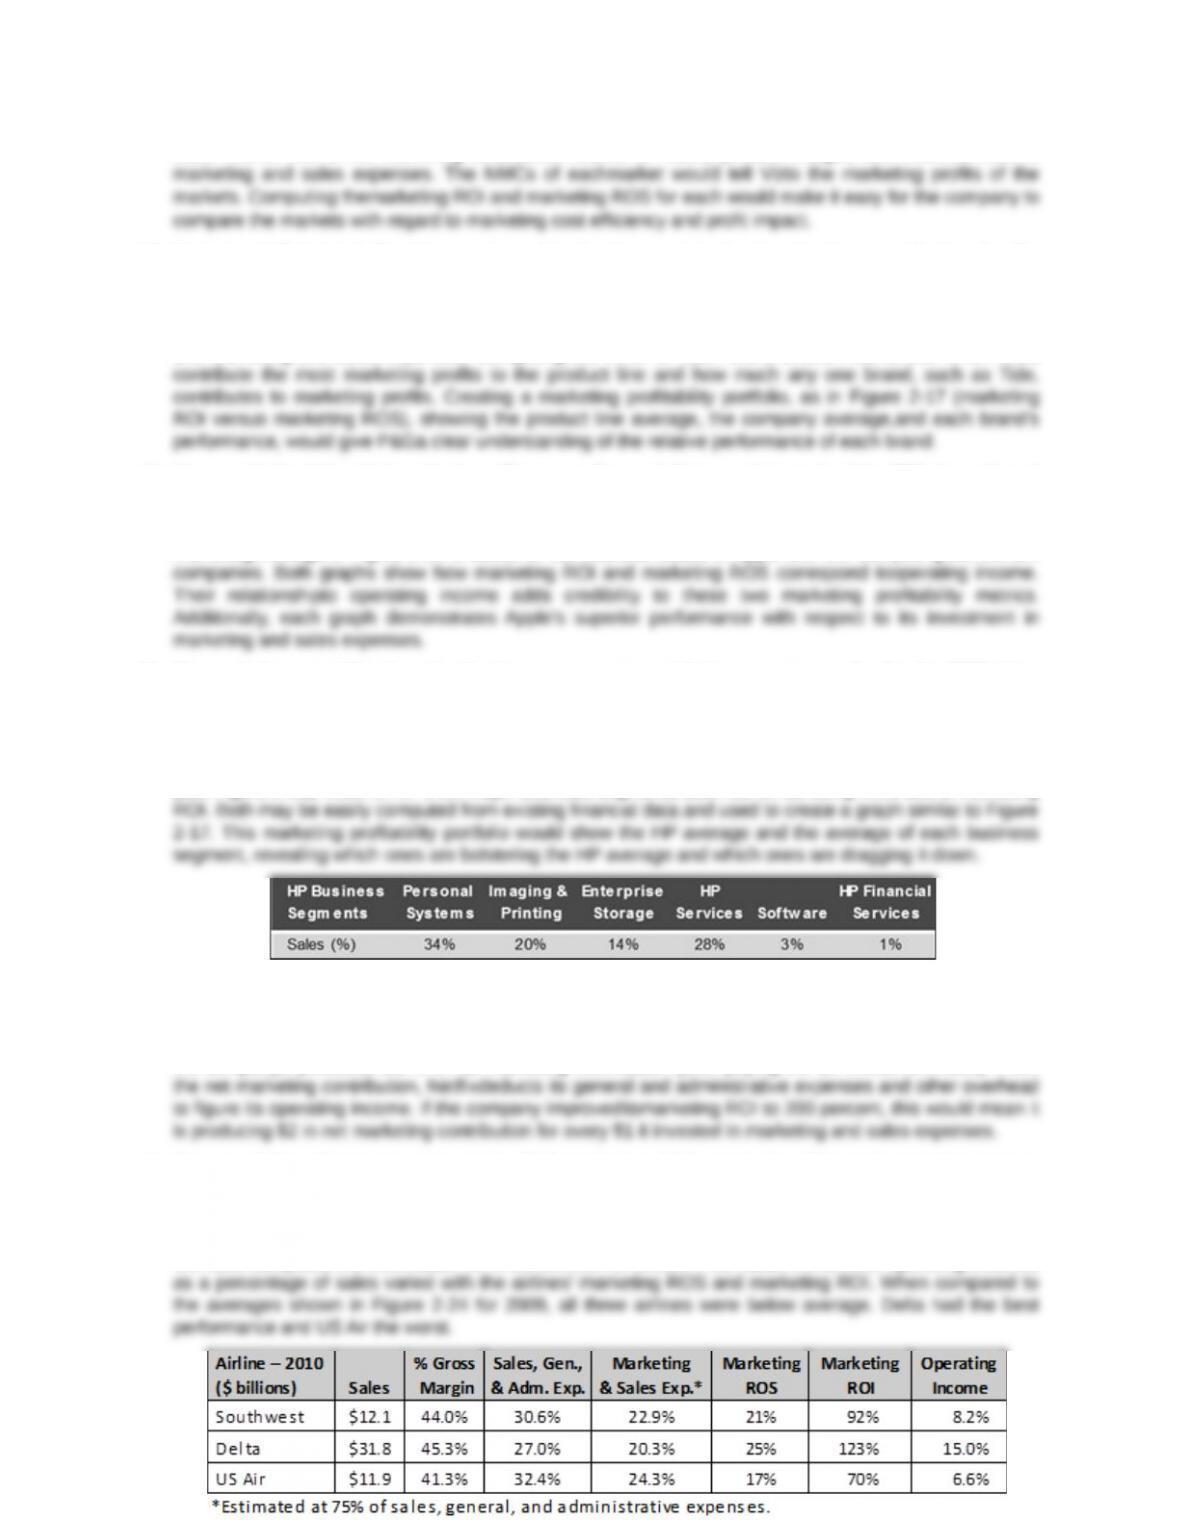
12. Shown below are HP’s six major business segments and their percentages of sales for 2009. How
would a marketing profitability portfolio (similar to Figure 2-17) help the HP chief marketing officer
communicate to senior management the relative performance of each business segment when
compared to the HP average.
In 2009, HP as a company had a marketing ROS of 17 percent and a marketing ROI of about 200 percent
(see Figure 2-23). Each of HP’s six major business segments also has a marketing ROS and a marketing
13. In 2009, Netflix had a marketing ROI of 178 percent. What does this mean in terms of the company’s
investment in marketing and sales?
A marketing ROI of 178 percent means that for each dollar Netflix invested in marketing and sales to grow
the company,it produced $1.78 in net marketing contribution (after paying the $1 investment back). From
14. For any airline of interest, compute its 2010 marketing ROS, marketing ROI, and operating income
(as a percentage of sales) using the airline’s 2010 income statement in its annual report. Assume
marketing and sales expenses are 75 percent of SGA expenses. Then plot the results in Figure 2-24
and interpret the airline’s performance.
We have computed this information for three airlines. As shown in the table, the airlines’ operating incomes
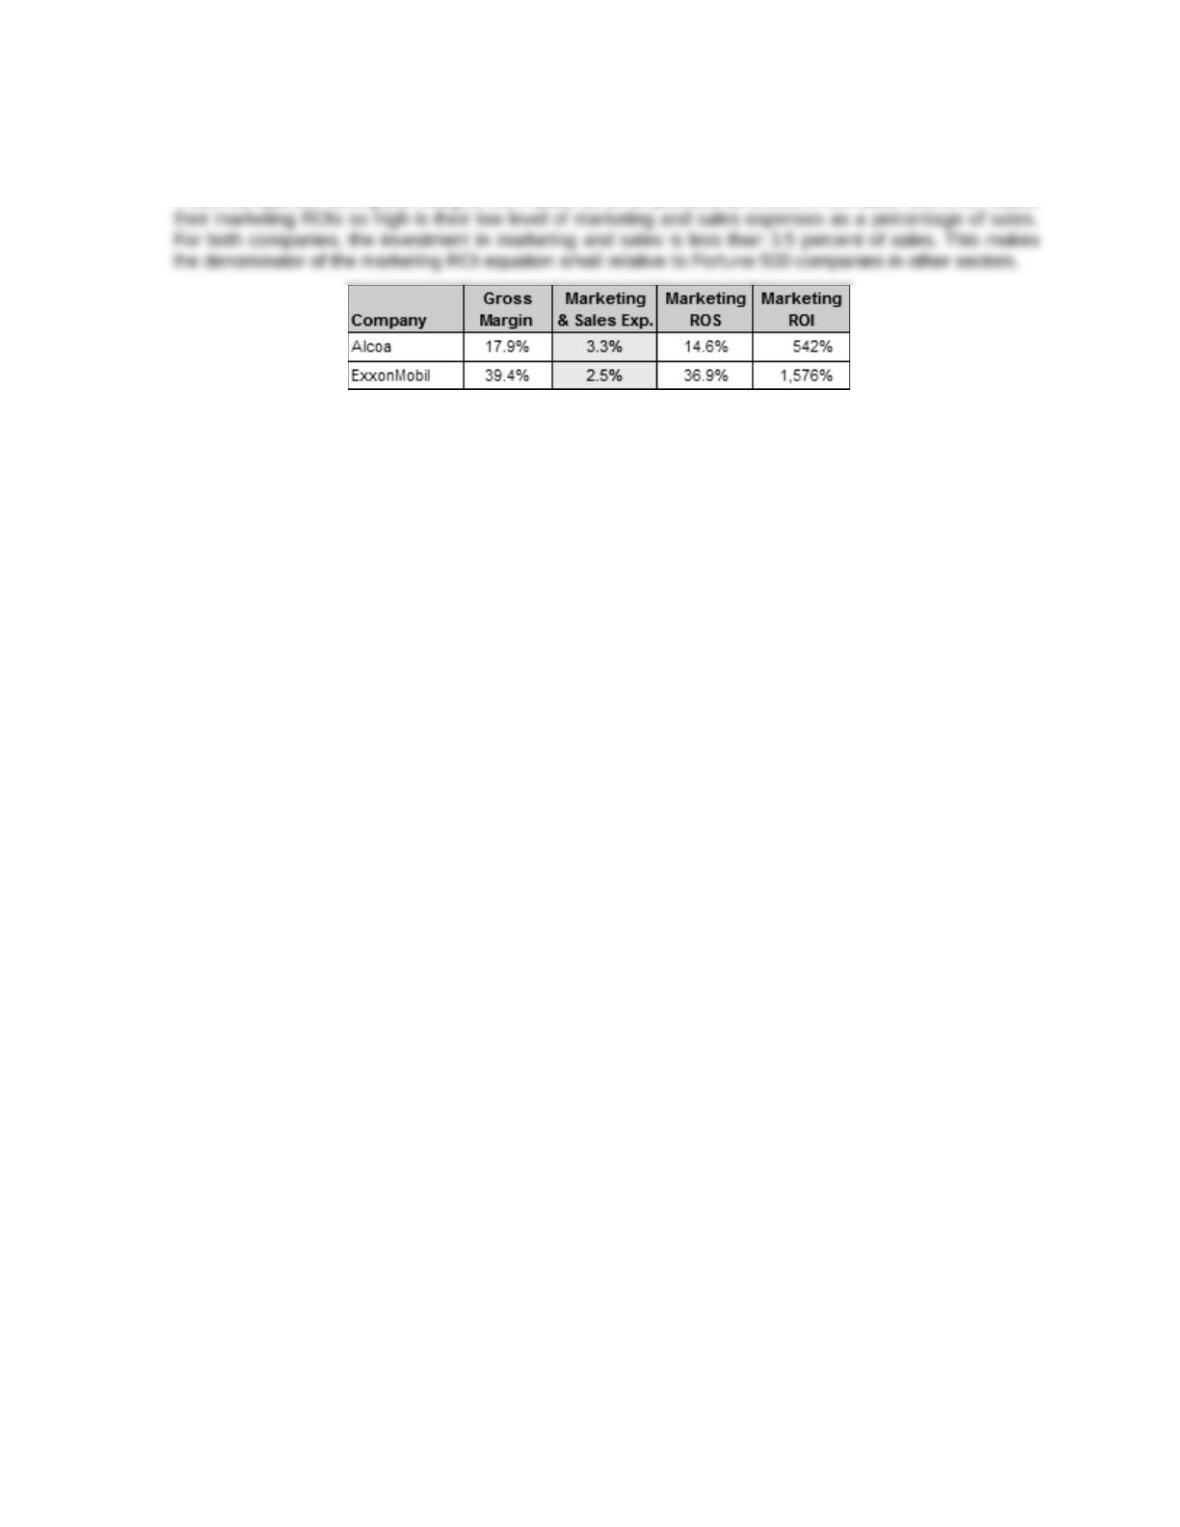
15. Why would companies that sell energy and raw materials, such as ExxonMobil and Alcoa, have
very large marketing ROIs.
These companies have gross margins from about 18 to 39 percent, as shown in the table. But what makes