ABCD
Marketing Performance Tools and Application Exercises
12.1Offensive Strategies—Core Strategy I: Grow in Existing Markets
Using the data provided, evaluate the four offensive strategies for growing sales in existing markets.
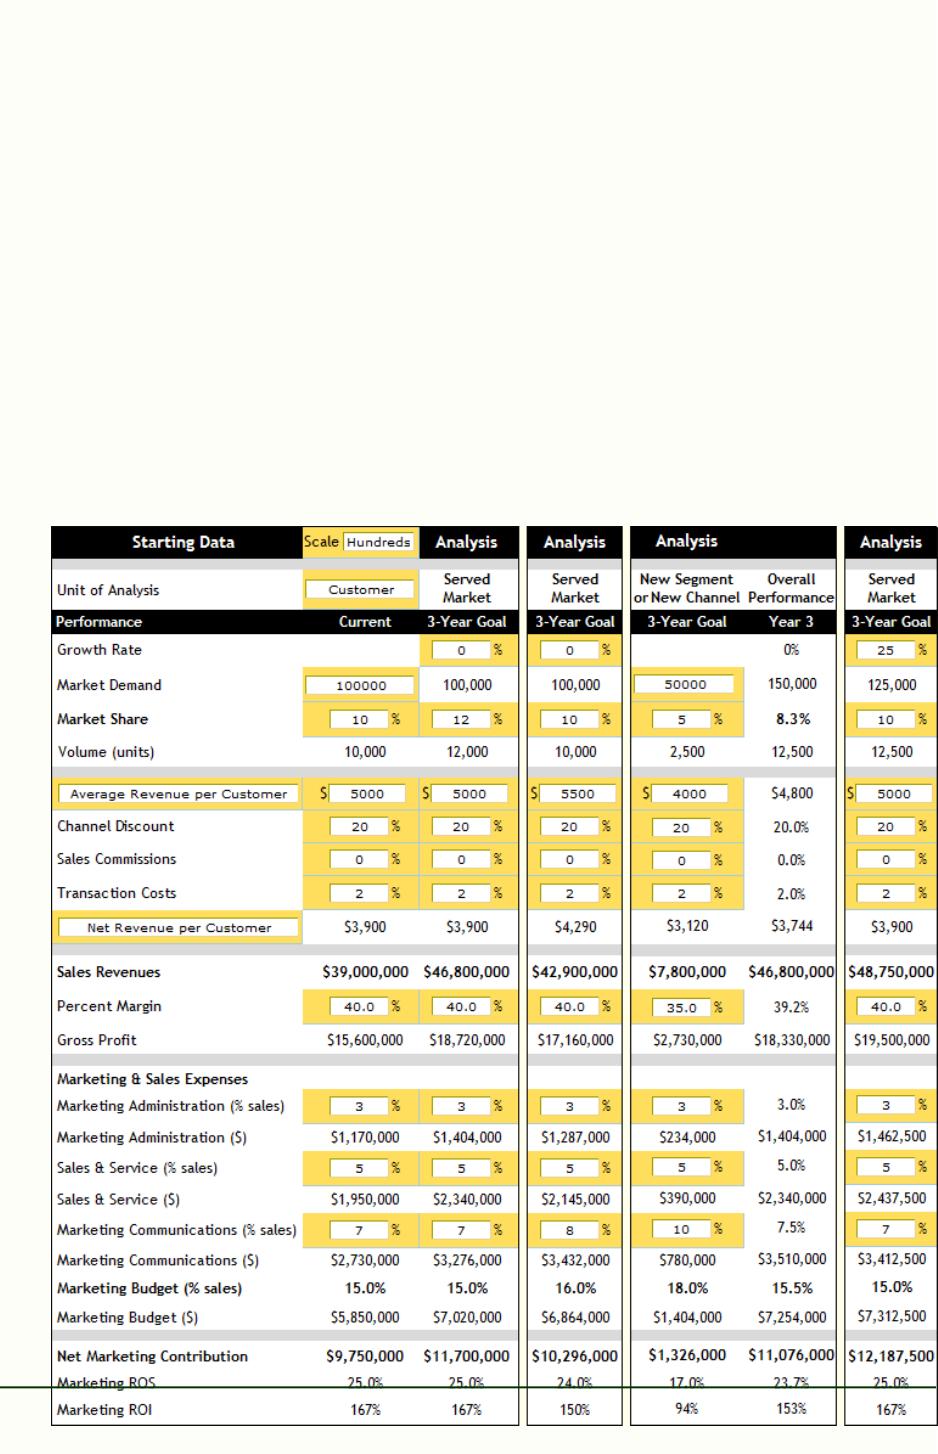
A. Grow Market Share:Increase the market share from 10 to 12 percent.
B. Grow Revenue per Customer:Increase from $5,000 to $5,500, holding marketing administration
costs as a percent of sales constant (3%) and increasing marketing communications to 8 percent.
C. Enter New Market Segment:Use Add Segment and input 5,000,000 for market demand, 5 percent for
market share, $4,000 for price, and lower margin to 35 percent and increase marketing
communications costs as a percent of sales to 10 percent.
D. Expand Market Demand:Increase the percentage for the 3-year goal for market demand from 0 to 25
percent.
The analyses that followare setup with customers as the unit of analysis. You can switch to a product as
the unit of analysis by changing Unit of Analysis and the two gray cells that say “Average Revenue per
Customer” and “Net Revenue per Customer Price” to “Average Selling Price per Unit” and “Net Selling
Price per Unit,” respectively.)
Market-Based Management Copyright © 2012
Sixth Edition –39– Pearson Education, Inc.
Instructor’s Manual– Chapter 4 Publishing as Prentice Hall
Teaching Notes
A. As we would expect, the oensive strategy to grow market share by 2 points increases
B. A strategy to improve revenue per customer contributes to higher sales and higher
gross prots. While the marketing budget increases from $585 million to $686.4 million,
C. Entering a new segment creates a new source of sales and prots. As shown, sales
increase by $780 million and marketing prots increase by $132.6 million. However,
D. An oensive strategy to grow the market at a rate of 25 percent would require an
increased marketing budget, as shown in the screen printout (from $585 million to
12.2Offensive Strategies—Core Strategy II: Improve Margins
Using the data provided, evaluate the four offensive strategies for improving margins for sales in
existing markets.
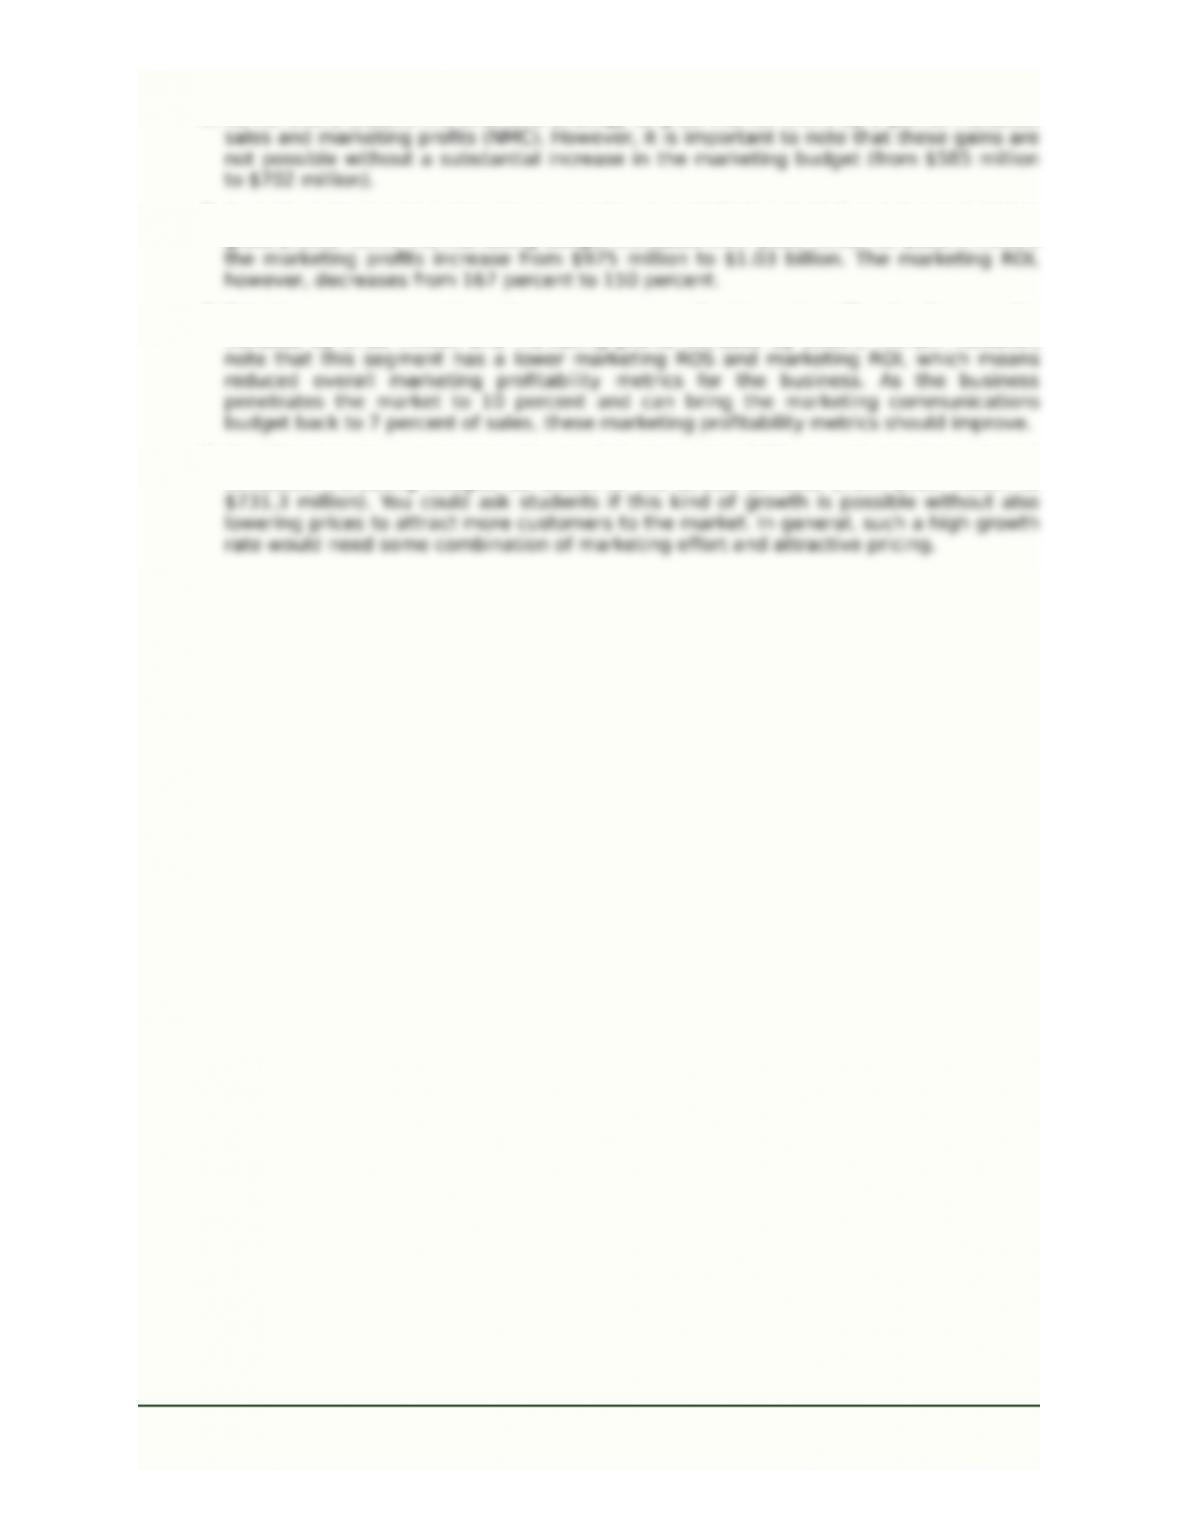
A. Improve Customer Loyalty and Retention: Increase retention from 50 to 75 percent, with an
increase in the retention cost per customer form $150 to $200.
B. Improve Differentiation Advantage: Increase revenue per customer by $500 for retained and new
customers and increase the retention cost and acquisition cost per customer by $50.
C. Lower Cost, Improve Marketing Productivity: Lower the customer retention cost from $150 to $100
and lower the marketing administration expenses as a percent of sales to 2.5 percent.
Market-Based Management Copyright © 2012
Sixth Edition –40– Pearson Education, Inc.
Instructor’s Manual– Chapter 4 Publishing as Prentice Hall
ABCD
D. Build Marketing Advantage: Increase share from 10 to 12 percent (due to channel advantage), while
increasing acquisition cost per customer from $800 to $850.
Teaching Notes
A. This strategy improves sales by $550 million and increases marketing profits by $462.1 million.
Some of the gains in marketing profits are due to higher levels of marketing efficiency (customer
B. The differential strategy increases the price and revenue per customer. In this analysis, I assumed
the percent margins would remain the same. If in fact the business just raised its price without a product
Market-Based Management Copyright © 2012
Sixth Edition –41– Pearson Education, Inc.
Instructor’s Manual– Chapter 4 Publishing as Prentice Hall
AB
C. This strategy results in no change in sales but strives to maintain sales and market share with a
D. This offensive strategy is expected to improve sales by $780 million and marketing profits by $162.2
million. However, building a marketing advantage is not free, and the marketing budget must increase
12.3Offensive Strategies—Core Strategy III: Diversify Growth
Using the data provided, evaluate the four offensive strategies for growing sales with diversified growth.
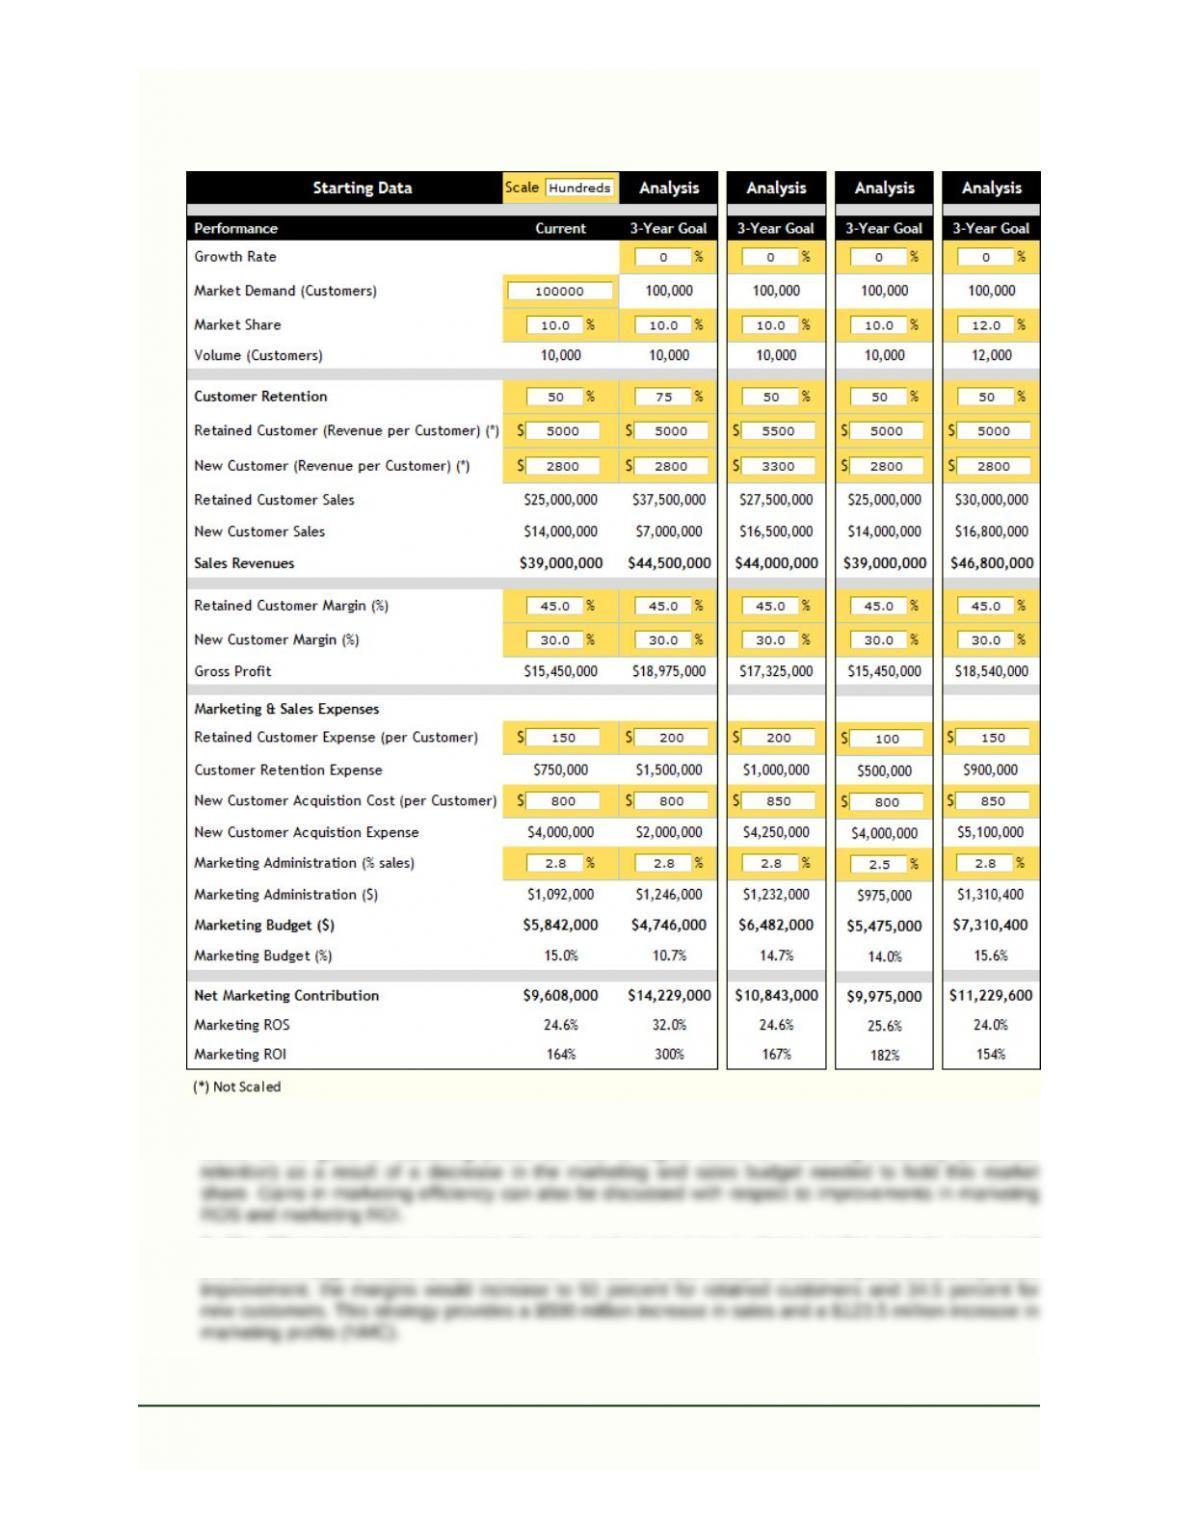
A. Enter Related New Markets:Reduce the goal for market demand from 10 million to 5 million and
increase marketing communications expenses from 7 to 10 percent.
B. Enter Unrelated New Markets:Reduce market demand from $10 million to 5 million, reduce market
share to 5 percent, increase sales and service expenses as a percentage of sales to 7 percent, and
increase marketing communications expenses as a percent of sales to 12 percent.
The analyses that follow (for A and B below and C and D on the next page) are setup with customers as
the unit of analysis. You can switch to a product as the unit of analysis by changing Unit of Analysis and
the two gray cells that say “Average Revenue per Customer” and “Net Revenue per Customer Price” to
“Average Selling Price per Unit” and “Net Selling Price per Unit,” respectively.
Teaching Notes
Market-Based Management Copyright © 2012
Sixth Edition –42– Pearson Education, Inc.
Instructor’s Manual– Chapter 4 Publishing as Prentice Hall
A. An offensive strategy to enter a related market is expected to increase sales by $1.95 billion
B. An offensive strategy to enter an unrelated market is expected to increase sales by $975
million and improve marketing profits by $175 million. It is important to note that the marketing budget
Offensive Strategies C and D:
C. Enter New Emerging Markets:Market demand, 1 million; market share, 40 percent; sales and service
expenses as a percentage of sales, 10 percent; and marketing communications expenses as a
percentage of sales, 15 percent.
D. Develop New Markets:Market demand, 100,000; market share, 80 percent; sales and service
expenses as a percentage of sales, 10 percent; and marketing communications expenses as a percent
of sales, 40 percent.
Teaching Notes
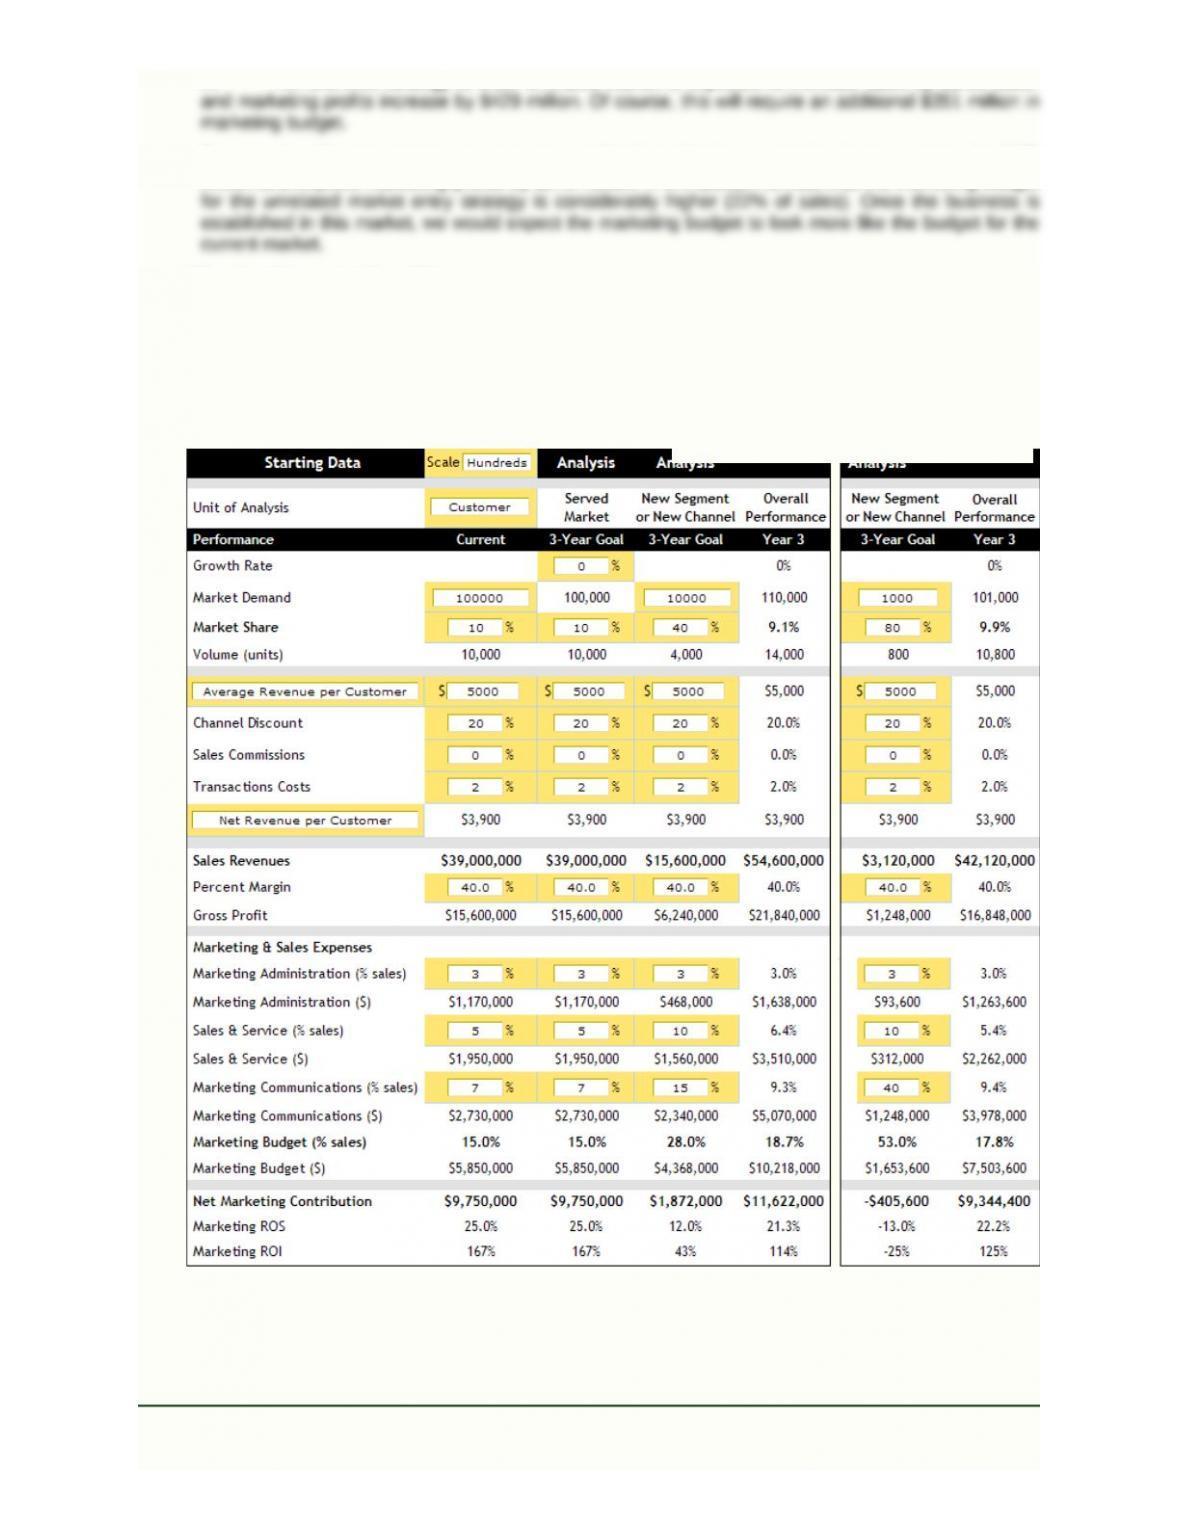
C. Entering a new emerging market is expensive and takes time. As shown, the marketing
budget is 28 percent of sales. While the market is small (1 million customers), the business has every
Market-Based Management Copyright © 2012
Sixth Edition –43– Pearson Education, Inc.
Instructor’s Manual– Chapter 4 Publishing as Prentice Hall
A B
D. Developing new markets is high risk and likely to be unprofitable for several years. As shown
above, this market development strategy is projected to produce $312 million in sales by year 3.
However, the marketing budget as a percent of sales is 53 percent. The marketing profits are negative
Market-Based Management Copyright © 2012
Sixth Edition –44– Pearson Education, Inc.
Instructor’s Manual– Chapter 4 Publishing as Prentice Hall