Marketing Performance Tools and Application Exercises
10.1 Marketing Communications and Customer Response: This marketing performance tool uses Figure
10-15 in answering questions A, B and C.
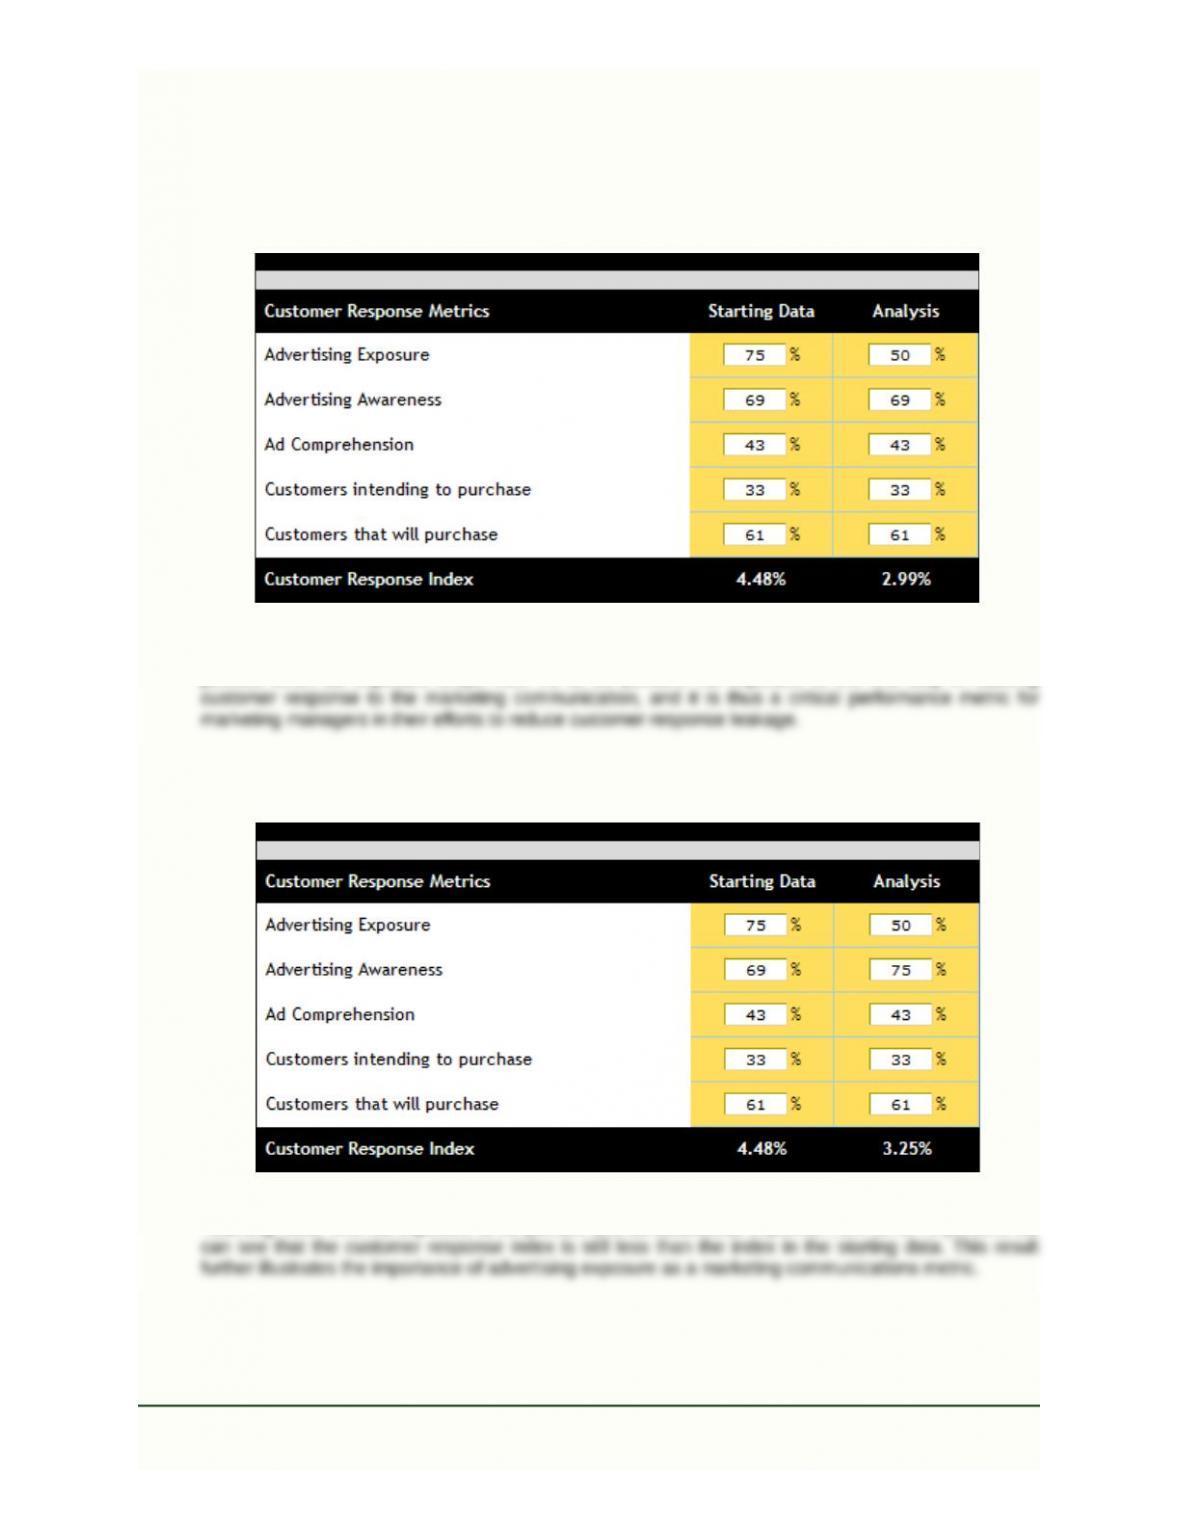
A. Using the data provided, how do the results of this marketing communication change when advertising
exposure is only 50 percent?
Teaching Note: As shown in the screen printout, the customer response index falls from 4.48 to 2.99
percent when ad exposure drops from 75 to 50 percent. Ad exposure is the first step in building
B. Using the results provided, evaluate the impact of improving ad awareness from 69 to 75 percent.
Teaching Note: With ad exposure at 50 percent and ad awareness improved from 69 to 75 percent, we
Market-Based Management Copyright © 2012
Sixth Edition –39– Pearson Education, Inc.
Instructor’s Manual– Chapter 4 Publishing as Prentice Hall
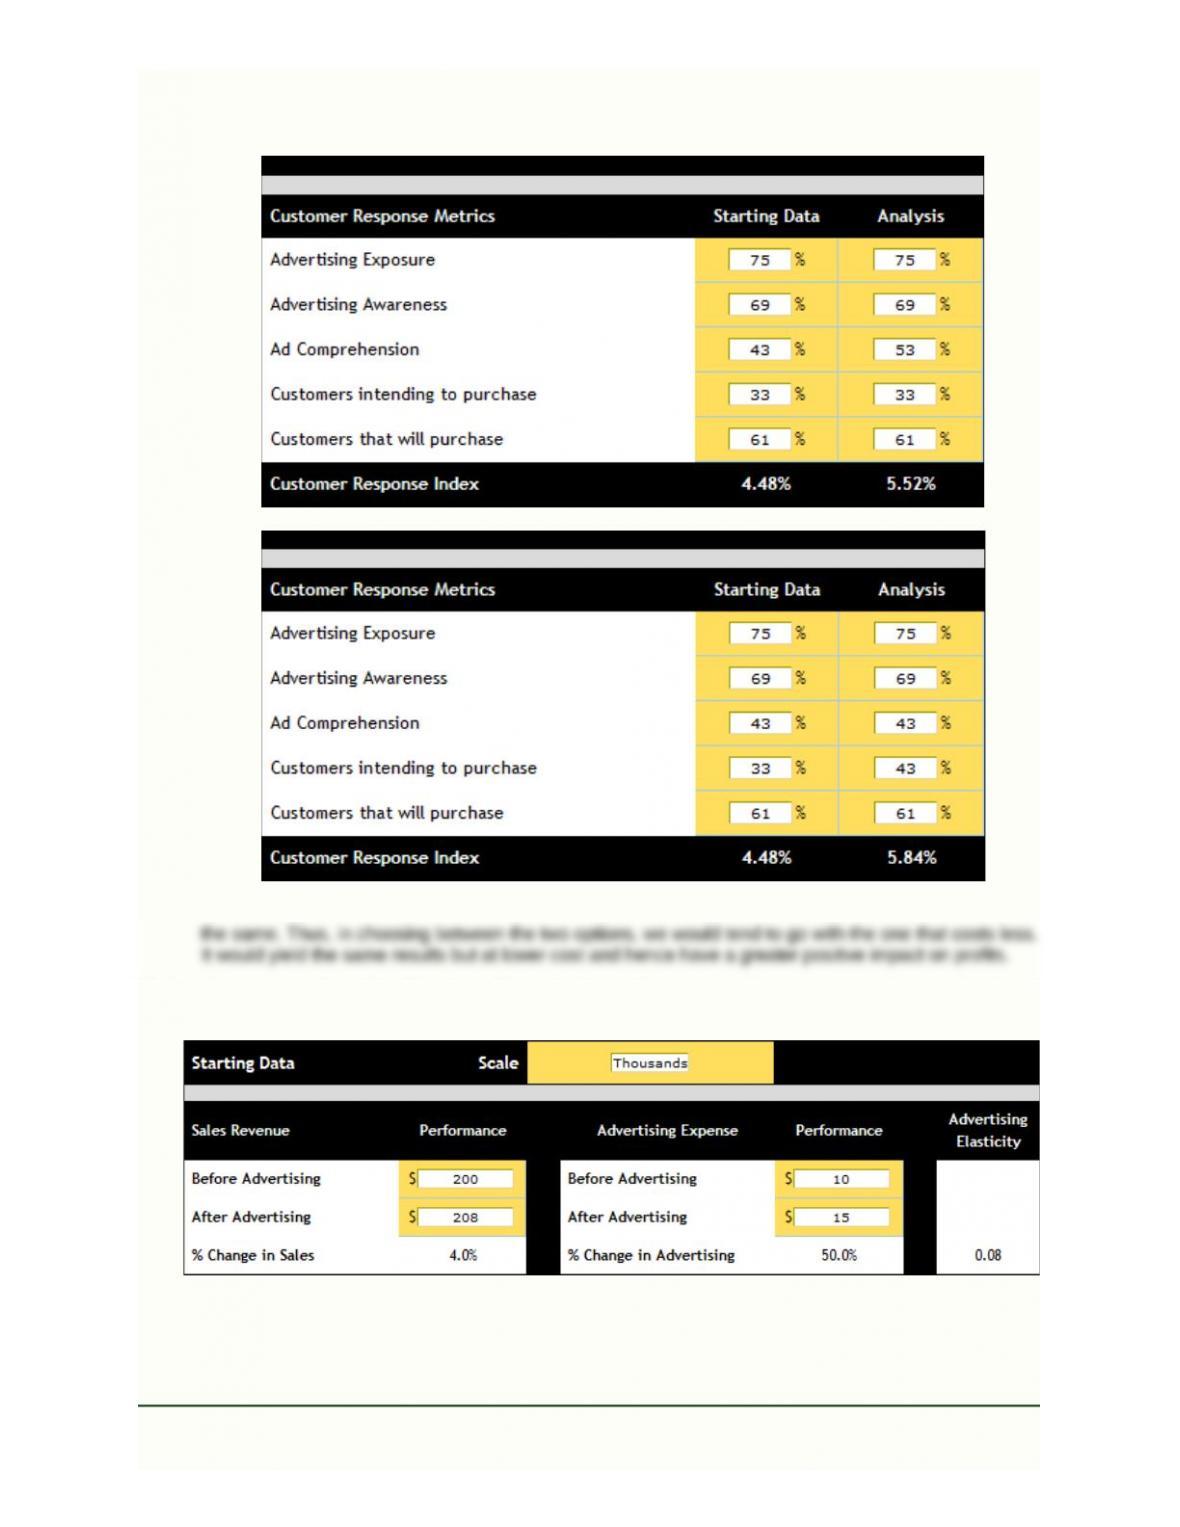
C. For future advertisements, would it be more effective to work on increasing comprehension by 10 points
(from 43%to 53%) or to work on improving intentions to purchase by 10 points (from 33%to 43%)?
Teaching Note: As shown in the screen printouts, the impact on the customer response index is about
10.2 Estimating Advertising Elasticity: This marketing performance tool is used in answering questions A and
B below.
Market-Based Management Copyright © 2012
Sixth Edition –40– Pearson Education, Inc.
Instructor’s Manual– Chapter 4 Publishing as Prentice Hall
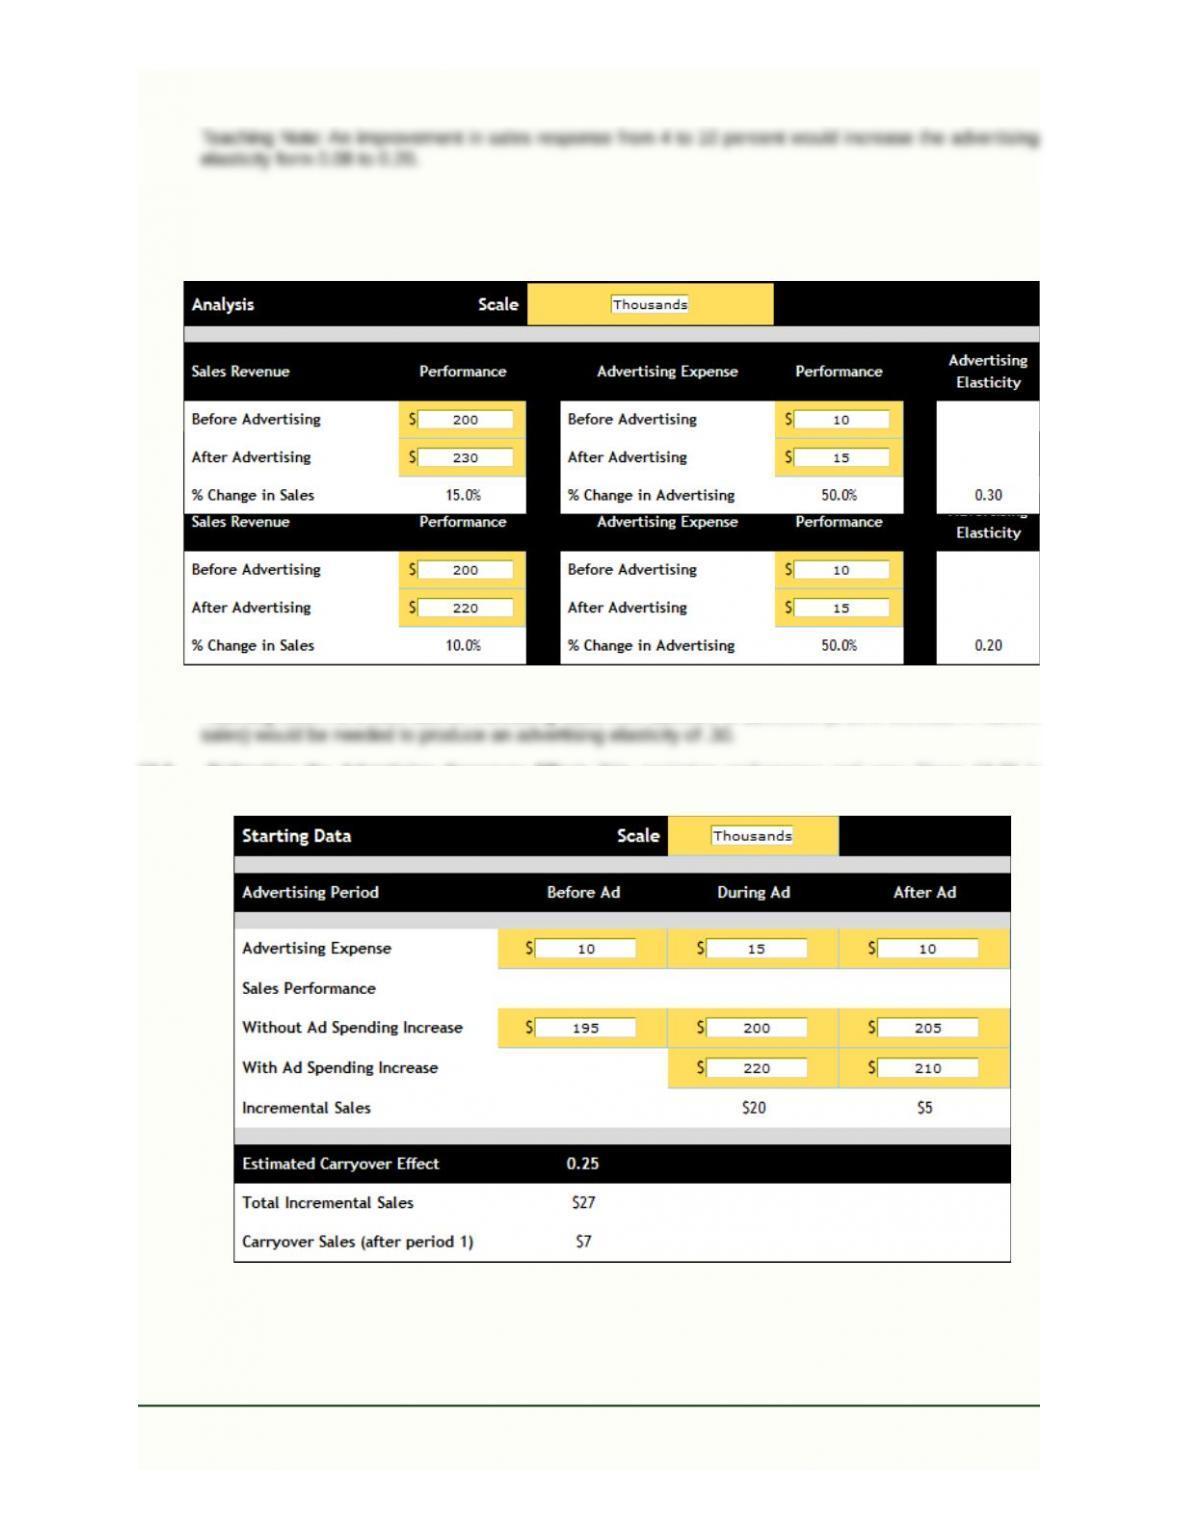
A. Using the data provided, how does the advertising elasticity change when the increase in sales after
advertising is 10 percent instead of 4 percent?
B. What level of sales is needed to produce an advertising elasticity of .30, given the same increase in the
advertising budget as in question A?
Teaching Note: As shown above, increasing sales from $200,00 to $230,000 (a 15% increase in current
10.3 Estimating the Advertising Carryover Effect: This marketing performance tool uses Figure 10-22 in
answering questions A and B.
Market-Based Management Copyright © 2012
Sixth Edition –41– Pearson Education, Inc.
Instructor’s Manual– Chapter 4 Publishing as Prentice Hall
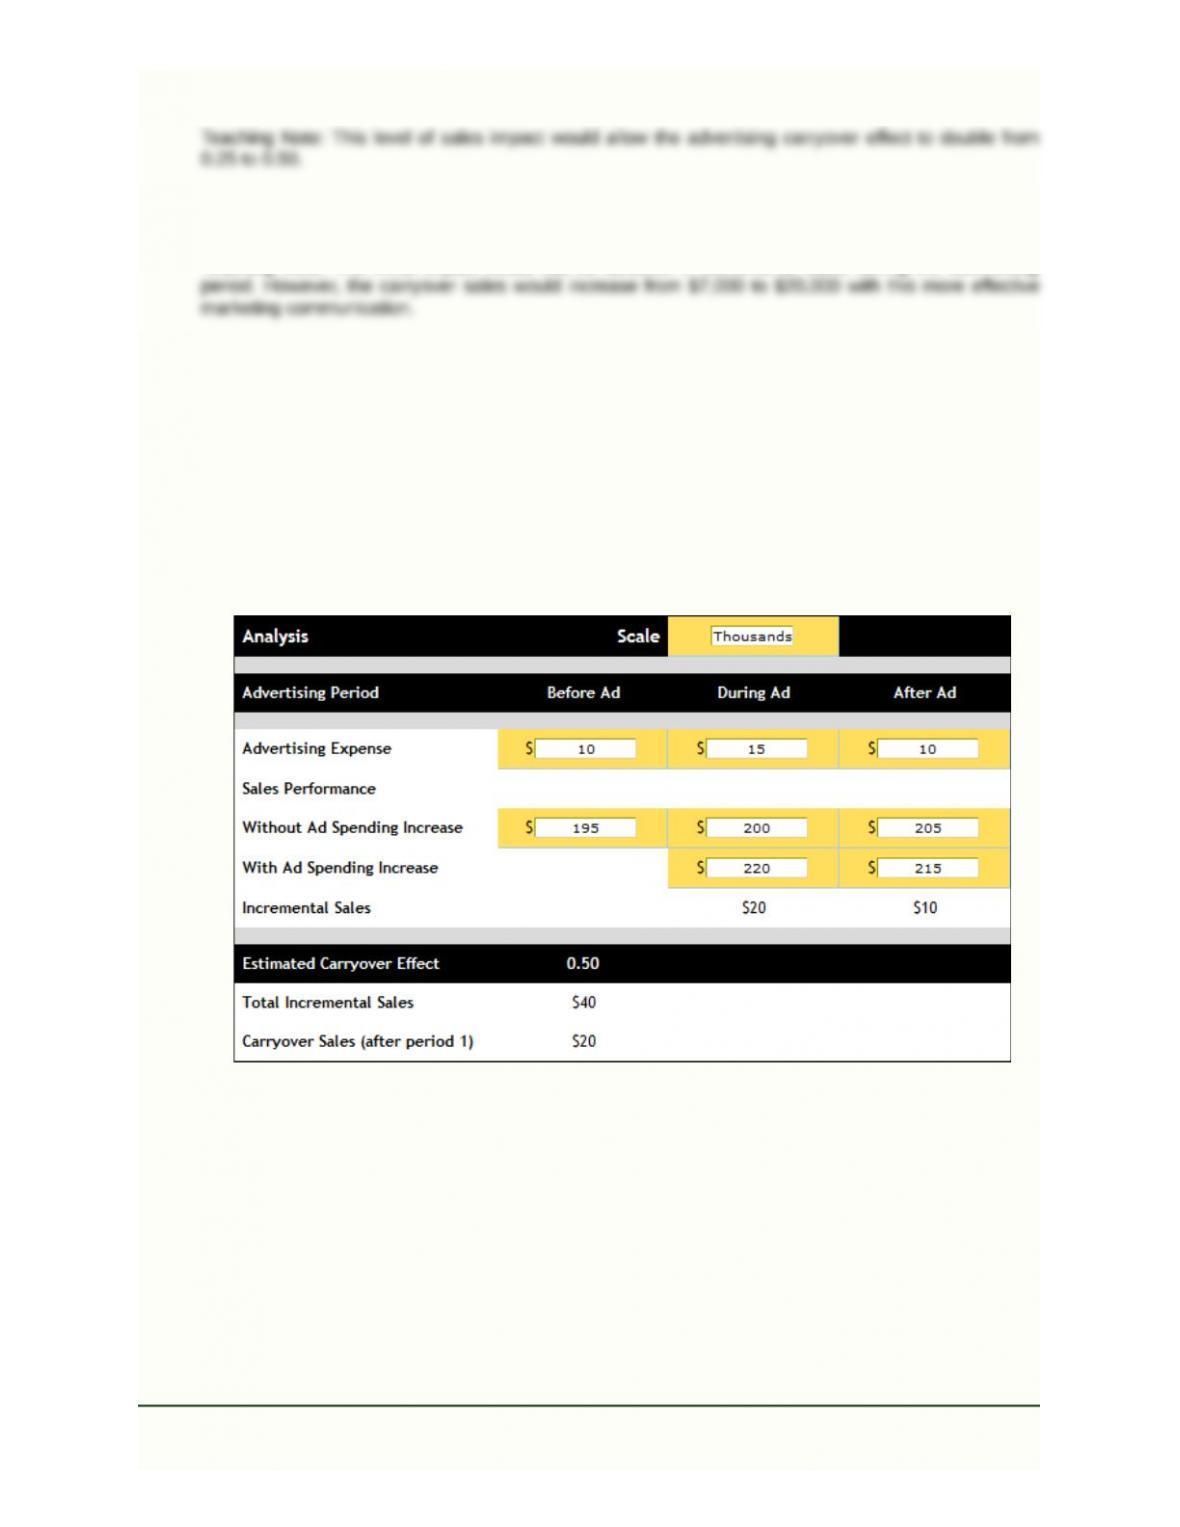
A. Using the data provided, how does the carryover effect change when the incremental sales revenue
after advertising is $10,000 rather than $5,000?
B. How does the new carryover effect (estimated in the previous question) affect the overall incremental
sales of the marketing communications effort?
Teaching Note: The initial impact would still be $20,000 in incremental sales during the advertising
Market-Based Management Copyright © 2012
Sixth Edition –42– Pearson Education, Inc.
Instructor’s Manual– Chapter 4 Publishing as Prentice Hall