Marketing Performance Tools and Application Exercises
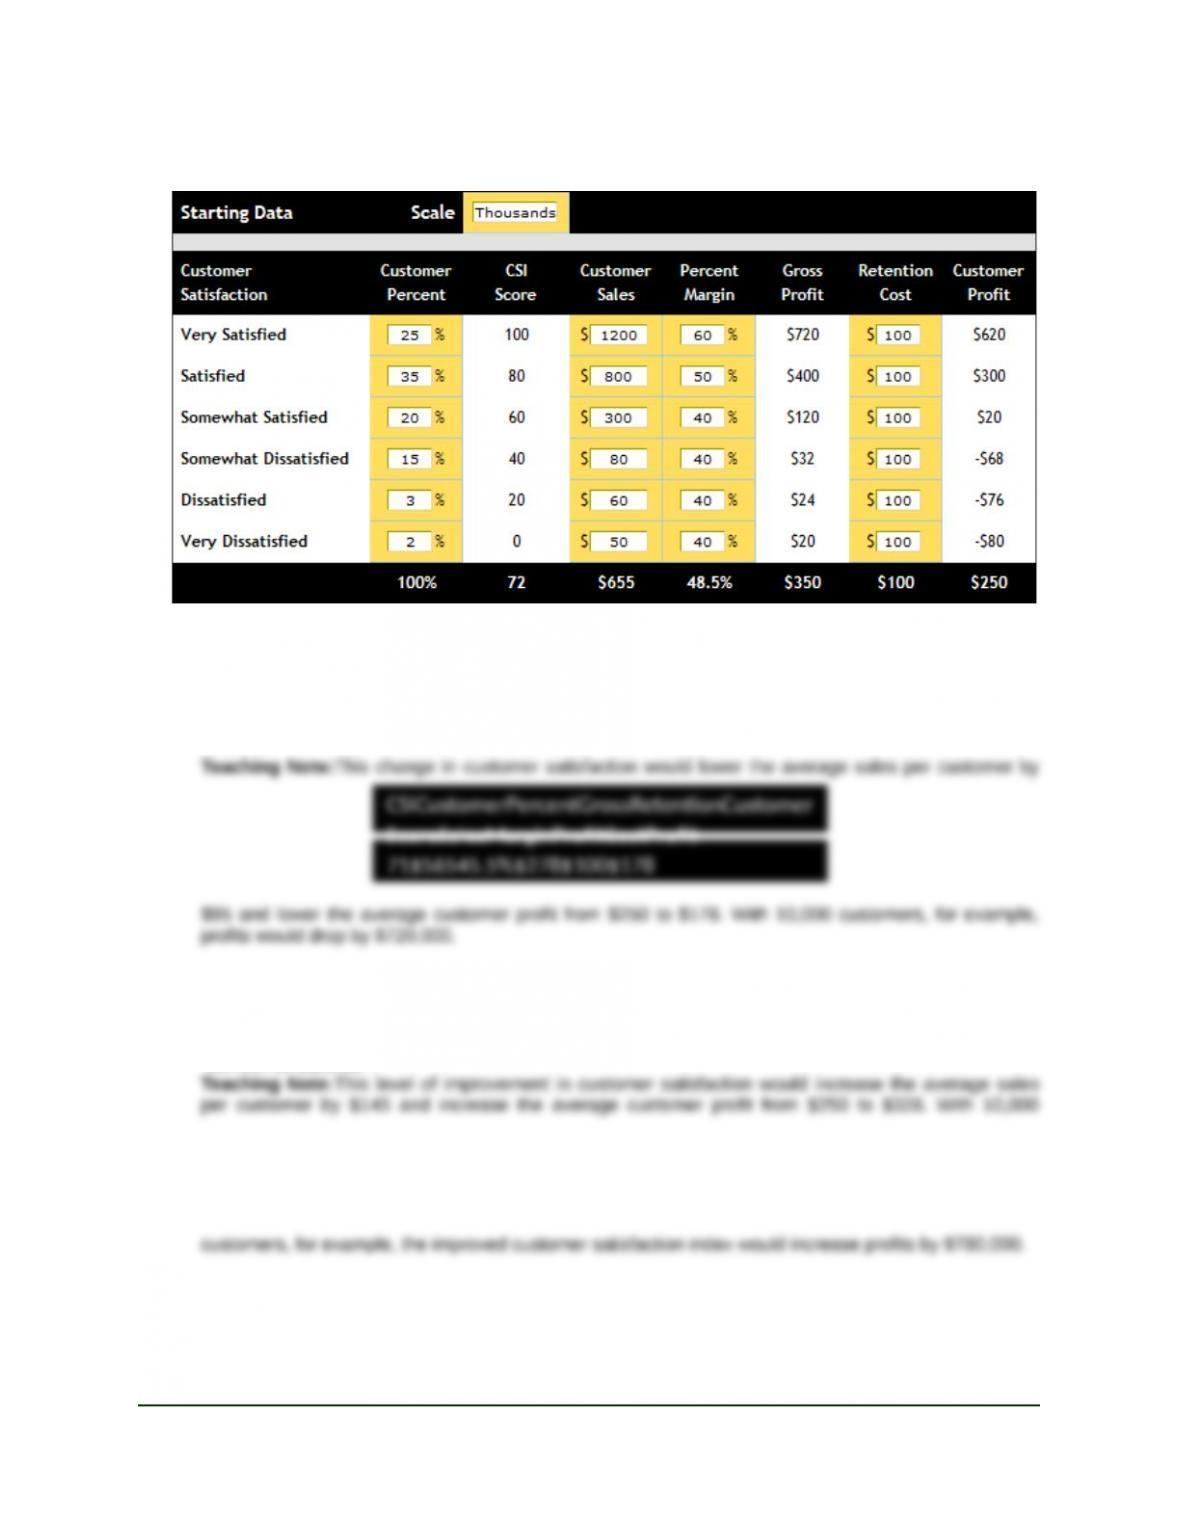
1.1 Customer Satisfaction and Profitability:Figure 1-6 is used with this marketing performance tool to
answer analysis questions A (below) and B (next page). The starting data are shown here to make
comparisons to the analysis questions easy.
A. How would average customer sales and average customer profit change for a business with 10 percent
“very satisfied” customers, 35 percent “satisfied” customers, and 55 percent “somewhat satisfied”
customers?
B. How would the average customer sales and average customer profit change if this business was able
to shift customer satisfaction to 35 percent “very satisfied,” 35 percent “satisfied,” and 30 percent
“somewhat satisfied”?
Market-Based Management Copyright © 2012
Sixth Edition –1– Pearson Education, Inc.
Instructor’s Manual– Chapter 1 Publishing as Prentice Hall
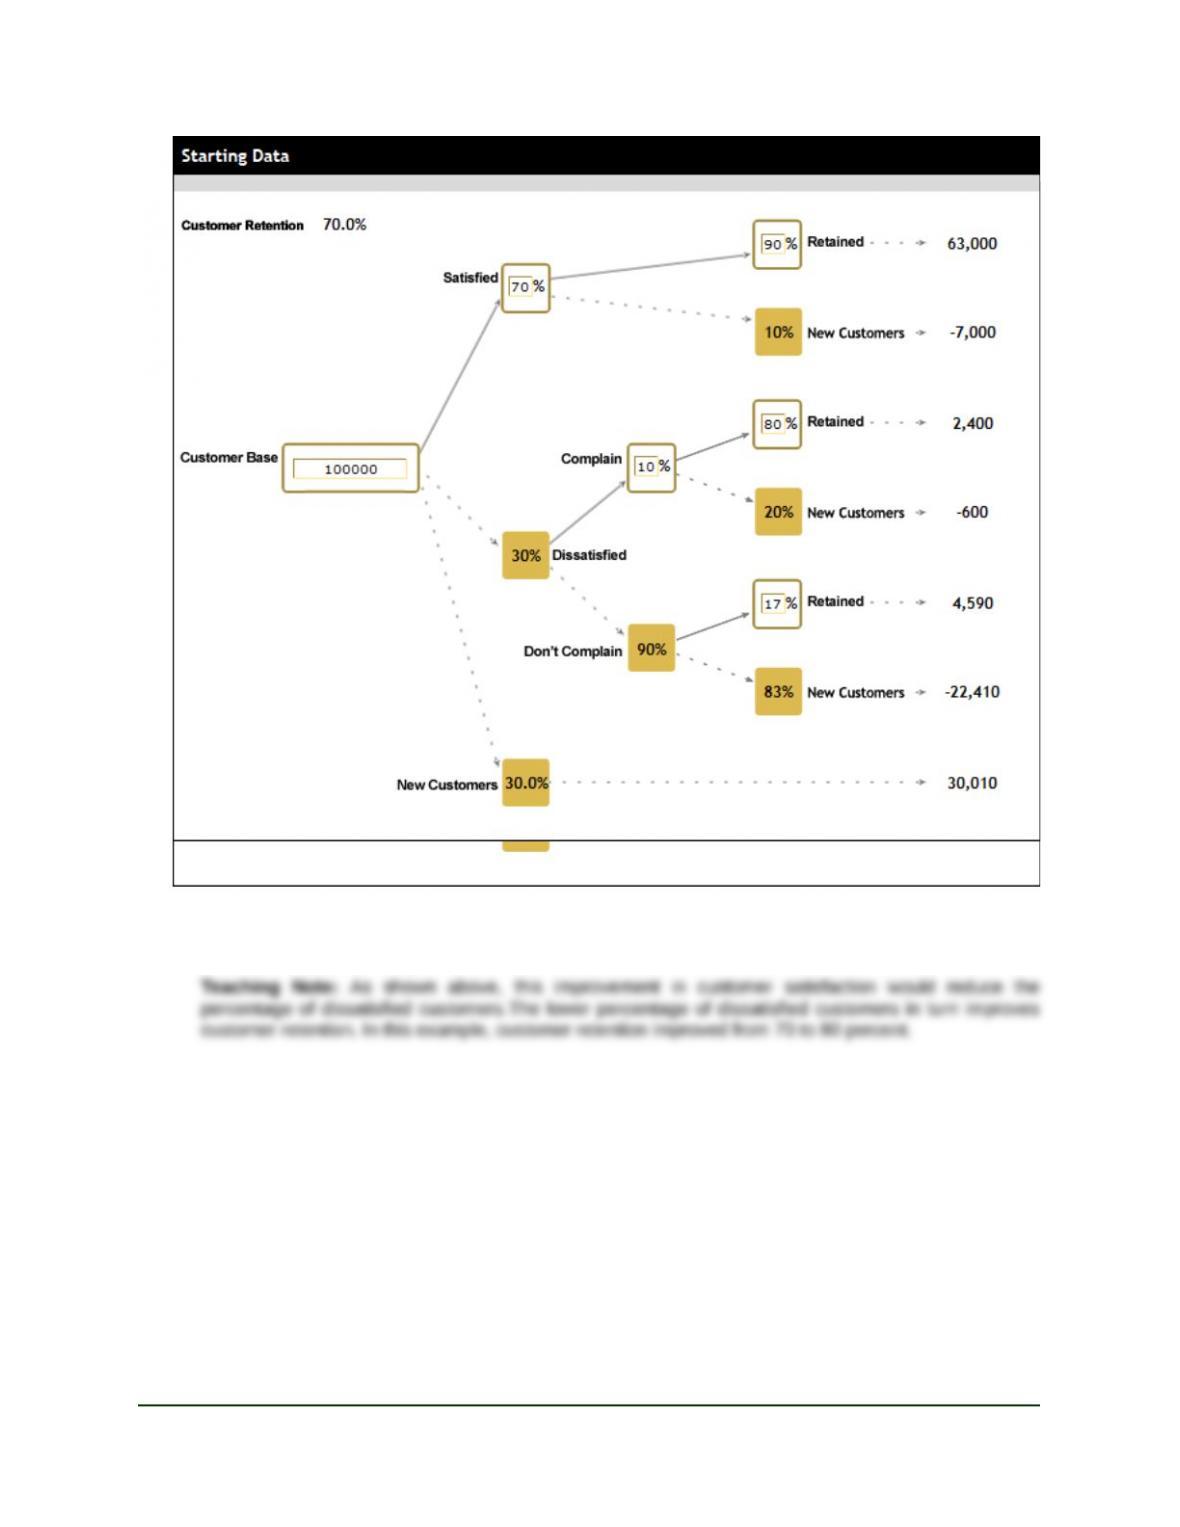
1.2 Customer Retention:Figure 1-7 is used with this marketing performance tool to answer questions A
(next page) and B on page 8.
A. How would customer retention change if the percentage of all dissatisfied customers decreased to 15
percent and the percentage of all satisfied customers increased to 85 percent?
Market-Based Management Copyright © 2012
Sixth Edition –2– Pearson Education, Inc.
Instructor’s Manual– Chapter 1 Publishing as Prentice Hall
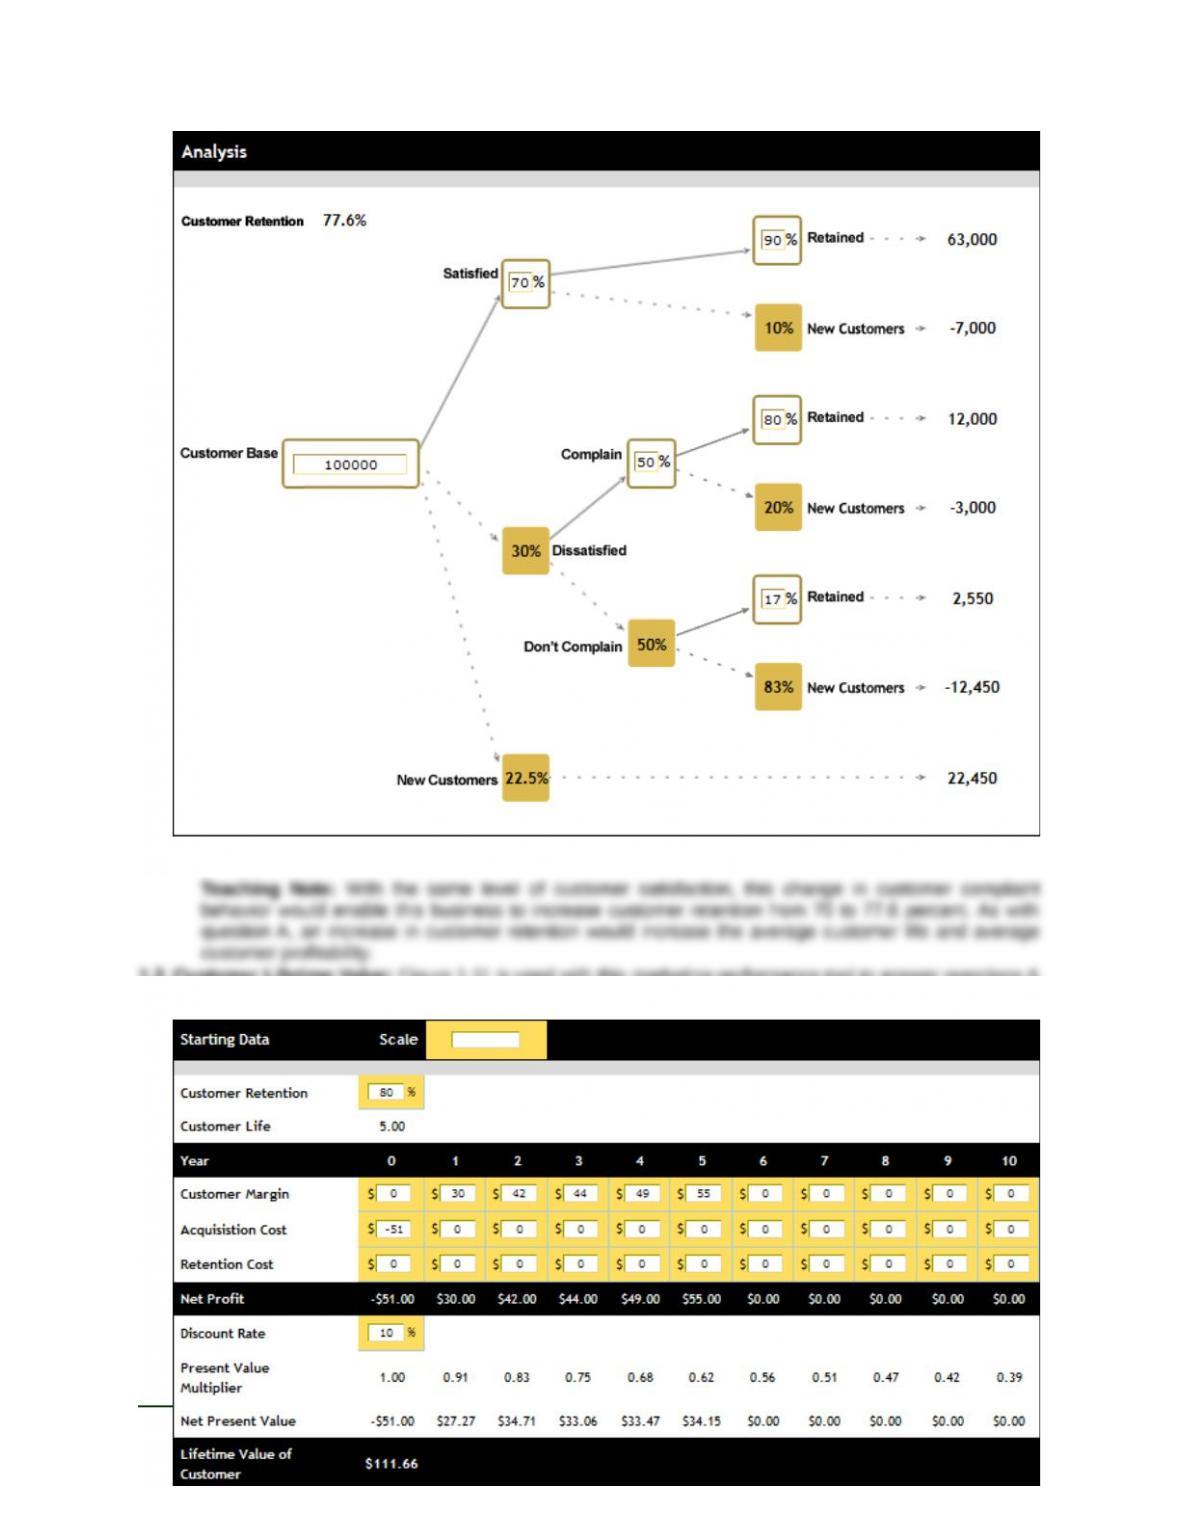
B. Using the original data, how would customer retention change if the percentage of customers who
complained increased from 10 to 50 percent?
1.3 Customer Lifetime Value: Figure 1-11 is used with this marketing performance tool to answer questions A
and B below.
Market-Based Management Copyright © 2012
Sixth Edition –3– Pearson Education, Inc.
Instructor’s Manual– Chapter 1 Publishing as Prentice Hall
A. How would the lifetime value of the average customer change if the customer life was shortened from 5
to 4 years?
B. How would the lifetime value change if the customer life was extended from 5 to 6 years and in year 6
the net cash flow was $60?
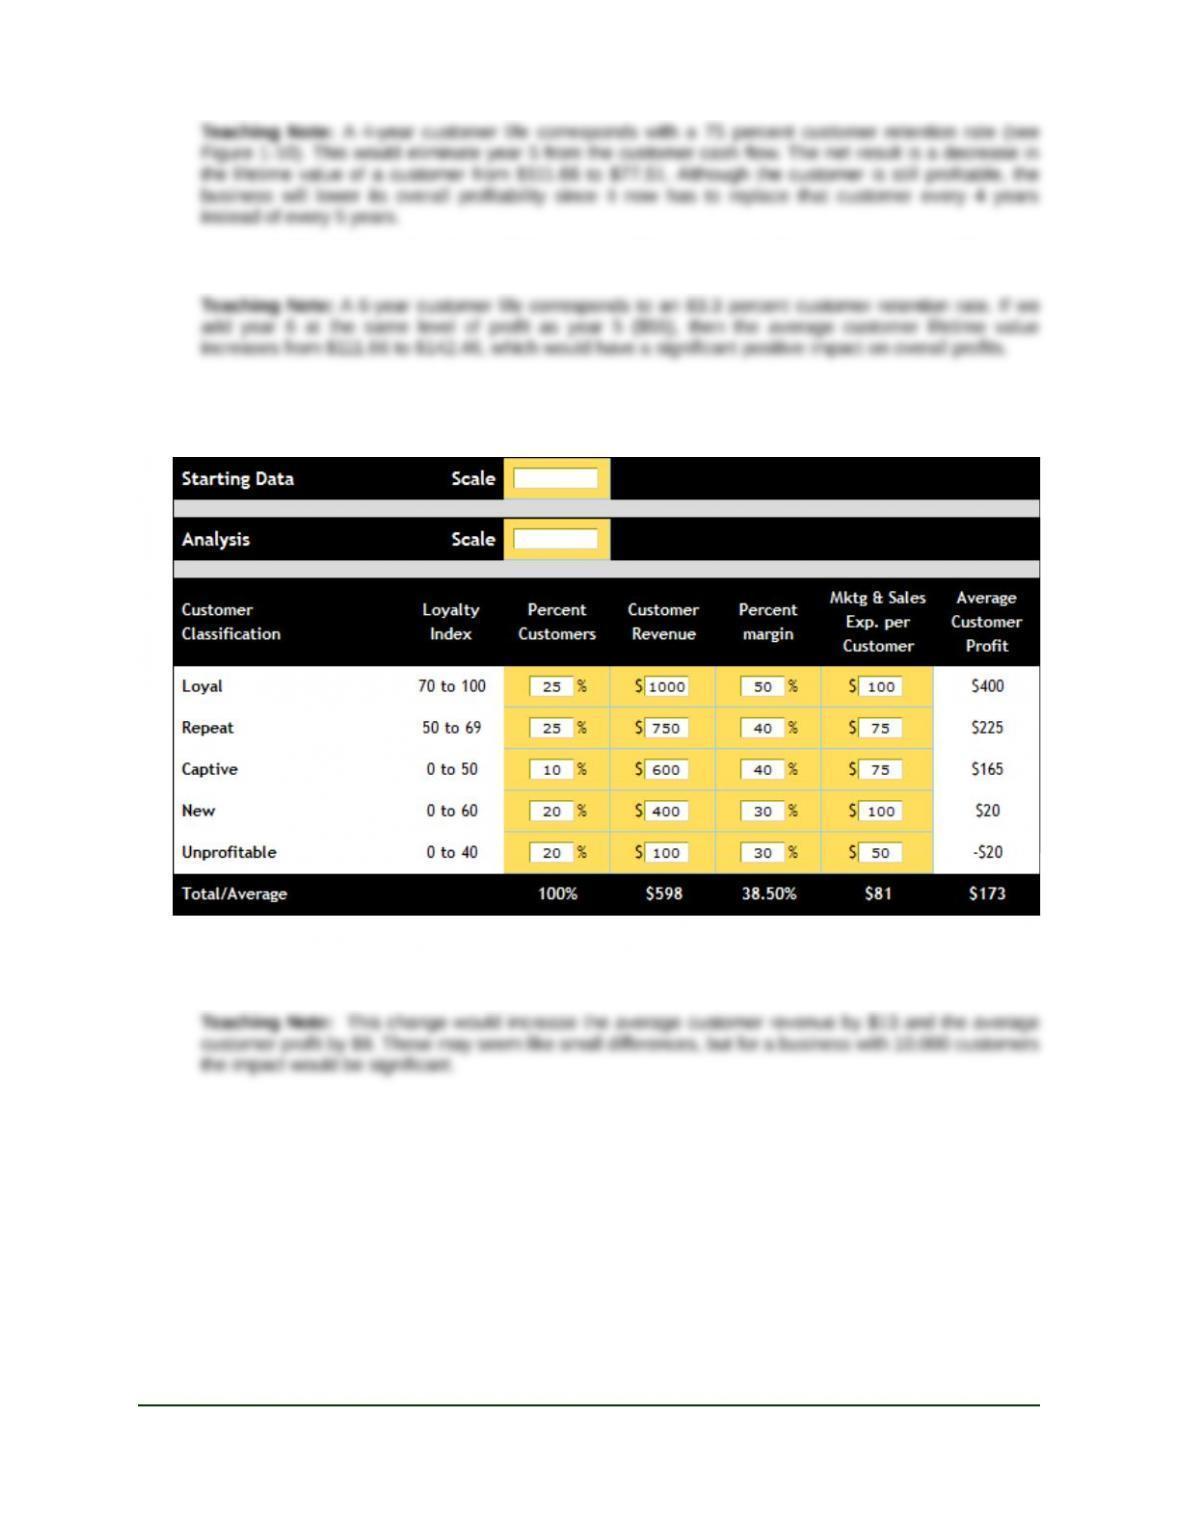
1.4 Customer Loyalty and Profitability: Figure 1-17 is used with this marketing performance tool to answer
analysis questions A and Bon the next page. The starting data are shown here to make comparisons to the
analysis questions easy.
A. How would the average customer profitability change with 25 percent loyal and 25 percent repeat
customers?
Market-Based Management Copyright © 2012
Sixth Edition –4– Pearson Education, Inc.
Instructor’s Manual– Chapter 1 Publishing as Prentice Hall
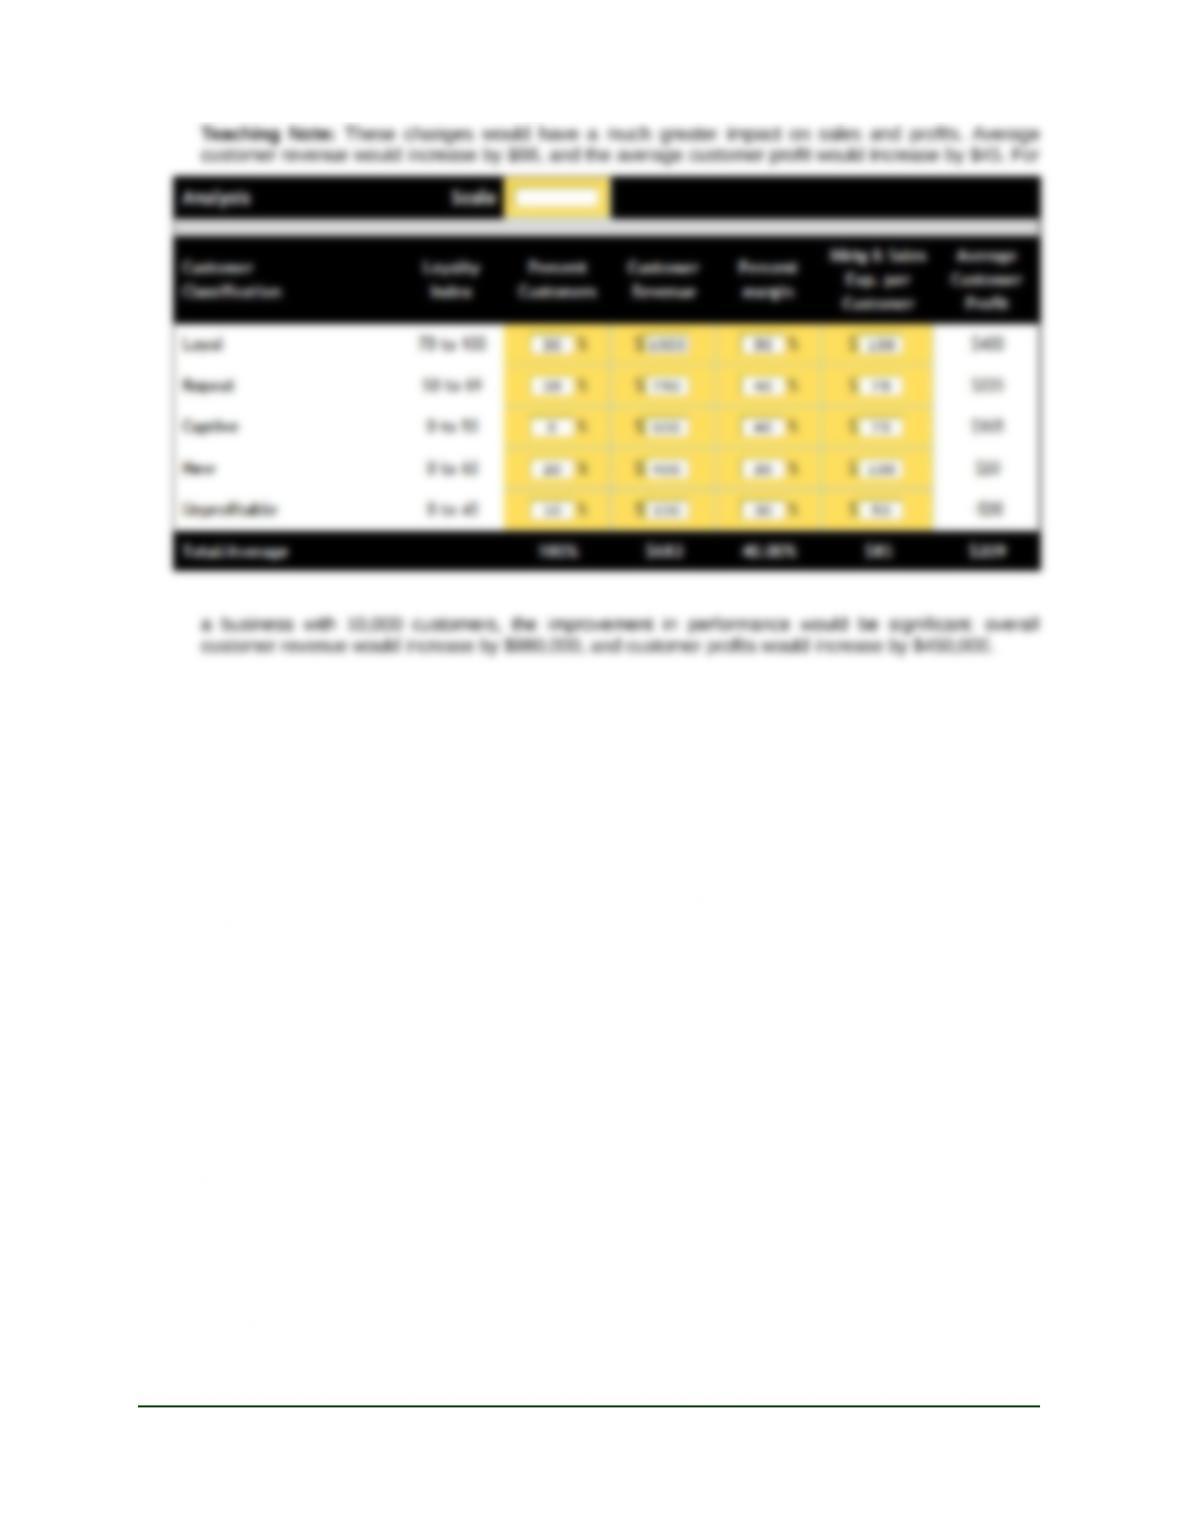
B. How would the average customer profit change with the following loyalty: 30 percent loyal, 35 percent
repeat, 5 percent captive, 20 percent new, and 10 percent unprofitable?
Market-Based Management Copyright © 2012
Sixth Edition –5– Pearson Education, Inc.
Instructor’s Manual– Chapter 1 Publishing as Prentice Hall