Year 0 Year 1 Year 2 Year 3 Year 4 Year 5 Year 6 Year 7 Year 8
Assumptions:
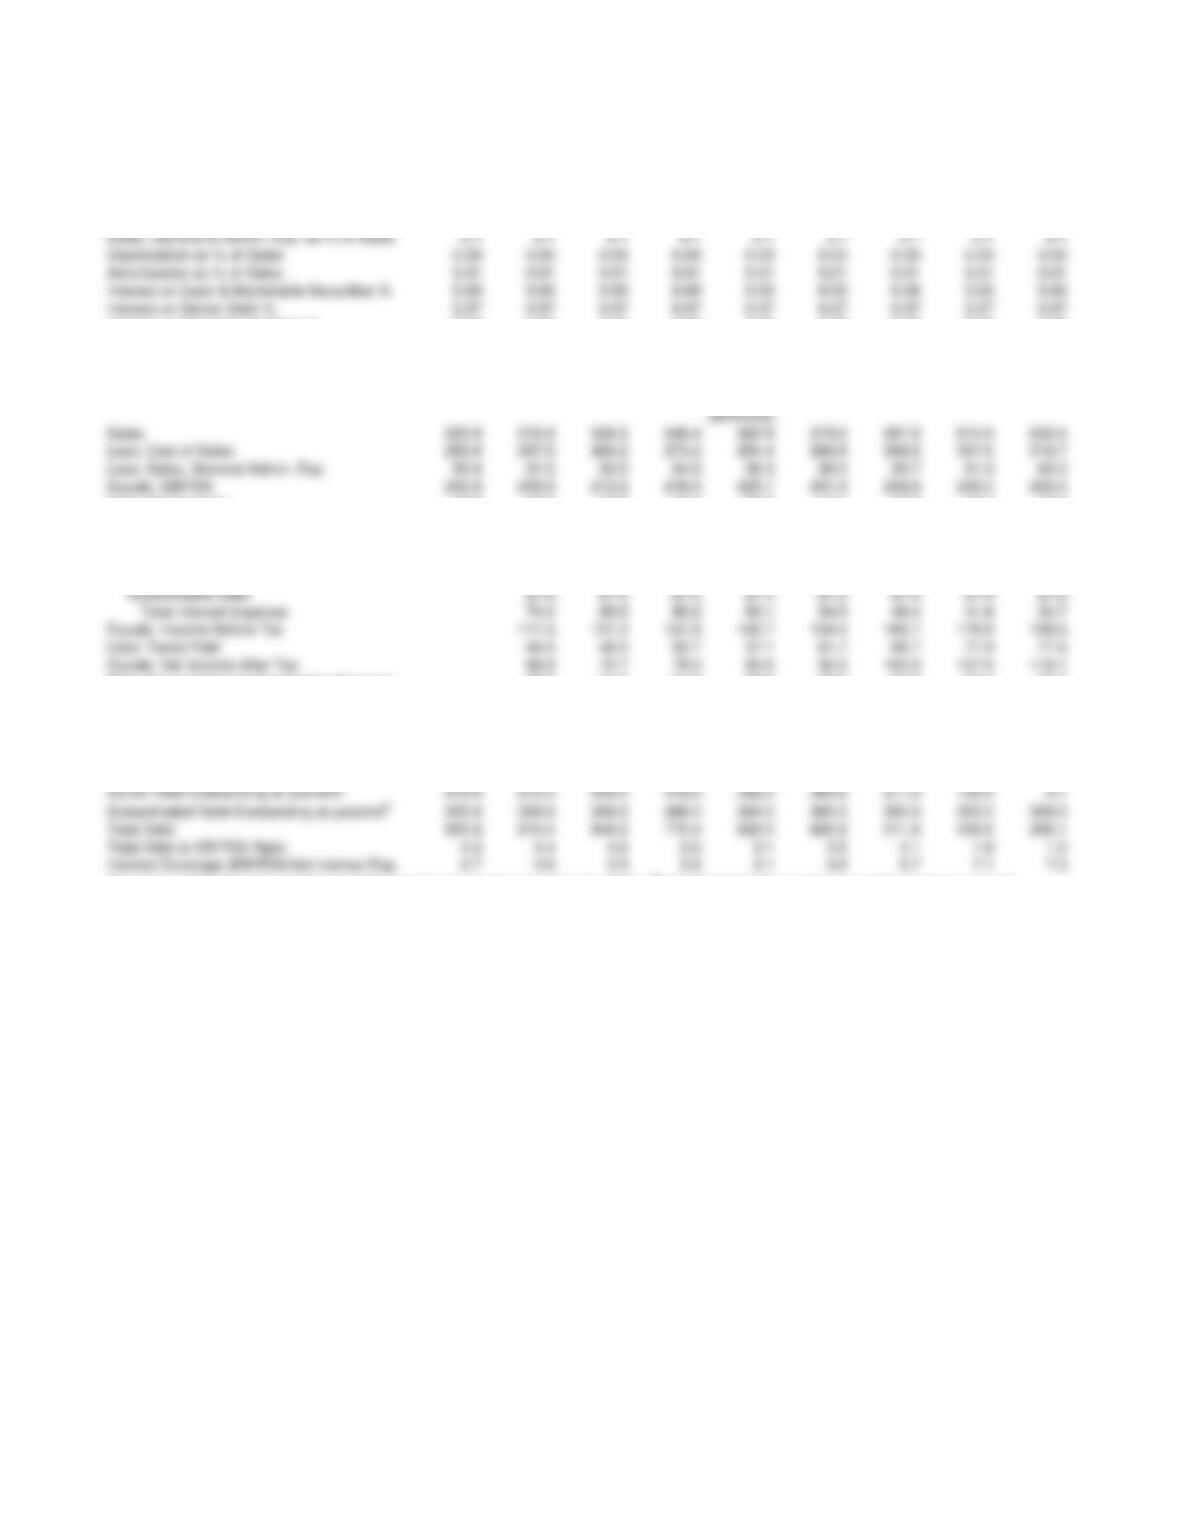
Sales Growth % 0 1.03 1.03 1.03 1.03 1.03 1.03 1.03 1.03
Cost of Sales (COS) as % of Sales 0.5 0.5 0.5 0.5 0.5 0.5 0.5 0.5 0.5
Sales, General & Admin. Exp. as % of Sales 0.1 0.1 0.1 0.1 0.1 0.1 0.1 0.1 0.1
Depreciation as % of Sales 0.03 0.03 0.03 0.03 0.03 0.03 0.03 0.03 0.03
Amortization as % of Sales 0.01 0.01 0.01 0.01 0.01 0.01 0.01 0.01 0.01
Interest on Cash & Marketable Securities % 0.03 0.03 0.03 0.03 0.03 0.03 0.03 0.03 0.03
Interest on Senior Debt % 0.07 0.07 0.07 0.07 0.07 0.07 0.07 0.07 0.07
Interest on Subordinated Debt % 0.09 0.09 0.09 0.09 0.09 0.09 0.09 0.09 0.09
Tax rate 0.4 0.4 0.4 0.4 0.4 0.4 0.4 0.4 0.4
Cash & Marketable Securities as % Sales 0.01 0.01 0.01 0.01 0.01 0.01 0.01 0.01 0.01
Change in Working Capital as % of Sales 0.02 0.02 0.02 0.02 0.02 0.02 0.02 0.02 0.02
Capital Expenditues as % of Sales 0.03 0.03 0.03 0.03 0.03 0.03 0.03 0.03 0.03
Sales 500.0 515.0 530.5 546.4 562.8 579.6 597.0 614.9 633.4
Less: Cost of Sales 250.0 257.5 265.2 273.2 281.4 289.8 298.5 307.5 316.7
Less: Sales, General Admin. Exp. 50.0 51.5 53.0 54.6 56.3 58.0 59.7 61.5 63.3
Equals: EBITDA 200.0 206.0 212.2 218.5 225.1 231.9 238.8 246.0 253.4
Less: Depreciation 15.0 15.5 15.9 16.4 16.9 17.4 17.9 18.4 19.0
Less: Amortization 5.0 5.2 5.3 5.5 5.6 5.8 6.0 6.1 6.3
Plus: Interest Income 0.2 0.2 0.2 0.2 0.2 0.2 0.2 0.2 0.2
Less: Interest Expense
Senior Debt 47.3 42.9 38.2 33.1 27.5 21.4 14.8 7.7
Subordinated Debt 27.0 27.0 27.0 27.0 27.0 27.0 27.0 27.0
Equals: Income Before Tax 111.3 121.2 131.6 142.7 154.4 166.7 179.8 193.5
Less: Taxes Paid 44.5 48.5 52.7 57.1 61.7 66.7 71.9 77.4
Equals: Net Income After Tax 66.8 72.7 79.0 85.6 92.6 100.0 107.9 116.1
Plus: Depareciation & Amortization Expense 20.6 21.2 21.9 22.5 23.2 23.9 24.6 25.3
Less Change in Working Capital 10.3 10.6 10.9 11.3 11.6 11.9 12.3 12.7
Less Capital Expenditures 15.5 15.9 16.4 16.9 17.4 17.9 18.4 19.0
Equals: Cash Avaliable for Debt Reduction 61.6 67.4 73.5 80.0 86.8 94.1 101.7 109.8
Cash Balance 5.0 5.2 5.3 5.5 5.6 5.8 6.0 6.1 6.3
Senior Debt Outstanding at yearend1675.0 613.4 546.0 472.4 392.5 305.6 211.6 109.9 0.1
Total Debt 900.0 913.4 846.0 772.4 692.5 605.6 511.6 409.9 300.1
Total Debt to EBITDA Ratio 4.5 4.4 4.0 3.5 3.1 2.6 2.1 1.6 1.2
Interest Coverage (EBITDA/Net Interest Exp. 2.7 3.0 3.3 3.6 4.1 4.8 5.7 7.1 7.3
($Millions)
Problem 13-11 Solution to Part B
1Assumes 100% of cash available for debt reduction is used to pay off senior debt. 2Subordinated debt payable as a balloon note in year 10.