.1482 shares of its American Depository Shares3 for each outstanding common share of Baxalta in January 2016. At
closing, Shire shareholders will own 66% of the combined firms and Baxalta shareholders the remainder, which
appeared to preserve the tax status of the spinoff.4
M&A negotiations are by their nature dynamic in that the circumstances surrounding a takeover attempt can
change quickly requiring decision makers to evaluate their options in “real time” to bring the negotiations to a
Shire would be able to determine the implications of an all stock versus a cash and stock deal on the combined
firms’ earnings per share and credit rating due to the resulting increased leverage, as well as postclosing ownership
distribution. Such models provide estimates of synergy from potential cost savings or revenue enhancements needed
to determine if the proposed purchase premium could be earned back within a reasonable time period enabling the
firm to earn its cost of capital. Moreover, models could be used to display on a proforma (or adjusted) basis the
compensated at least for the amount of additional value they are contributing to the merged companies.
Models also assist in evaluating the impact of target defenses such as a poison pill on the cost of the deal to the
acquirer. Baxalta’s poison pill defense would have been triggered when a suitor unwanted by the board acquired
more than a 9.9% stake in the business. Removing this pill would have been particularly difficult because of
Baxalta’s staggered board in which its directors serve three–year, overlapping terms, meant that it would take Shire
of the acquirer to finance the deal.
Comcast Bids for Time Warner Cable—Evaluating Proposals and Counter Proposals
A sometimes bitter eight month long struggle between Charter Communications Inc. (Charter) and Time Warner
Cable Inc. (TWC) came to an end with the joint announcement by Comcast Corporation (Comcast) on February 14,
2014 that it had signed a merger agreement with TWC. The deal involved the merger of the largest and second
largest cable companies in terms of subscribers in the U.S. and faced major regulatory hurdles if it were to reach
3 An American Depository Share is a stock trading on a U.S. exchange that represents a specific number of shares in
a foreign firm.
4 Shire’s revised bid is predicated on their belief that the deal will not trigger a tax liability for Baxter International
as long as it can show that there the deal negotiated with Baxalta was not negotiated as part of a plan developed
prior to the spin-off by Baxter. As part of the spinoff agreement with Baxter, Shire would be required to reimburse
Baxter for tax liability it might incur as a consequence of the spinoff.
the purchase price and its composition.
Comcast had also been talking with Charter about possibly participating in Charter’s bid for TWC during late
2013, but those talks broke down on February 4, 2014 according to SEC filings. Within a few days Comcast’s board
authorized CEO Brian Roberts to offer $150 per share for all outstanding TWC shares to be paid in Comcast shares
on the condition there would be no breakup fee if regulatory approval could not be achieved. The pace of
discussions intensified with TWC responding on February 6, 2014 saying it would agree to a deal without a breakup
fee as long as Comcast offered a price of $160 per share. The final all-stock deal was signed a week later based on
expensive and perhaps protracted proxy battle with Charter over TWC’s board representation.
The final agreement reflected the intensity of the last minute discussions with neither side getting all it wanted.
Comcast paid far more than what it had hoped but did avoid a breakup fee and having to use cash as a portion of the
purchase price. The final purchase price was very close to what TWC’s CEO Rob Marcus had stated publicly as the
announcement, Comcast said it would expand its share repurchase program to $10 billion to begin at the end of 2014
to offset some of the potential dilutive effects of issuing new Comcast shares in exchange for TWC shares.
Strategically, the deal made sense for Comcast. Combining TWC and Comcast is expected to generate $1.5
billion in ongoing annual cost savings, with one-half occurring in the first year. The deal is expected to be accretive
(increasing EPS) for Comcast shareholders and reflected an attractive premium for TWC shareholders. However,
Comcast could wield too much power in negotiating with content owners. In addition, critics opined that Comcast
could exert too much influence over the broadband infrastructure by unfairly blocking or slowing the traffic of
online video competitors to the benefit of their own services (thereby violating the so–called net neutrality
principle).5
Comcast stated publicly that they would sell three million of TWC’s eleven million subscribers to other cable
their options quickly to bring the negotiations to a satisfactory conclusion. Financial models often serve as an
important tool in such situations.
Using proforma financial statements to illustrate what the combined firms would look like, Comcast was able to
determine the implications of an all stock versus a cash and stock deal on the combined firms’ earnings per share
and credit rating. Such models provided estimates of potential synergy needed to determine if the proposed purchase
to finish, financial models can play a key role in the M&A process.
Mars Buys Wrigley in One Sweet Deal
Under considerable profit pressure from escalating commodity prices and eroding market share, Wrigley
Corporation, a U.S.-based leader in gum and confectionery products, faced increasing competition from Cadbury
Schweppes in the U.S. gum market. Wrigley had been losing market share to Cadbury since 2006. Mars
premium to Wrigley‘s closing share price of $62.45 on the announcement date. The merged firms in 2008 would
have a 14.4 percent share of the global confectionary market, annual revenue of $27 billion, and 64,000 employees
worldwide. The merger of the two family–controlled firms represents a strategic blow to competitor Cadbury
Schweppes’s efforts to continue as the market leader in the global confectionary market with its gum and chocolate
business. Prior to the announcement, Cadbury had a 10 percent worldwide market share.
place after closing.
The combined companies would have substantial brand recognition and product diversity in six growth
categories: chocolate, nonchocolate confectionary, gum, food, drinks, and pet care products. While there is little
product overlap between the two firms, there is considerable geographic overlap. Mars is located in 100 countries,
5 Net neutrality refers to internet service providers and governments treating all data on the internet equally and
not discriminating or charging different users and content providers different rates.
while Wrigley relies heavily on independent distributors in its growing international distribution network.
Furthermore, the two firms have extensive sales forces, often covering the same set of customers.
While mergers among competitors are not unusual, the deal’s highly leveraged financial structure is atypical of
transactions of this type. Almost 90 percent of the purchase price would be financed through borrowed funds, with
the remainder financed largely by a third-party equity investor. Mars’s upfront costs would consist of paying for
closing costs from its cash balances in excess of its operating needs. The debt financing for the transaction would
Discussion Questions:
1. Why was market share in the confectionery business an important factor in Mars’ decision to acquire
Wrigley?
Answer: Firm’s having substantial market relative to their next largest competitor are likely to have lower
2. It what way did the acquisition of Wrigley’s represent a strategic blow to Cadbury?
3. How might the additional product and geographic diversity achieved by combining Mars and Wrigley
benefit the combined firms?
4. Speculate as to the potential sources of synergy associated with the deal. Based on this speculation what
additional information would you want to know in order to determine the potential value of this synergy?
Answer: The product offerings of the two firms show little duplication. Therefore, there is significant
potential for cross-selling each firm’s products into the other’s customers. This would require training the
sales forces in each firm’s product offering. The cost of this training would need to be estimated and
5. Given the terms of the agreement, Wrigley shareholders would own what percent of the combined
companies? Explain your answer
Tribune Company Acquires the Times Mirror Corporation
in a Tale of Corporate Intrigue
Background: Oh, What Tangled Webs We Weave. .
.
CEO Mark Willes had reason to be optimistic about the future. Operating profits had grown at a double–digit rate,
and earnings per share had grown at a 55% annual rate between 1995 to 1999. Many shareholders appeared to be
satisfied. However, some were not. Although pleased with the improvement in profitability, they were concerned
about the long-term growth prospects of the firm. Reflecting this disenchantment, Times Mirror’s largest
shareholder, the Chandler family, was contemplating the sale of the company and along with it the crown jewel Los
Angeles Times. It had been assumed for years that the Chandler family trusts made a sale of Times Mirror out of the
question. The Chandler’s super voting stock (i.e., stock with multiple voting rights) allowed them to exert a
disproportionate influence on corporate decisions. The Chandler Trusts controlled more than two-thirds of voting
shares, although the family owned only about 28% of the total shares of the outstanding stock.
In May 1999 the Tribune Chairman John Madigan contacted Willes and made an offer for the company, but Willes,
with the help of his then-chief financial officer (CFO), Thomas Unterman, made it clear to Madigan that the
company was not for sale. What Willes did not realize was that Unterman soon would be serving in a dual role as
CFO and financial adviser to the Chandlers and that he would eventually step down from his position at Times
Mirror to work directly for the family. In his dual role, he worked without Willes’ knowledge to structure the deal
with the Tribune.
Following months of secret negotiations, the Chicago-based Tribune Company and the Times Mirror Corporation
announced a merger of the two companies in a cash and stock deal valued at approximately $7.2 billion, including
$5.7 billion in equity and $1.5 billion in assumed debt. The transaction, announced March 13, 2000, created a media
giant that has national reach and a major presence in 18 of the nation’s top 30 U.S. markets, including New York,
Los Angeles, and Chicago. The combined company has 22 television stations, four radio stations, and 11 daily
newspapers—including the Los Angeles Times, the nation’s largest metropolitan daily newspaper and flagship of the
Times Mirror chain.
Transaction Terms: Tribune Shareholders Get Choice of Cash or Stock
The Tribune agreed to buy 48% of the outstanding Times Mirror stock, about 28 million shares, through a tender
offer. After completion of the tender offer, each remaining Times Mirror share would be exchanged for 2.5 shares of
Tribune stock. Under the terms of the transaction, Times Mirror shareholders could elect to receive $95 in cash or
2.5 shares of Tribune common stock in exchange for each share of Times Mirror stock. Holders of 27.2 million
shares of Times Mirror stock elected to receive Tribune stock, whereas holders of 10.6 million elected to receive
cash. Because the amount of cash offered in the merger was limited and the cash election was oversubscribed, Times
Mirror shareholders electing to receive cash actually received a combination of cash and stock on a pro rata basis
(Table 1).
Table 1. Times Mirror Transaction Terms
As of June 12, 2000 Transaction Value
Times Mirror Shares Outstanding @ 3/13/00 59,700,000
No. of Times Mirror Shares Exchanged for 2.3
Shares of Tribune Stock 27,238,253 $2,587,634,0351
No. of Times Mirror Shares Exchanged for Cash 10,648,318 $1,011,536,9682
Times Mirror Shares Outstanding after Tender Offer 21,813,429
Times Mirror Shares 54,533,5735 $2,072,275,7743
Equity Value of Offer $5,671,446,777
Merger Announcement Date $2,805,900,0004
Premium 102%
3Equals 2.5 shares 21,813,429 $38 per Tribune share.
4Times Mirror share price on announcement date of $47 times 59,700,000.
5The total number of new Tribute shares issued equals 27,238,318 2.5 + 10,648,318 2.5 + 54,533, 573 or
137,537,013.
Newspaper Advertising Revenues Continue to Shrink
Most U.S. newspapers are mired in the mature or declining phase of their product life cycle. For the past half-
century, newspapers have watched their portion of the advertising market shrink because of increased competition
2000).
Tribune Company Profile: The Face of New Media?
Unlike the Times Mirror, Tribune has built its strategy around four business groups: broadcasting, publishing,
education, and interactive. The Tribune is also an equity investor in America Online and other leading internet
Financial Analysis
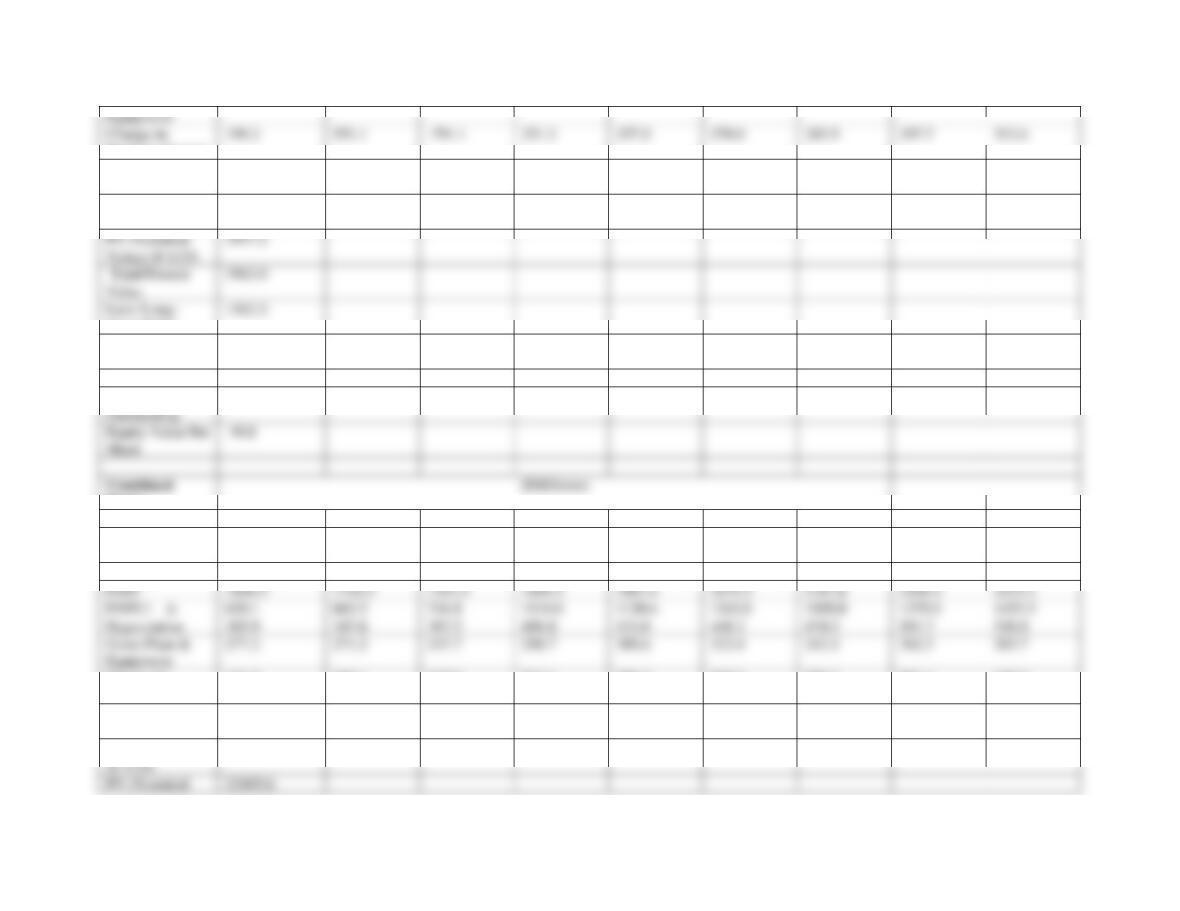
The present values of the Tribune, Times Mirror, and the combined firms are $8.5 billion, $2.4 billion, and $16.5
billion, respectively; the estimated present value of synergy is $5.6 billion (Table 3). This assumes that pretax cost
Total Annual Savings $200,000,000
1Assumes Tribune will close overlapping bureaus in United States (9) and most of the Times Mirror’s foreign
bureaus (21 abroad).
2As a result of bulk purchasing and more favorable terms with different suppliers, 15% of the newsprint expense of
the combined companies is expected to be saved.
3Layoffs of 120 L.A. Times Mirror Corporate Office personnel at an average salary of $125,000 and benefits equal
to 30% of base salaries. Total payroll expenses equal $19,500,000 (i.e., $125,000 1.3 120). Lease, travel and
entertainment, and other support expenses added another $14.5 million.
Source: Moore, Kathryn, Tim Schnabel, and Mark Yemma, “A Media Marriage,” paper prepared for Chapman
University, EMBA 696, May 18, 2000, p. 9.
Table 2. Annual Merger-Related Cost Savings

savings are phased in as follows: $25 million in 2000, $100 million in 2001, and $200 million thereafter. The cost
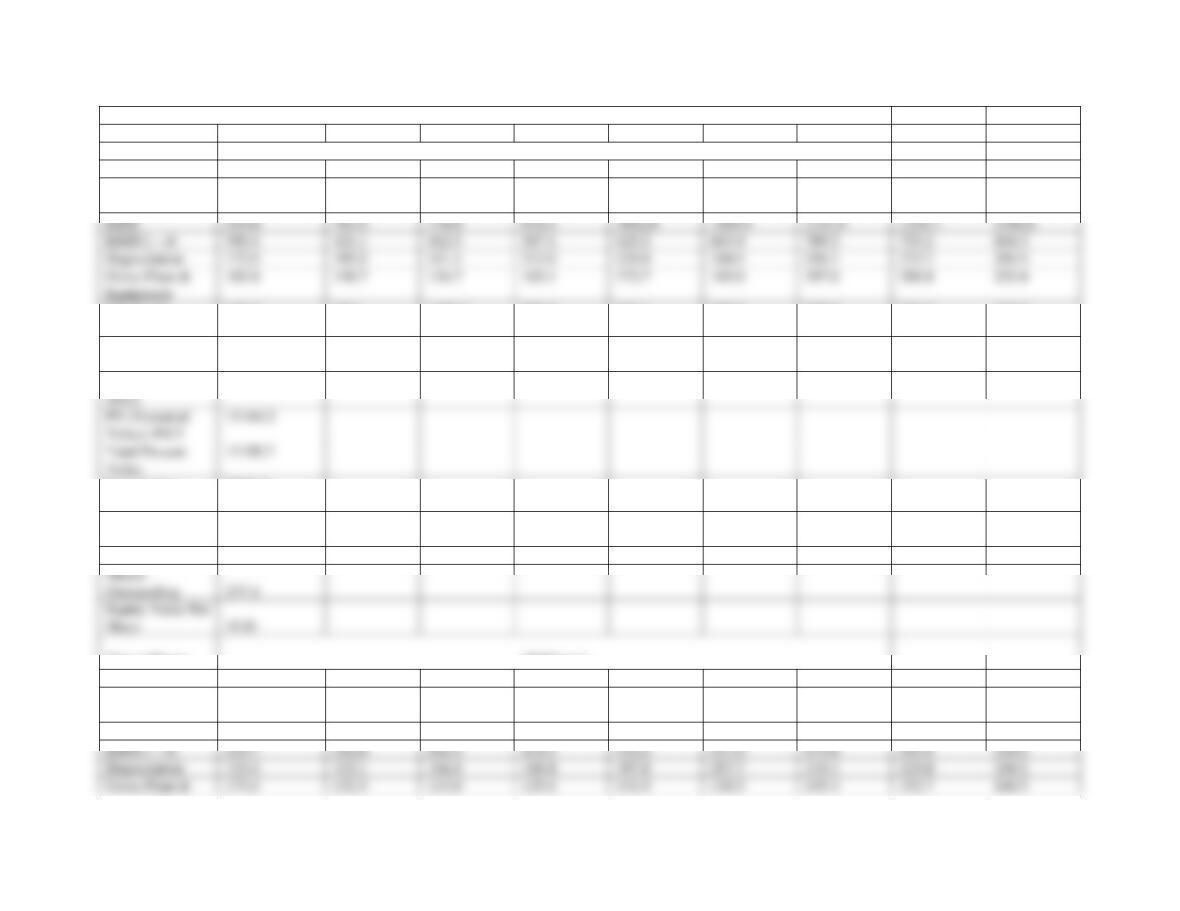
Table 3. Merger Evaluation
1997
1998
1999
2000
2001
2002
2003
2004
2005
Tribune
($ Millions)
Sales
2891.5
2980.9
3221.9
3261.5
3473.5
3699.3
3939.7
4195.8
4468.5
Operating
Expenses
2232.5
2279.0
2451.0
2283.1
2431.4
2589.5
2757.8
2937.1
3128.0
EBIT
559.0
701.9
770.9
978.5
1042.0
1109.8
1181.9
1258.7
1340.6
EBIT(1 – t)
395.4
421.1
462.5
587.1
625.2
665.9
709.2
755.2
804.3
Depreciation
172.5
195.5
221.1
212.0
225.8
240.5
256.1
272.7
290.5
Equipment
Change in
Working Capital
147.7
49.0
1107.0
260.9
243.1
258.9
275.8
293.7
312.8
Free Cash Flow
to Firm
511.8
427.9
-558.1
375.1
434.2
462.4
492.5
524.5
558.6
PV (2001–2005)
@8.5
51.5
PV (Terminal
11144.2
Less: Long-
Term Debt
2694.2
Plus: Excess
Cash Balances
0
Equity Value
8501.5
Shares
Outstanding
237.4
Equity Value Per
Share
35.81
Times Mirror
($Millions)
Sales
2728.2
2783.9
3029.2
3140.0
3297.0
3461.9
3634.9
3816.7
4007.5
Operating
Expenses
2337.0
2380.5
2558.7
2449.2
2571.7
2700.2
2835.3
2977.0
3125.9
EBIT
391.2
403.4
470.5
690.8
725.3
761.6
799.7
839.7
881.7
EBIT(1 – t)
234.7
242.0
282.3
414.5
435.2
457.0
479.8
503.8
529.0
Depreciation
133.4
152.1
166.4
188.4
197.8
207.7
218.1
229.0
240.5
Gross Plant &
173.4
131.5
113.0
125.6
131.9
138.5
145.4
152.7
160.3
Equipment
Working Capital
Change in
199.2
551.1
-791.1
251.2
257.2
270.0
283.5
297.7
312.6
Free Cash Flow
to Firm
-4.5
-288.5
1126.8
226.1
244.0
256.2
269.0
282.4
296.6
PV (2001–2005)
@ 9.5%
25.8
PV (Terminal
Value) @ 9.5%
Value
Less: Long-
1562.2
3937.2
Term Debt1
Plus: Excess
Cash Balances
0
Equity Value
2375.0
Shares
Outstanding
59.7
Equity Value Per
Share
39.8
Firms
Sales
5619.7
5764.8
6251.1
6401.5
6770.5
7161.1
7574.7
8012.5
8476.1
Operating
Expenses
4569.5
4659.5
5009.7
4732.3
5003.1
5289.7
5593.1
5914.1
6253.8
Synergy
25.0
100.0
200.0
200.0
200.0
200.0
EBIT
1050.2
1105.3
1241.4
1694.3
1867.4
2071.4
2181.6
2298.4
2422.2
EBIT(1 – t)
630.1
663.2
744.8
1016.6
1120.4
1242.8
1309.0
1379.0
1453.3
Depreciation
305.9
347.6
387.5
400.4
423.6
448.2
474.2
501.7
530.9
Change in
Working Capital
151.5
600.1
315.9
512.1
500.3
529.0
559.3
591.4
625.4
Free Cash Flow
to Firm
507.3
139.5
568.7
616.2
738.2
838.6
881.5
926.9
975.1
PV (2001–2005)
@ 9.5%
88.1
PV (Terminal
Value) @ 9.5%
22893.8
Less: Long-
4256.4
Term Debt
Less:
Acquisition-
Related Debt
2193.7
Plus: Excess
Cash Balances
0
Equity Value
16443.7
Equity Value Per
Share
43.9
1Book values for long-term debt may be used if the coupon rate on the debt approximates competitive market rates.
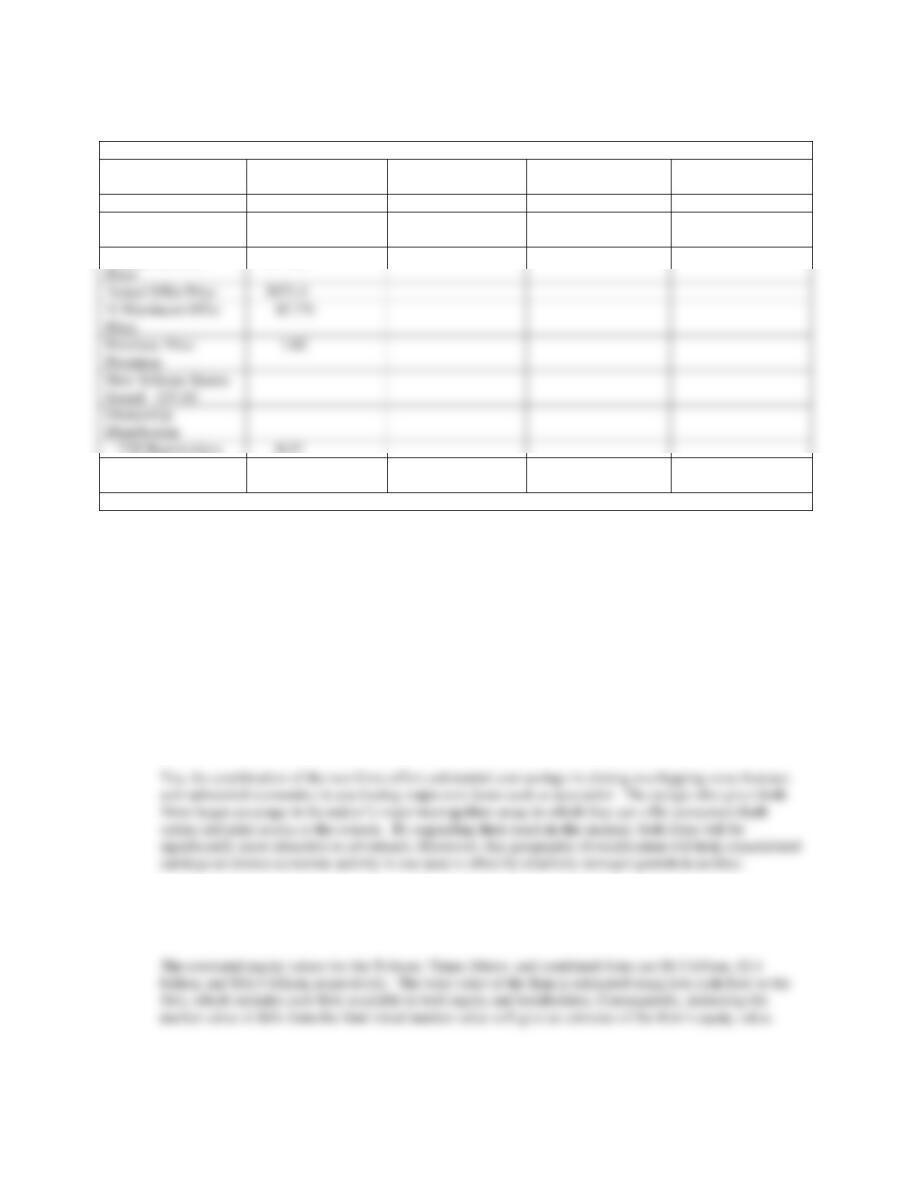
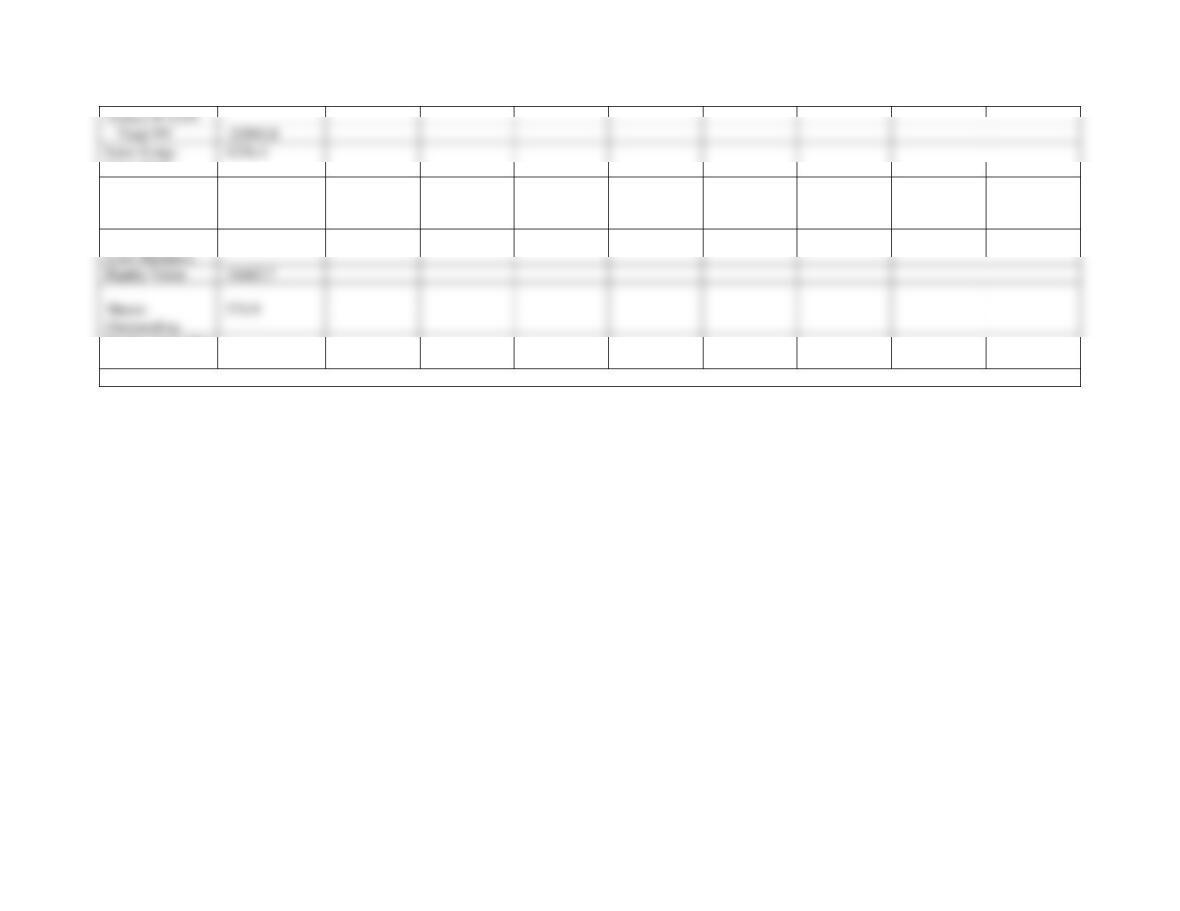
Table 4. Offer Price Determination
Tribune
Times Mirror
Combined Incl.
Synergy
Value of Synergy
Equity Valuations
8501.5
2375.0
16443.7
5567.3
Minimum Offer
Price1
2805.9
Maximum Offer
Price
Actual Offer Price
5671.4
% Maximum Offer
Price
67.7%
Premium
New Tribune Shares
Ownership
Distribution
8373.2
TM Shareholders
0.37
Tribune
Shareholders
0.63
1Market value of Times Mirror on the merger announcement date.
Epilogue
Only time will tell if actual returns to shareholders in the combined Tribune and Times Mirror company exceed the
expected financial returns provided in the valuation models in this case study. Times Mirror shareholders earned a
substantial 102% purchase price premium over the value of their shares on the day the merger was announced. Some
portion of those undoubtedly “cashed out” of their investment following receipt of the new Tribune shares.
However, for those former Times Mirror shareholders continuing to hold their Tribune stock and for Tribune
shareholders of record on the day the transaction closed, it is unclear if the transaction made good economic sense.
Discussion Questions:
1. In your judgment, did it make good strategic sense to combine the Tribune and Times Mirror
corporations? Why? / Why not?
2. Using the Merger Evaluation table given in the case, determine the estimated equity values of Tribune,
Times Mirror and the combined firms. Why is long-term debt deducted from the total present value
estimates in order to obtain equity value?
3. Despite the merger having closed in mid-2000, the full effects of synergy are not expected until 2002.
Why? What factors could account for the delay?
4. The estimated equity value for the Times Mirror Corporation on the day the merger was announced was
about $2.8 billion. Moreover, as shown in the offer price evaluation table, the equity value estimated using
discounted cash flow analysis is given has $2.4 billion. Why is the minimum offer price shown as $2.8
billion rather than the lower $2.4 billion figure? How is the maximum offer price determined in the Offer
Price Evaluation Table? How much of the estimated synergy value generated by combining the two
businesses is being transferred to the Times Mirror shareholders? Why?
5. Does the Times Mirror-Tribune Corporation merger create value? If so, how much? What percentage of
this value goes to Times Mirror shareholders and what percentage to Tribune shareholders? Why?
The merger creates $4.6 billion in value between the pre-merger and post-merger valuations, of which 37%
goes to Times Mirror shareholders reflecting their equity ownership in the new firm. The remainder goes
to Tribune shareholders.
Ford Acquires Volvo’s Passenger Car Operations
This case illustrates how the dynamically changing worldwide automotive market is spurring a move toward
consolidation among automotive manufacturers. The Volvo financials used in the valuation are for illustration
only— they include revenue and costs for all of the firm’s product lines. For purposes of exposition, we shall
assume that Ford’s acquisition strategy with respect to Volvo was to acquire all of Volvo’s operations and later to
divest all but the passenger car and possibly the truck operations. Note that synergy in this business case is
determined by valuing projected cash flows generated by combining the Ford and Volvo businesses rather than by
subtracting the standalone values for the Ford and Volvo passenger car operations from their combined value
including the effects of synergy. This was done because of the difficulty in obtaining sufficient data on the Ford
passenger car operations.
Background
By the late 1990s, excess global automotive production capacity totaled 20 million vehicles, and three-fourths of the
auto manufacturers worldwide were losing money. Consumers continued to demand more technological
innovations, while expecting to pay lower prices. Continuing mandates from regulators for new, cleaner engines and
more safety measures added to manufacturing costs. With the cost of designing a new car estimated at $1.5 billion to
$3 billion, companies were finding mergers and joint ventures an attractive means to distribute risk and maintain
market share in this highly competitive environment.
By acquiring Volvo, Ford hoped to expand its 10% worldwide market share with a broader line of near-luxury
Volvo sedans and station wagons as well as to strengthen its presence in Europe. Ford saw Volvo as a means of
improving its product weaknesses, expanding distribution channels, entering new markets, reducing development
size.
Historical and Projected Data
The initial review of Volvo’s historical data suggests that cash flow is highly volatile. However, by removing
nonrecurring events, it is apparent that Volvo’s cash flow is steadily trending downward from its high in 1997. Table
9-10 displays a common-sized, normalized income statement, balance sheet, and cash-flow statement for Volvo,
including both the historical period from 1993 through 1999 and a forecast period from 2000 through 2004.
Although Volvo has managed to stabilize its cost of goods sold as a percentage of net sales, operating expenses as a
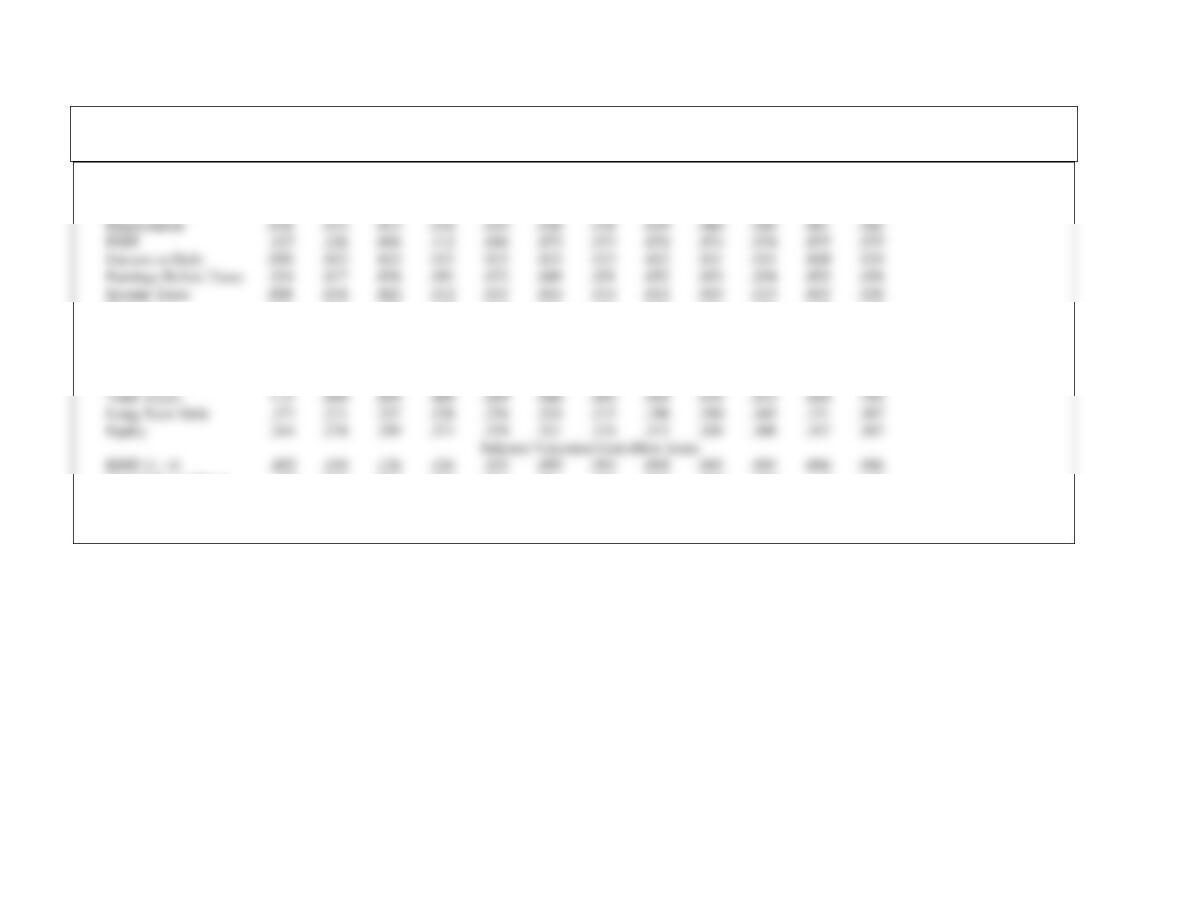
<A>Table 9-10. Volvo Common-Size Normalized Income Statement, Balance Sheet, and Cash-Flow Statement (Percentage of Net Sales)<A>
1993 1994 1995 1996 1997 1998 1999 2000 2001 2002 2003 2004
Income Statement
Net Sales 1.000 1.000 1.000 1.000 1.000 1.000 1.000 1.000 1.000 1.000 1.000 1.000
Cost of Goods Sold .772 .738 .749 .777 .757 .757 .757 .757 .757 .757 .757 .757
Operation Expense .167 .101 .120 .077 .119 .133 .132 .131 .129 .128 .127 .126
Net Income .028 .087 .054 .079 .057 .035 .036 .037 .038 .039 .040 .040
Balance Sheet
Current Assets .632 .503 .444 .524 .497 .500 .500 .500 .500 .500 .500 .500
Current Liabilities .596 .400 .283 .298 .304 .350 .350 .350 .350 .350 .350 .350
Working Capital .036 .103 .161 .226 .192 .150 .150 .150 .150 .150 .150 .150
Capital Expenditures .031 .027 .033 .053 .054 .061 .069 .078 .088 .099 .112 .126
Working Capital .025 .077 .068 .049 .000 .017 .020 .020 .020 .020 .020 .020
Free Cash Flow .047 .079 .053 .059 .088 .087 .044 .036 .027 .017 .005 (.008)
to the Firm (FCFF)
Determining the Initial Offer Price
reflecting only about one-fourth of the total potential synergy resulting from combining the two businesses. Other valuation
methodologies tended to confirm this purchase price estimate. The market value of Volvo was $11.9 billion on January 29, 1999. To
gain a controlling interest, Ford had to pay a premium to the market value on January 29, 1999. Applying the 26% premium Ford paid
for Jaguar, the estimated purchase price including the premium is $15 billion, or $34 per share. This compares to $34.50 per share
estimated by dividing the initial offer price of $15.25 billion by Volvo’s total common shares outstanding of 442 million.
return, including the effects of synergy, exceeds the cost of capital. Moreover, by using this excess cash, Ford also is making itself less
attractive as a potential acquisition target. The acquisition is expected to increase Ford’s EPS. The loss of interest earnings on the
excess cash balances would be more than offset by the addition of Volvo’s pretax earnings.
Epilogue
Seven months after the megamerger between Chrysler and Daimler-Benz in 1998, Ford Motor Company announced that it was
Discussion Questions and Answers:
1. What is the purpose of the common-size financial statements developed for Volvo (see Table 8–8 in the textbook)? What
insights does this table provide about the historical trend in Volvo’s historical performance? Based on past performance,
how realistic do you think the projections are for 2000-2004?
Answer: The common size financial statements for Volvo reveal the historical relationship between key operating variables
2. Ford anticipates substantial synergies from acquiring Volvo. What are these potential synergies? As a consultant hired to
value Volvo, what additional information would you need to estimate the value of potential synergy from each of these areas?
Answer: By acquiring Volvo, Ford hoped to expand its global market share with a broader product offering as well as to
strengthen its presence in Europe. Specifically, Ford saw Volvo as a means of improving its product weakness in luxury
sedans and station wagons, gaining access to new distribution channels and markets, reducing development and vehicle
3. How was the initial offer price determined according to this case study? Do you find the logic underlying the initial offer
price compelling? Explain your answer.
4. What was the composition of the purchase price? Why was this composition selected according to this case study?