Unlock document.
This document is partially blurred.
Unlock all pages and 1 million more documents.
Get Access
Kosky, Balmer, Keat, and Wise: Exploring Engineering, Fourth Edition
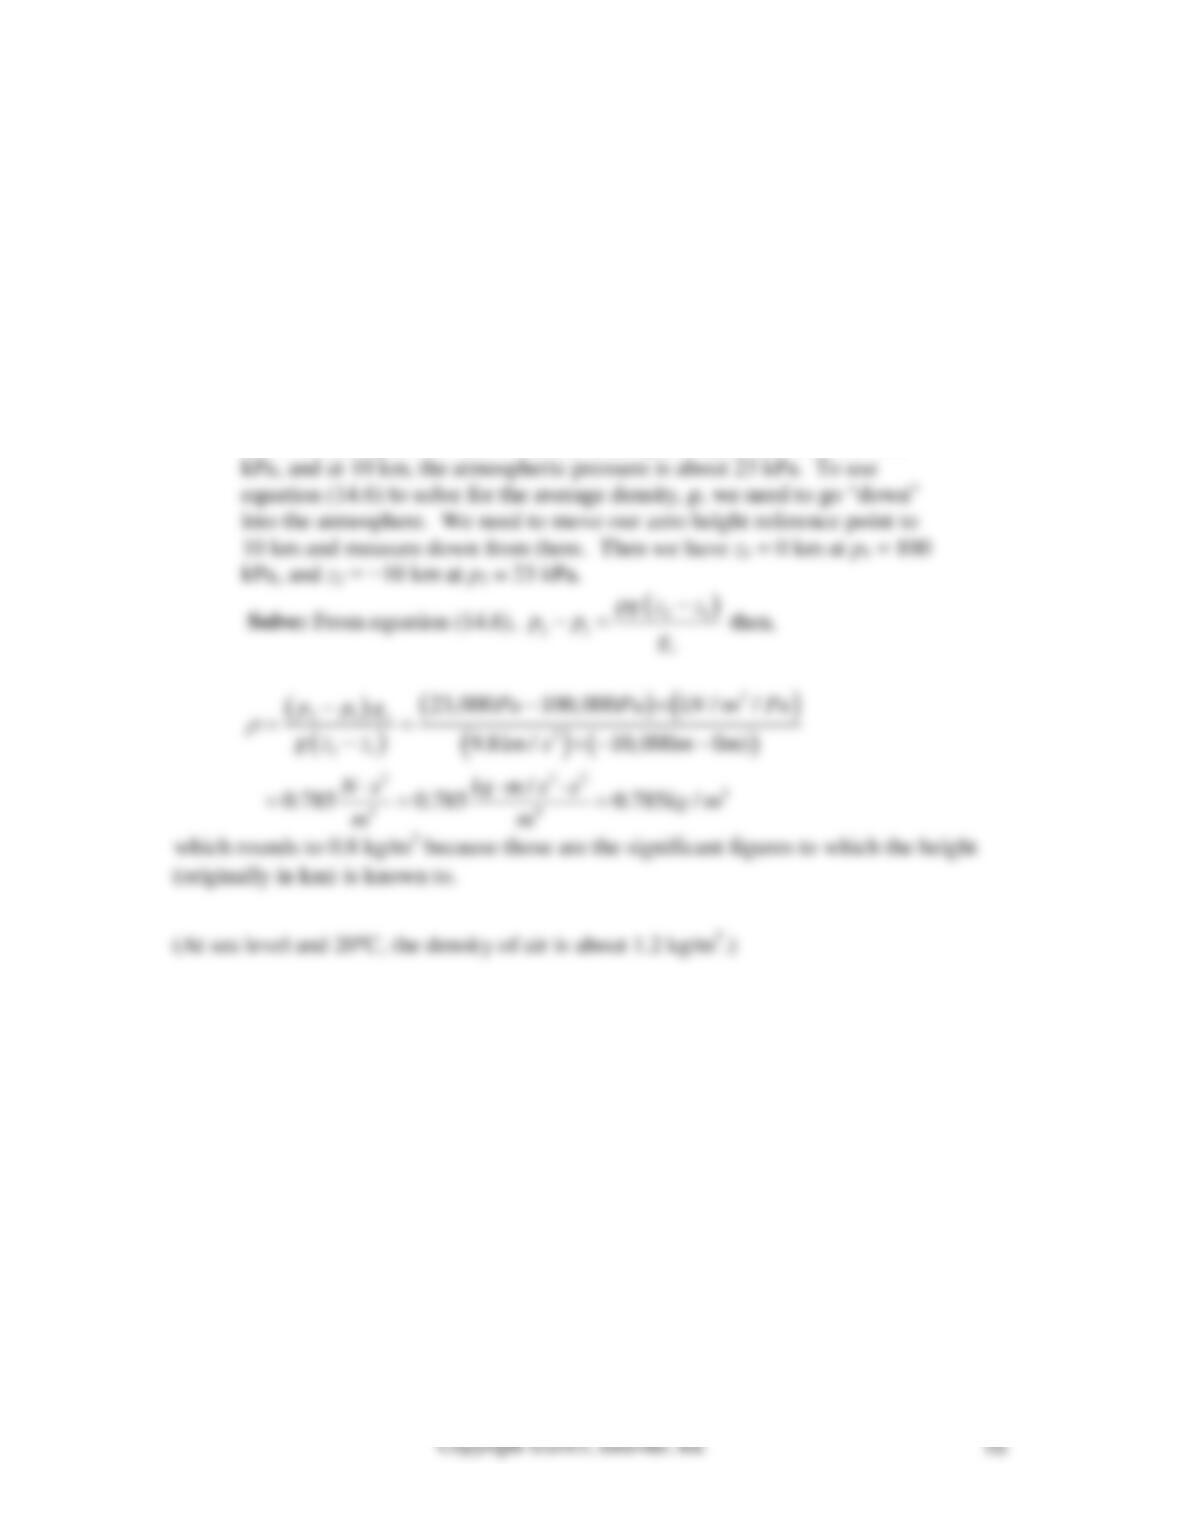
14-15. Figure 14.7 is a plot of atmospheric pressure vs. height. If we draw a straight line
from the starting point to the ending point of this line and determine the slope of this line,
we can use Equation (14.6) to determine the "average" density of the Earth's atmosphere
over this height range. What is this average density?
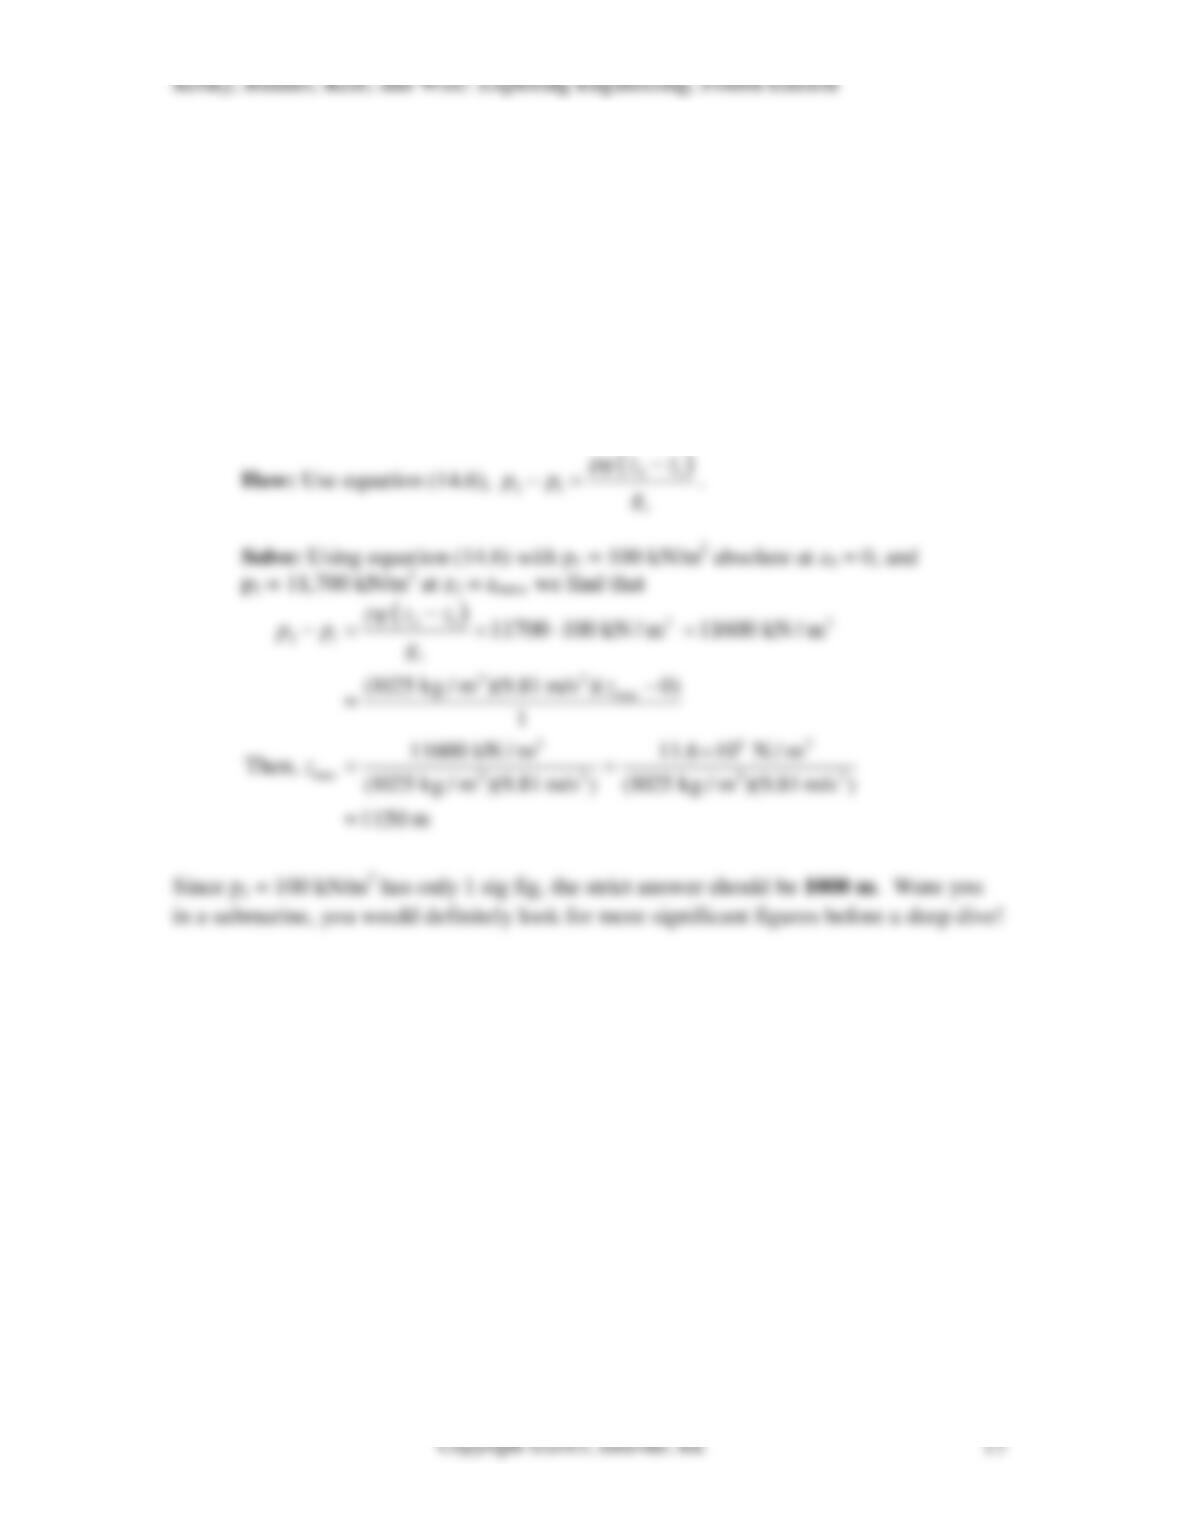
Need: The average density of the Earth’s atmosphere, ρ = ?
Know: The atmospheric pressure varies with height according to Figure
14.7
How: From Figure 14.7, at 0 km, the atmospheric pressure is about 100