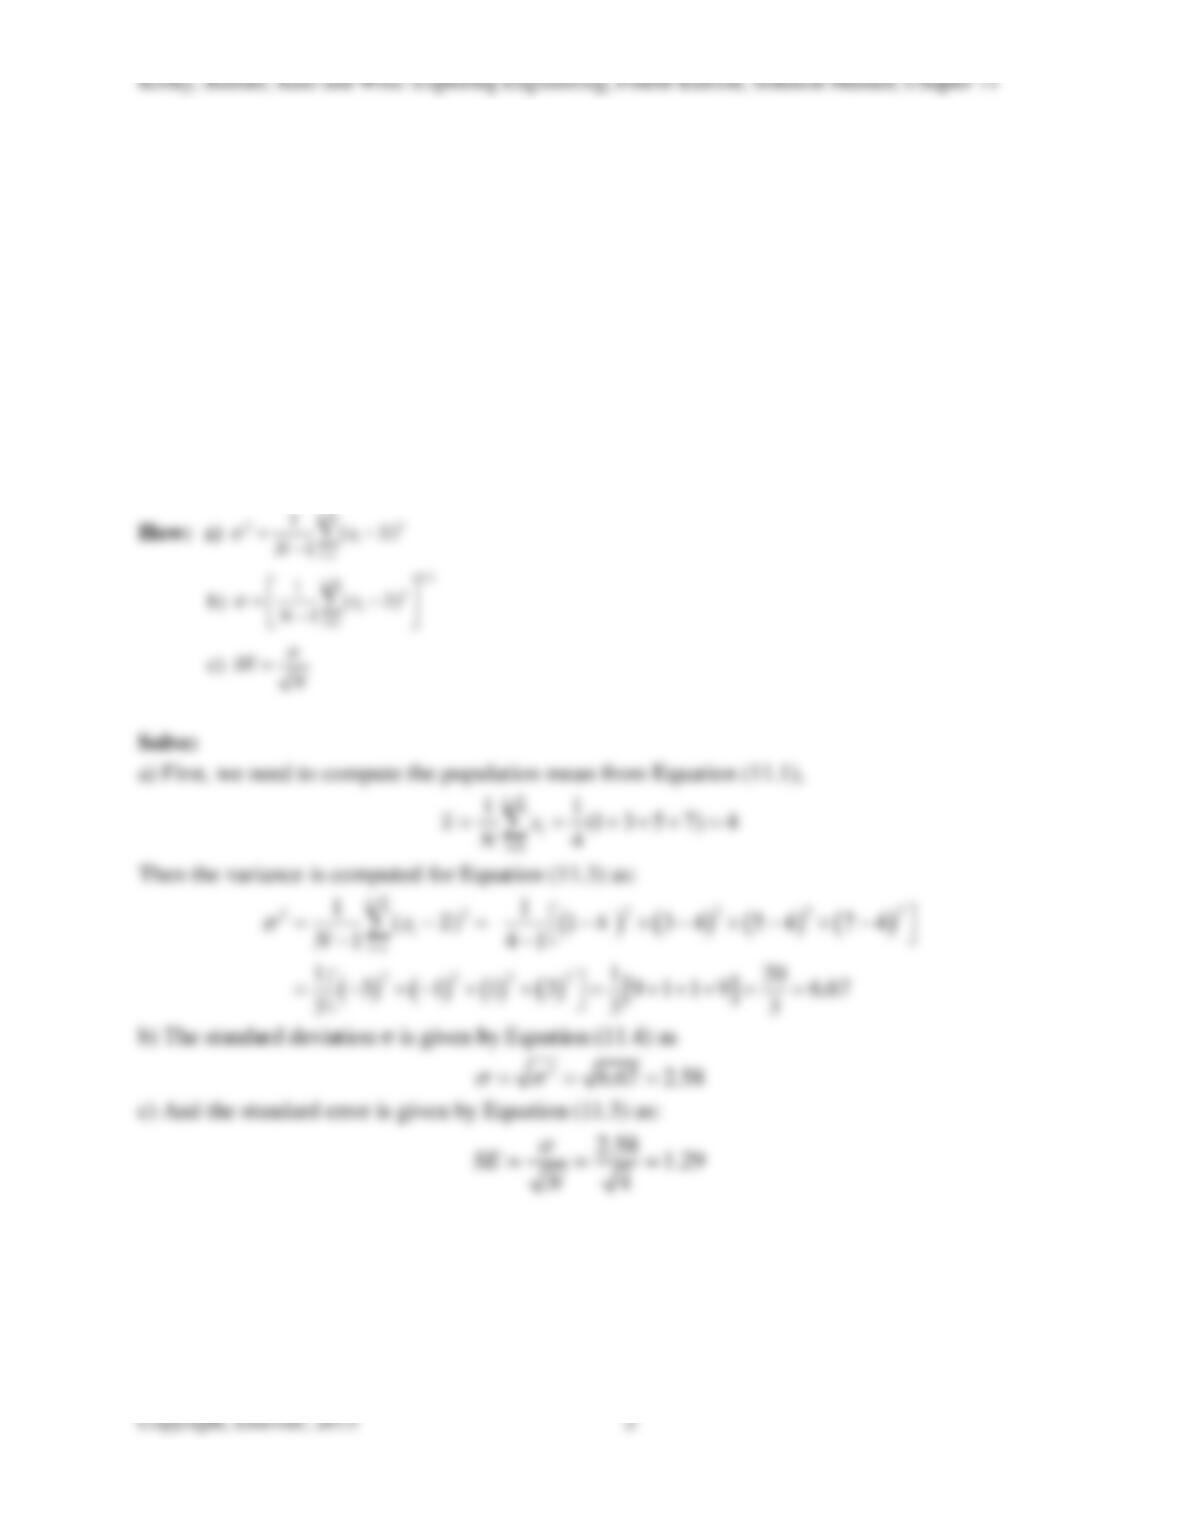
11-2) An engineer collects data that consists of the following four observations: 1, 3, 5, and 7.
What is the a) variance, b) standard deviation, and c) standard error of this data?
Solution:
Need: the a) variance, b) standard deviation, and c) standard error of this data.
Know: a) the variance σ2 is 1 divided by the number of samples minus 1, multiplied by the sum
of all data points each subtracted by the mean then squared, b) the standard deviation σ is the
square root of the variance, and c) the standard error of the mean is the standard deviation
divided by the square root of the number of samples..
22
1()
iN
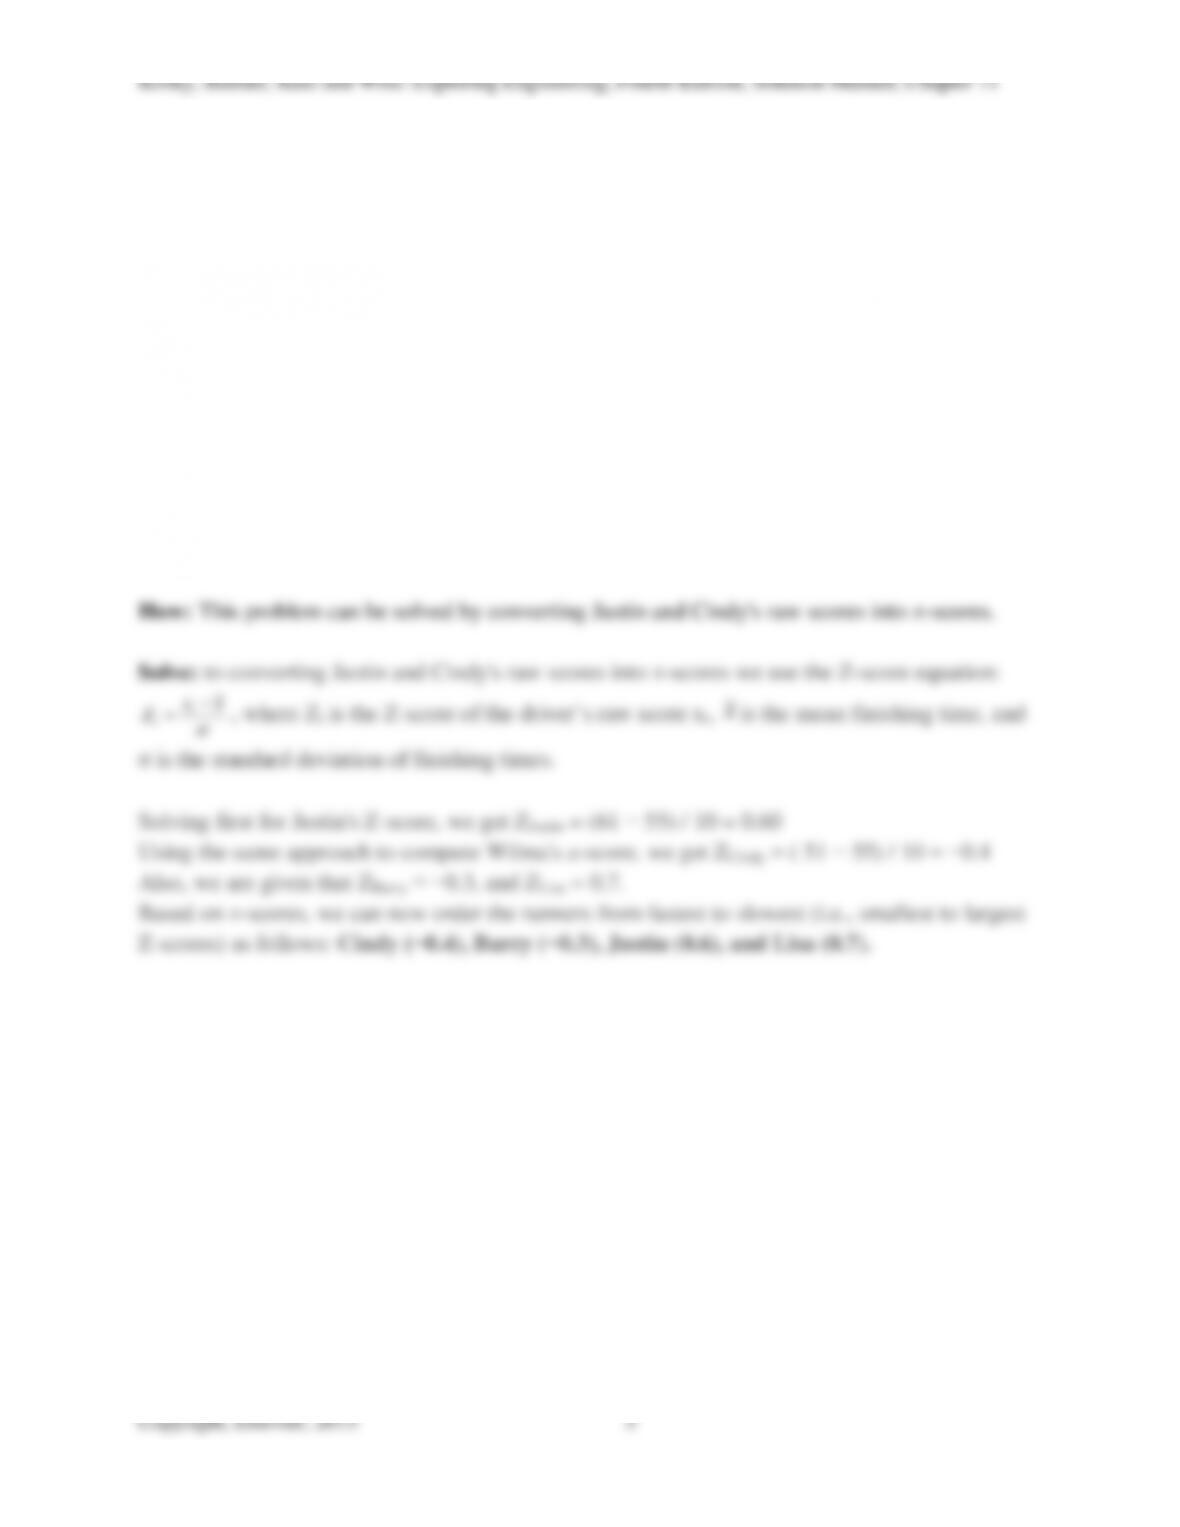
11-3) Every year, 1,000 engineers compete in a sports car road race. The mean (average)
finishing time is 55 minutes, with a standard deviation of 10 minutes. Justin and Cindy
completed the race in 61 and 51 minutes, respectively. Barry and Lisa had finishing times with
Z-scores of -0.3 and 0.7, respectively. Since the Z-score is the number of standard
deviations above the mean, then the lowest Z-score corresponds to the fastest car. List the
drivers, fastest to the slowest, based on their Z-scores.
Solution:
Need: a list the drivers, fastest to the slowest, based on their Z-scores.
Know: the mean finishing time and standard deviation of all cars, anf the Z-scores of Barry and
Lisa.
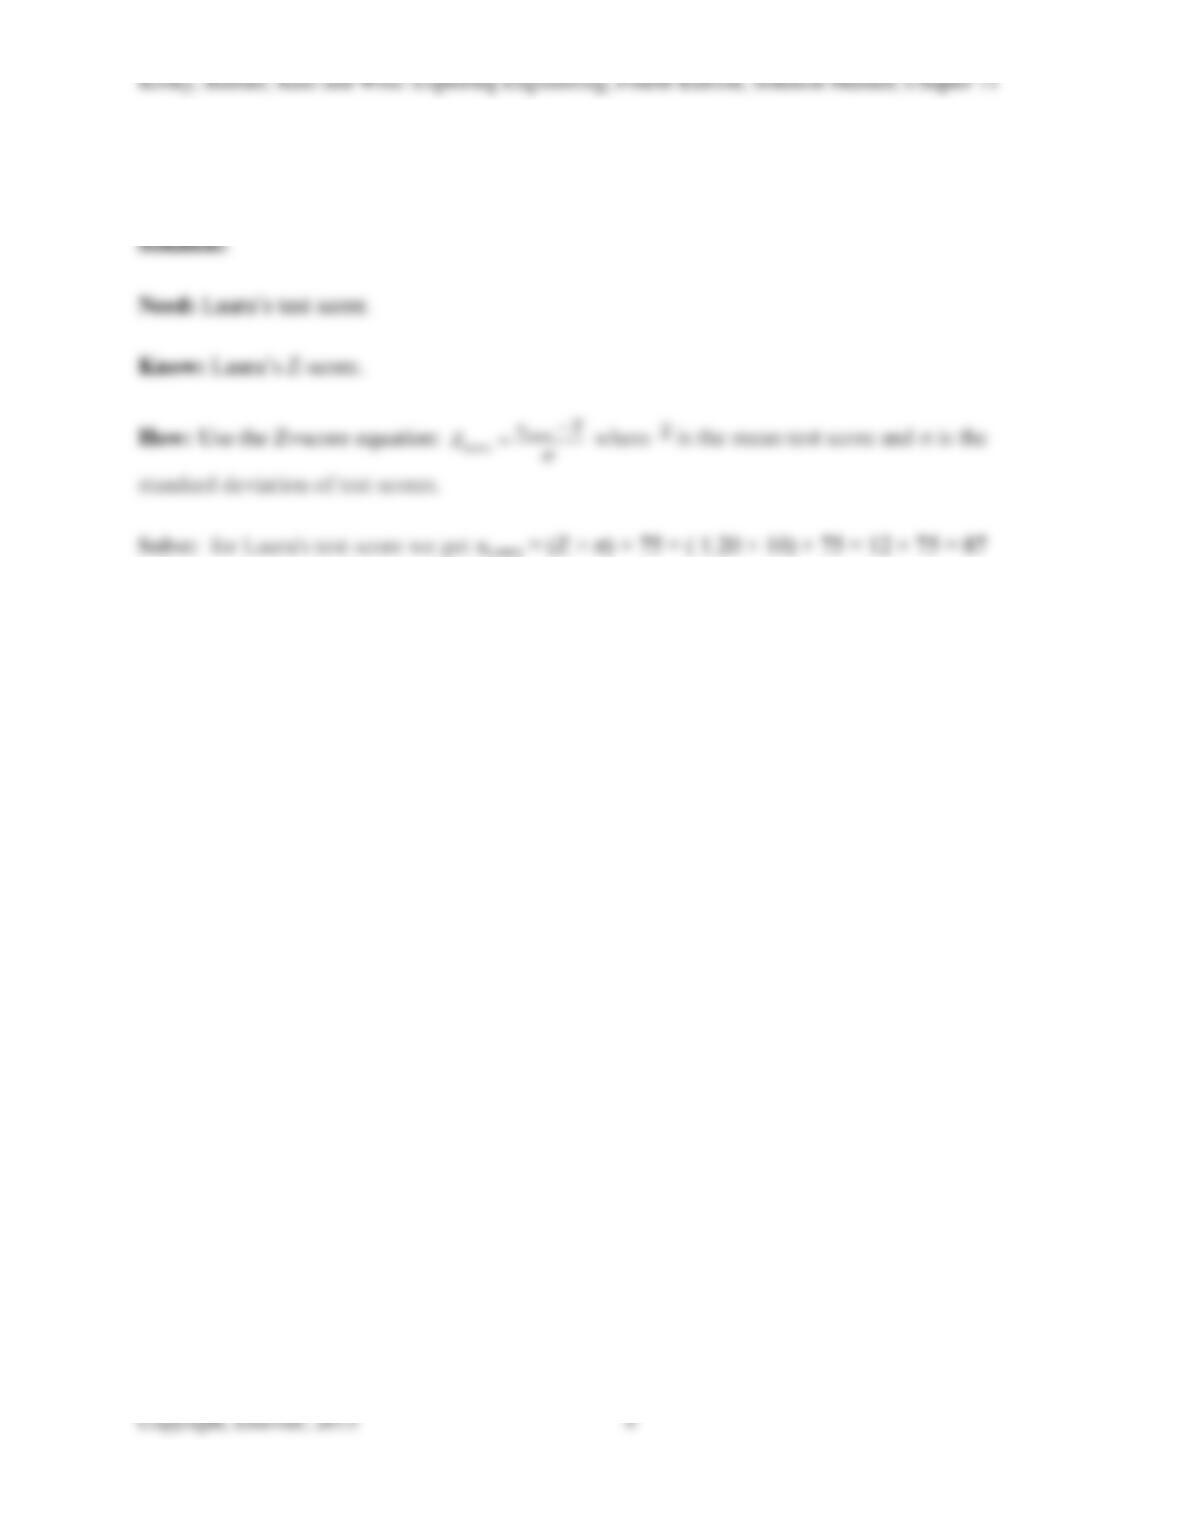
11-4) A final examination in an engineering class has a mean (average) score of 75 and a
standard deviation of 10 points. If Laura’s Z–score is 1.20, what was her score on the test?
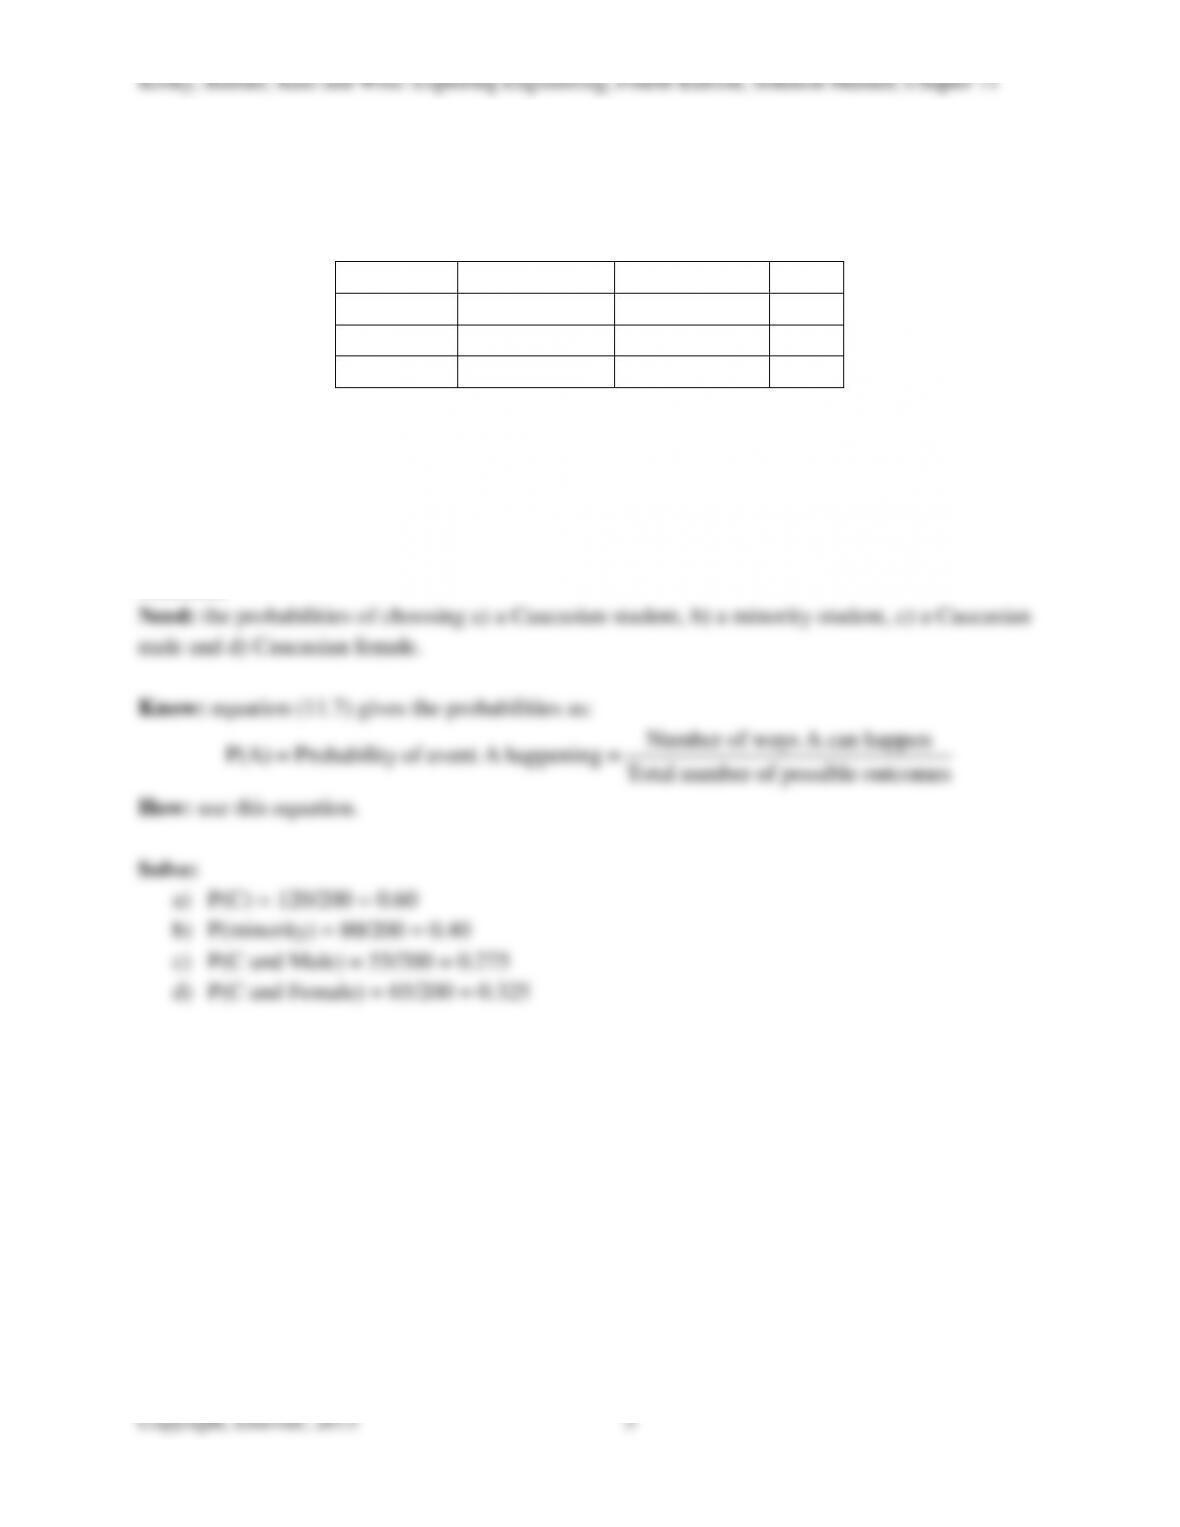
11-5) We want to know the chances of choosing a particular student type based on four
demographic characteristics. The demographics of the students are illustrated in the table below.
Caucasian (c)
Minority (m)
Total
Male
55
40
95
Female
65
40
105
Total
120
80
200
a) What is the probability of choosing a Caucasian student?
b) What is the probability of choosing a minority student?
c) What is the probability of choosing a Caucasian male?
d) What is the probability of choosing a Caucasian female?
Solution:
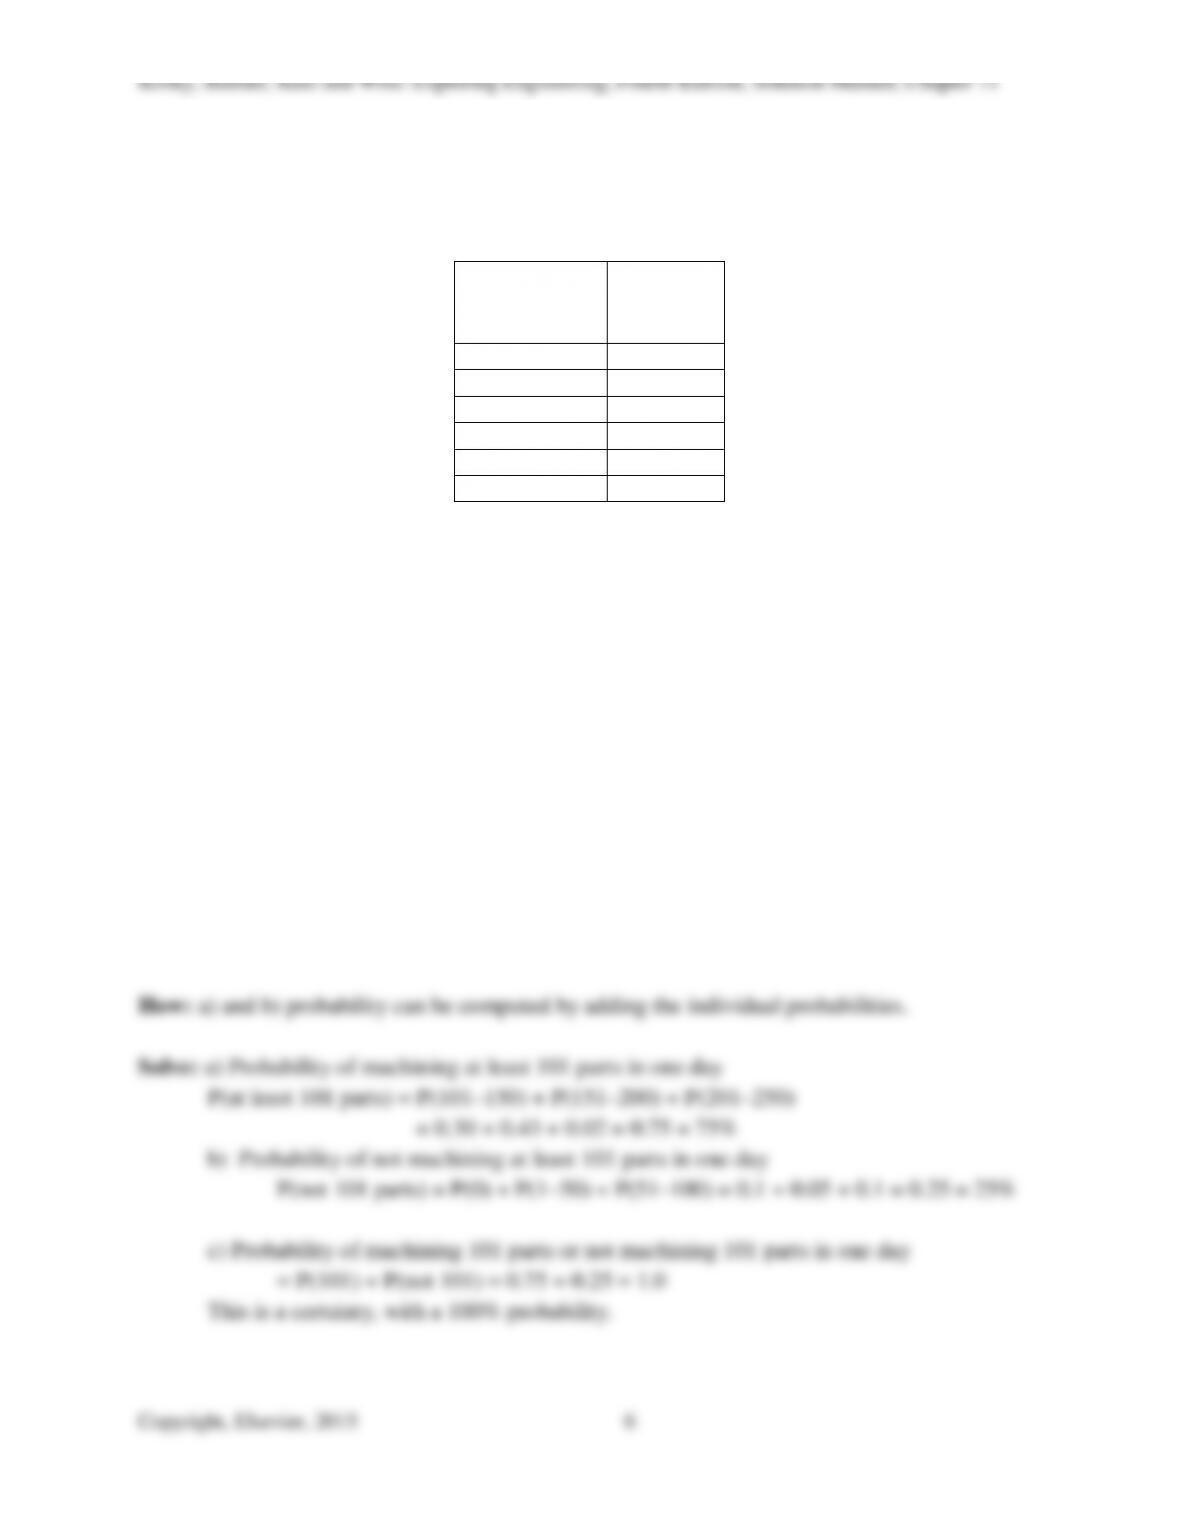
11-6) Suppose the number of parts that can be machined on a lathe in one day ranges from 0 (the
lathe is not operating) to 250 (the best the lathe operator). By collecting data, the following
probabilities for machining parts in the first hour were determined.
Number of
parts machined
in one day
Probability
0
0.10
1–50
0.05
51–100
0.10
101–150
0.30
151–200
0.43
201–250
0.02
This table tells us that the probability of machining between 1 and 50 parts in one day is 5.0%,
and the probability of machining between 50 and 100 parts in one day is 10%. What is the
probability of machining “at least” 101 parts in one day?
a) What is the probability of not machining at least 101 parts in one day?
b) What is the probability of machining at least 101 parts or not machining at least 101 parts
in one day?
Solution:
Need: a) the probability of not machining at least 101 parts in one day and b) the probability of
machining at least 101 parts or not machining at least 101 parts in one day
Know: a) and b) are ‘or’ events since all of the required events are mutually exclusive because
none of the ‘or’ events can occur at the same time.
11-7) A manufacturer wishes to order material from a wholesale supplier. The supplier has three
phone lines with three different numbers that operate independently. The probability of phone 1
being busy is 0.80, the probability of phone 2 being busy is 0.80, and the probability of phone 3
being busy is 0.80. The manufacturer calls to order a large supply of material. What is the
probability that the phone lines will be busy?
Solution:
Need: the probability that the phone lines will be busy
11-8) Suppose 10 devices are tested for 500 hours. During this test 2 devices fail.
a) What is the MTBF?
b) What is the MTTF?
c) What is the failure rate?
d) What is the probability that any one device will be operational when t = MTBF?
Solution:
Need: the a) MTBF, b) MTTF, c) failure rate, and d) the probability that any one device will be
operational when t = MTBF
Know:
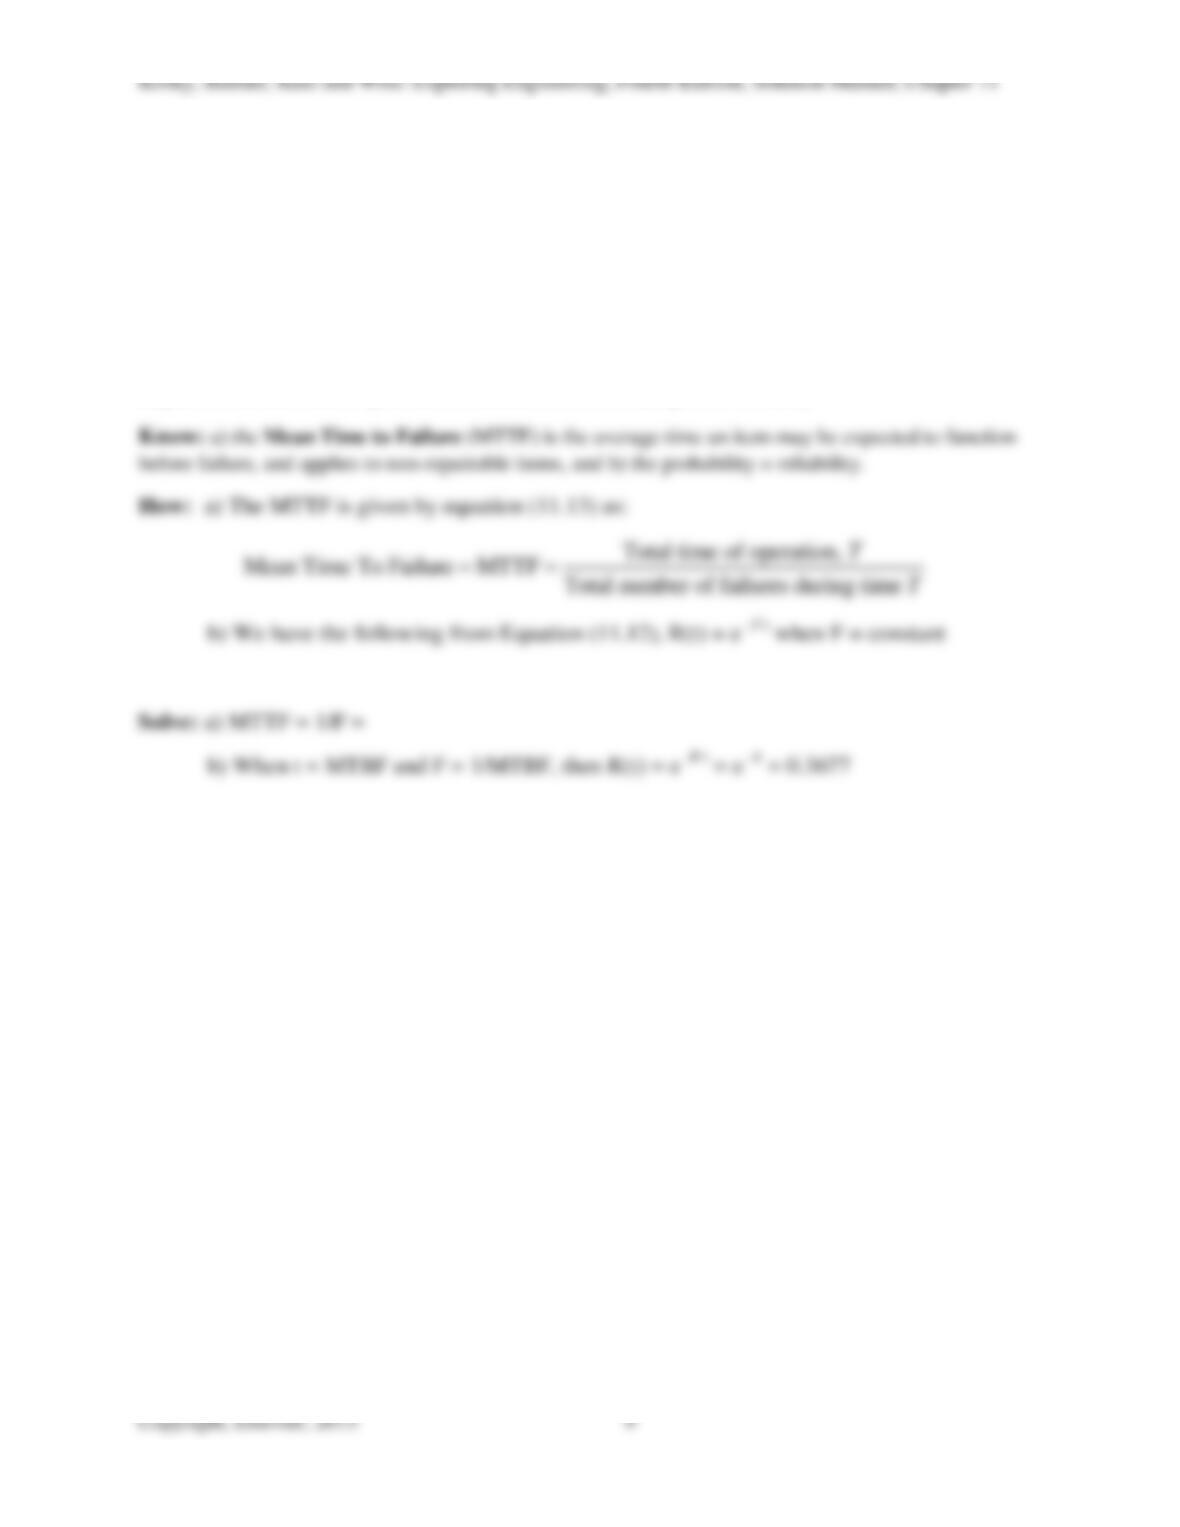
11-9) A product has a constant failure rate of 0.2% per 1000 hours of operation.
a) What is its MTTF?
b) What is the probability of it successfully operating for 10,000 hours?
Solution:
Need: the MTTF and the reliability (which is the probability that a product will perform its
required function under specified conditions for a certain period of time).
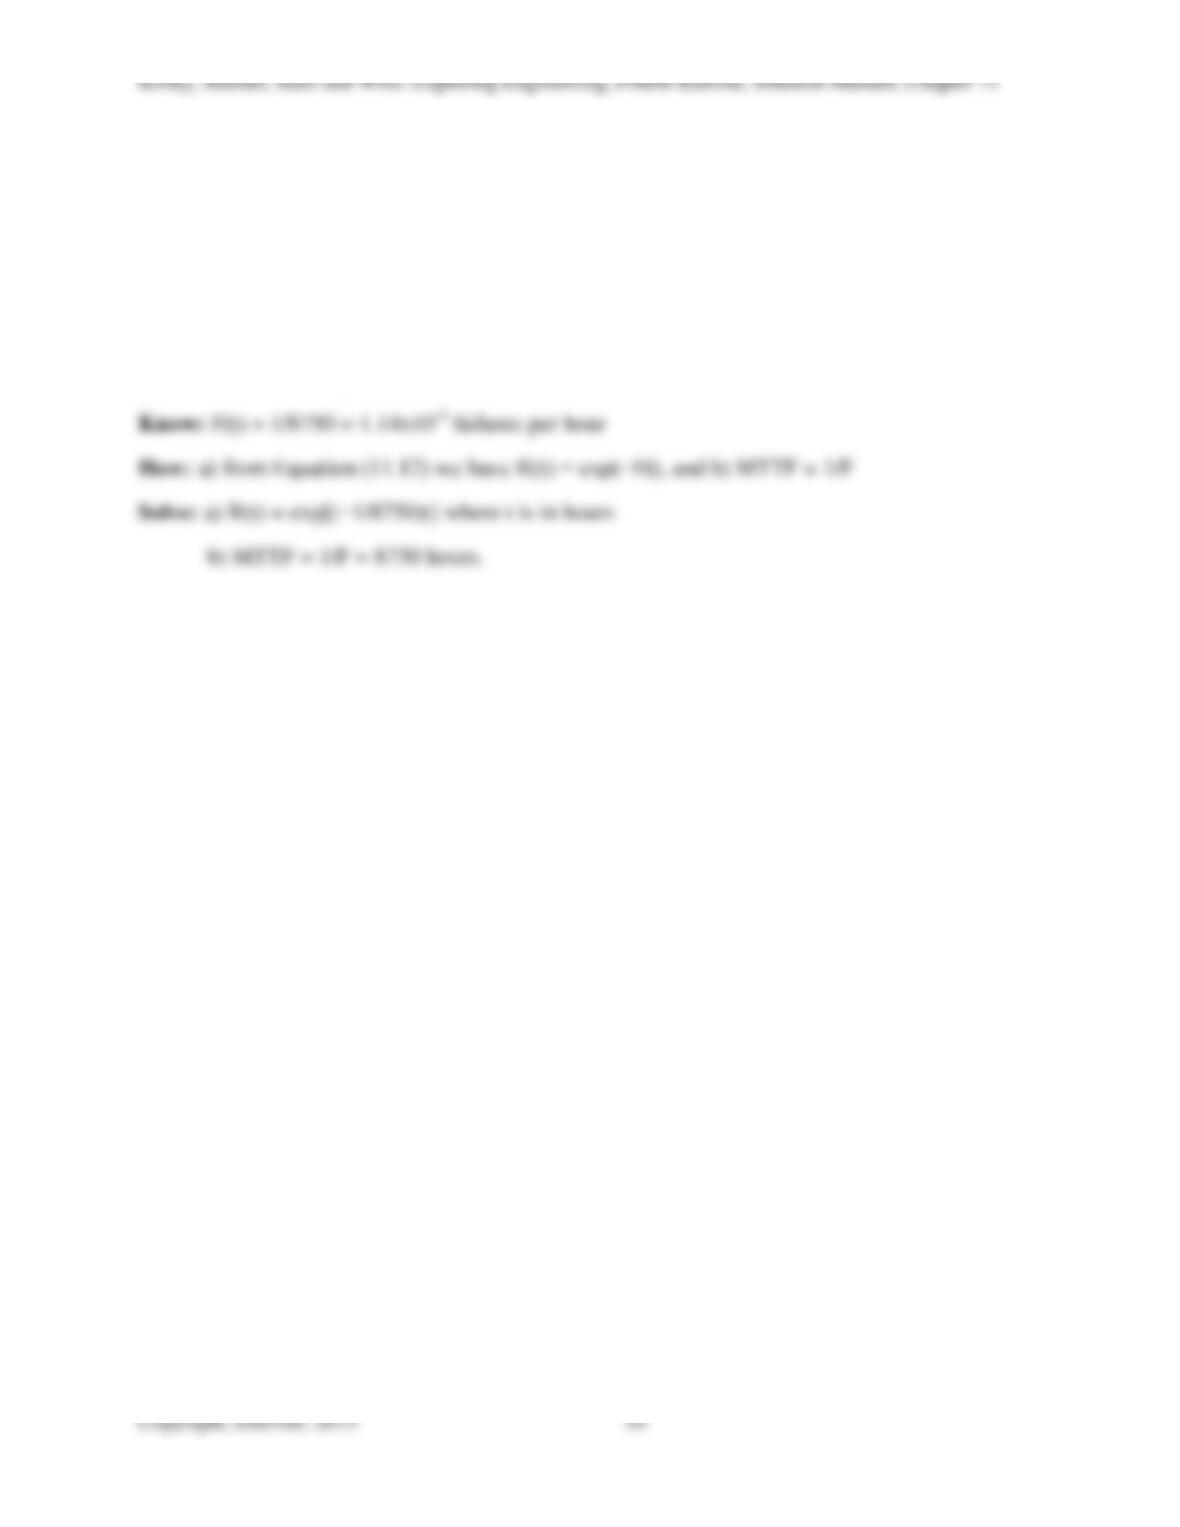
11-10) Engineers carry out a reliability test to develop a warranty policy. The test finds that the
failure rate is approximately constant with F(t) = 1/8750 = 1.14×10⁻⁴ failures per hour.
a) Determine the reliability function R(t)
b) Determine the mean time to failure (MTTF).
Solution:
Need: a) the reliability function R(t) and b) MTTF.
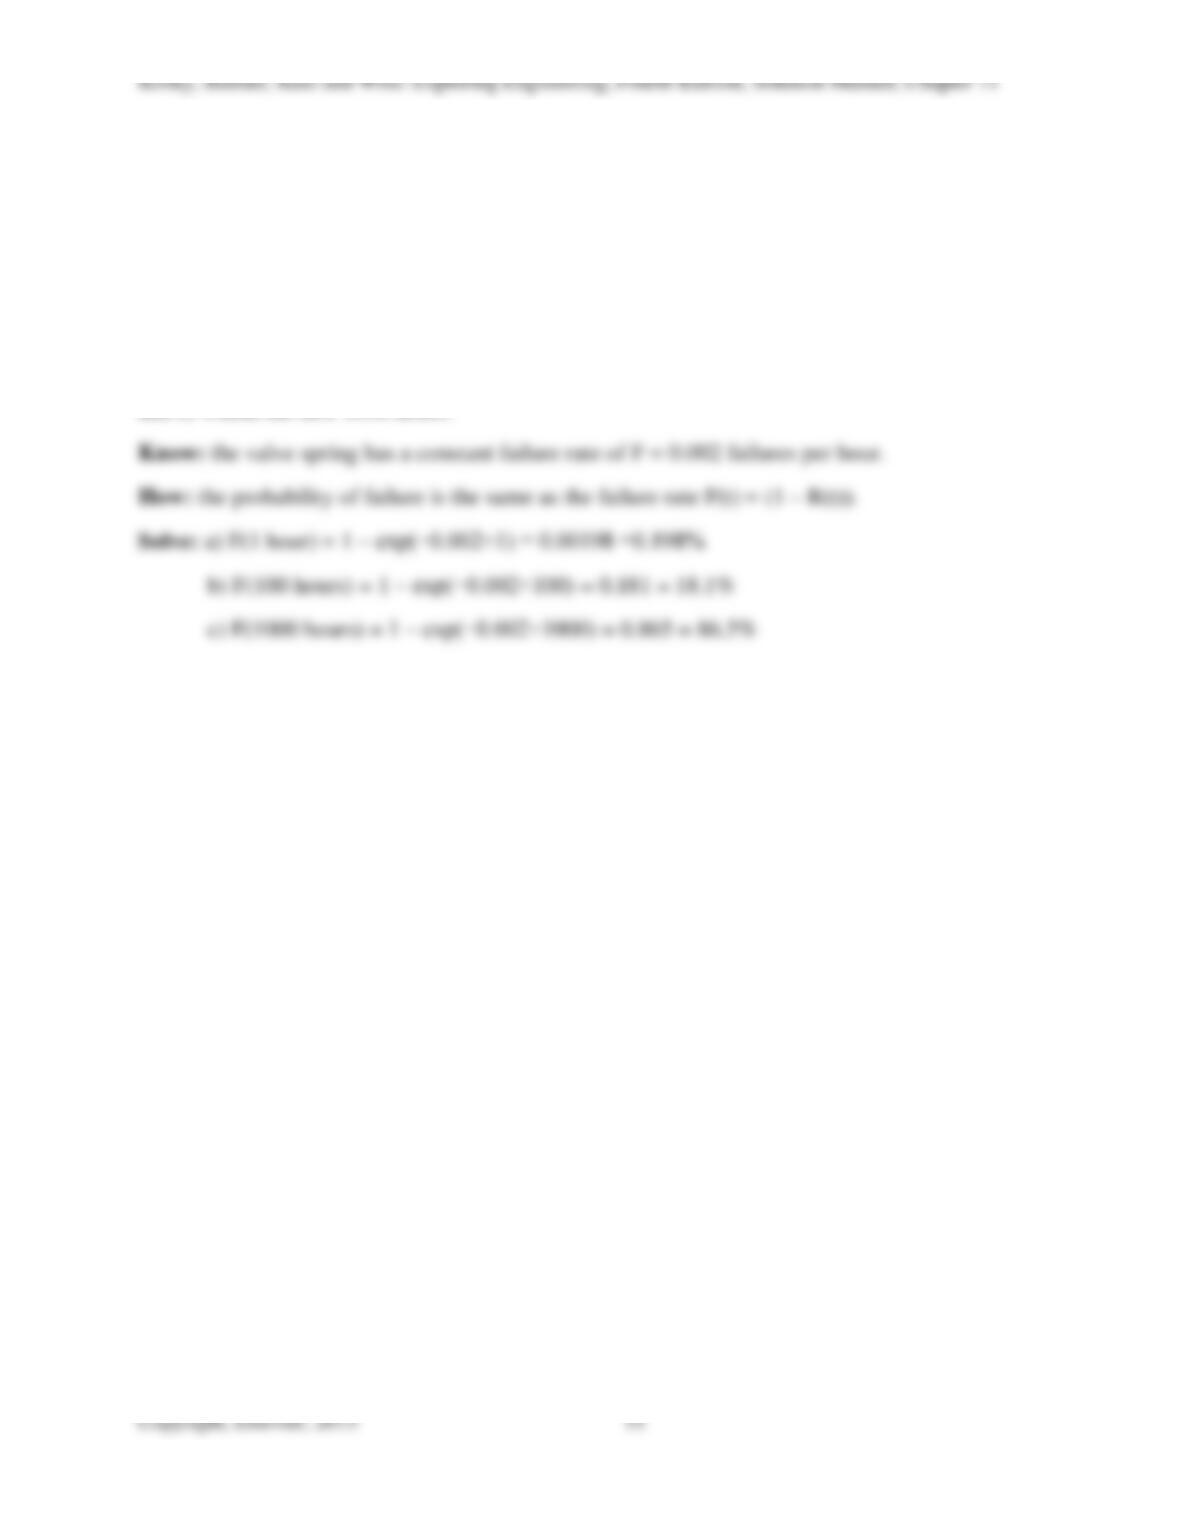
11-11) A new automotive valve spring design is tested in continuous use and is found to have a
constant failure rate of F = 0.002 failures per hour.
a) Determine the probability of failure (1 – R(t)) within the first hour of use.
b) Determine the probability of failure within the first 100 hours.
c) Determine the probability of failure within the first 1000 hours.
Solution:
Need: the probably of failure F(t) a) within the first hour of use, b) within the first 100 hours,
and c) within the first 1000 hours.
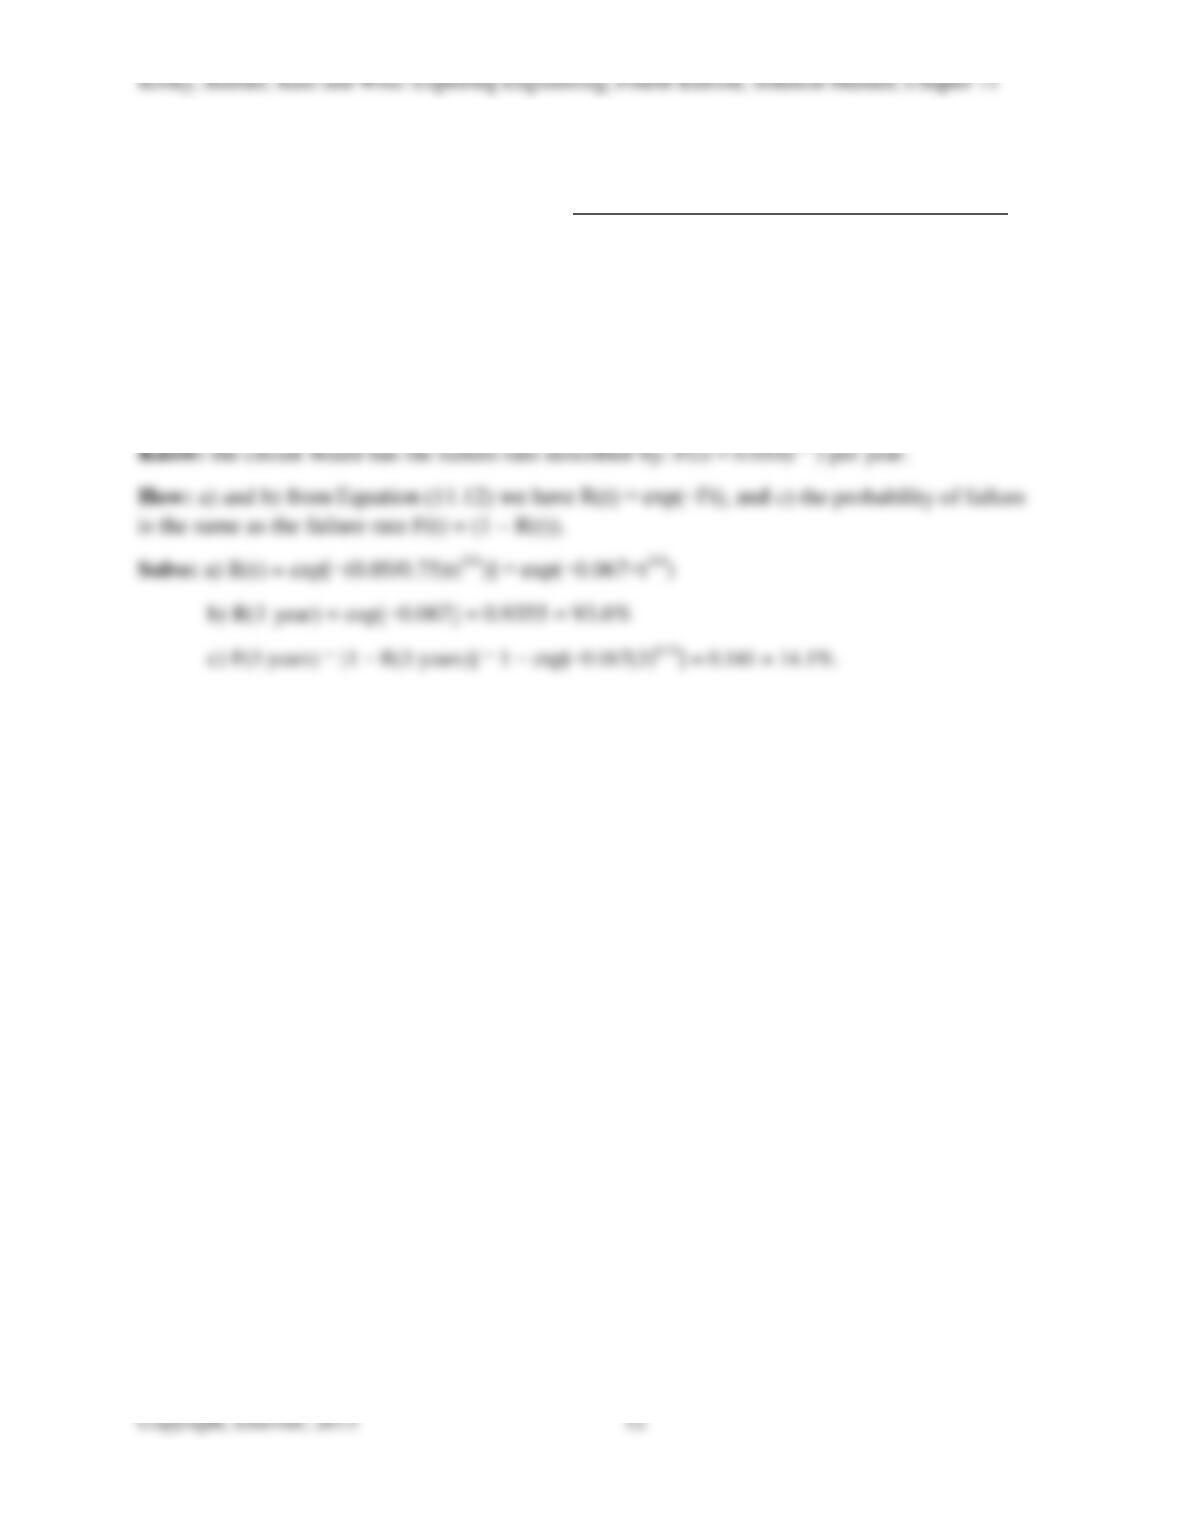
11-12) An electronic circuit board has the failure rate described by: F(t) = 0.05/(t1/4) per year
(with “t” in years).
a) Determine the reliability function R(t). and the failure probability distribution function
b) Determine the reliability for 1 year of use.
c) Determine the fraction of failed circuits in 3 years.
Solution:
Need: the reliability function R(t) and the failure probability distribution function, b) the
reliability for 1 year of use, and c) the fraction of failed circuits in 3 years.
11-13) A cell phone manufacturer tested 10,000 phones in a reliability evaluation program. Each
phone was turned on-and-off 160 times each day to mimic extreme phone usage for a week.
Based on a failure–to-perform criterion, the following failure data were obtained for the first 10
days of test:
Day
1
2
3
4
5
6
7
8
9
10
Failures
180
120
100
70
60
50
40
30
0
10
For the first day the failure rate is: F(1) =180/10,000 = 0.018 per day;
For the second day the failure rate is: F(2) =120/(10,000–180) =120/9820 = 0.0122 per day.
For the third day the failure rate is: F(3) = 100/(10,000 -180 -120) = 100/9700 = 0.010 per day
and so on.
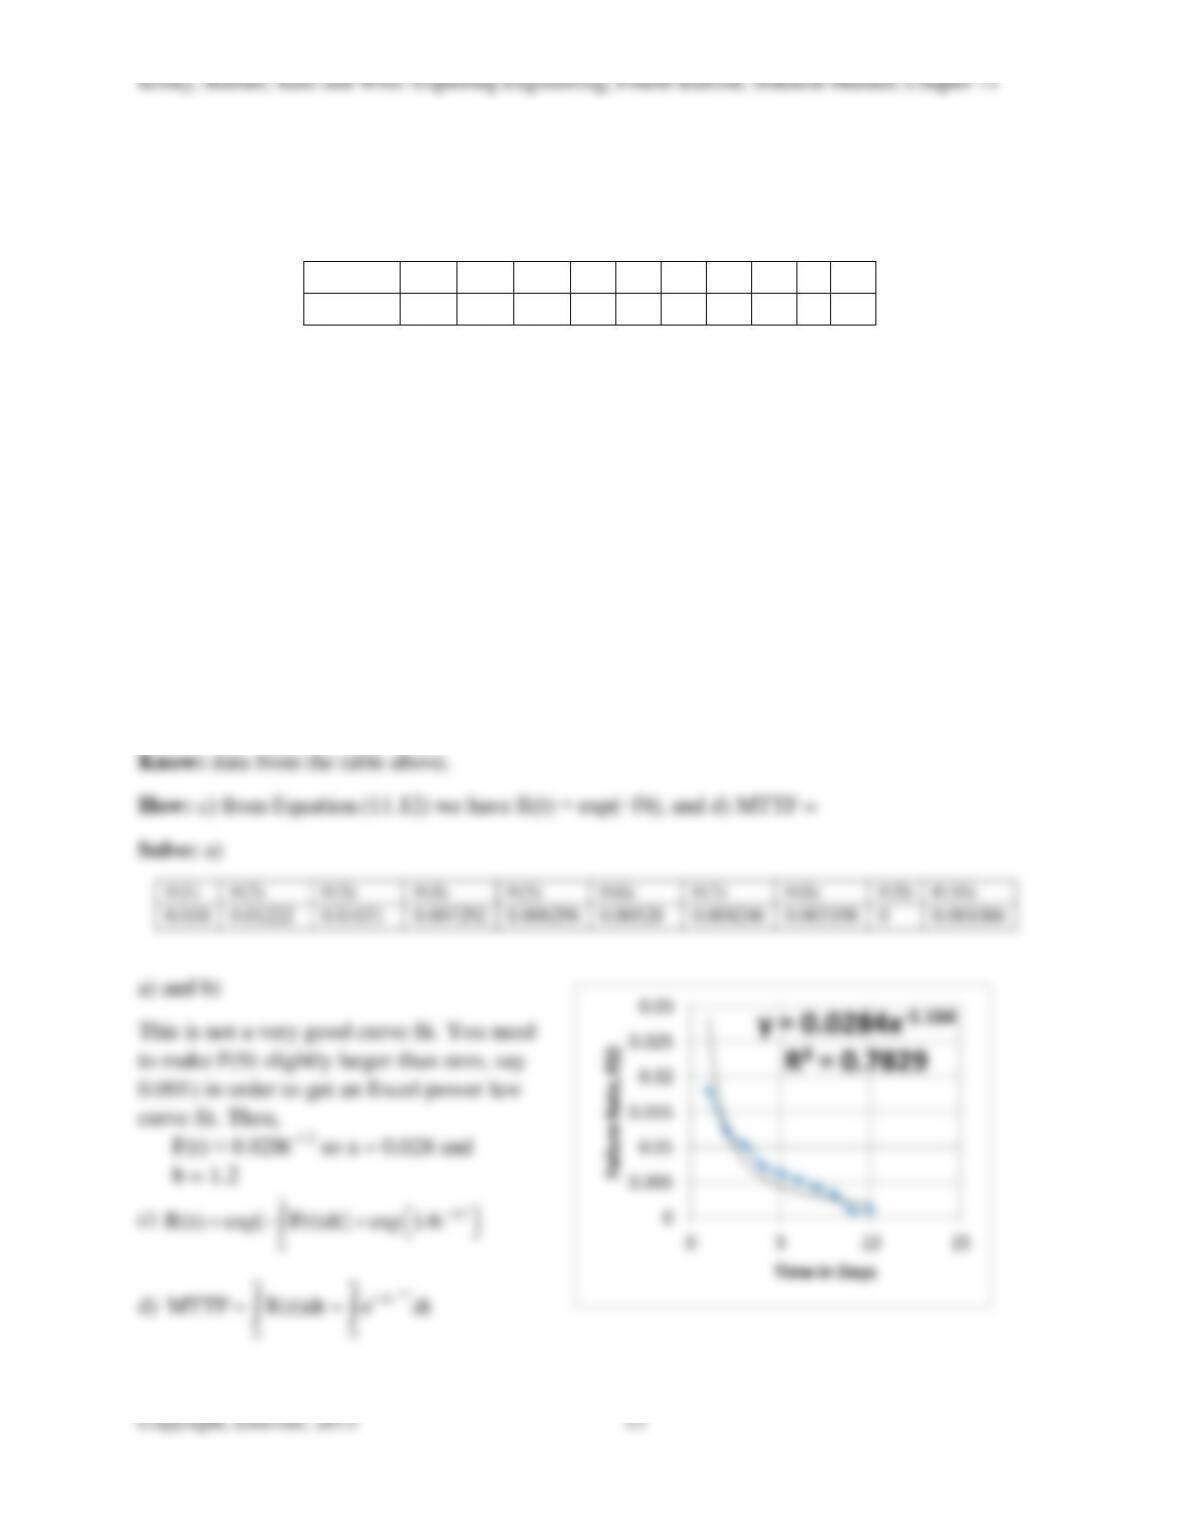
a) Plot F(t) from t = 0 to t =10 days.
b) Fit these data with a curve of the form F(t) = at-b and determine the values of a and b.
c) Determine the reliability function R(t)
d) Determine the mean-time-to-failure, MTTF.
Solution:
Need: a) a plot of F(t), b) the curve fit values of a and b, c) the reliability function R(t), and d)
the MTTF.