9-93
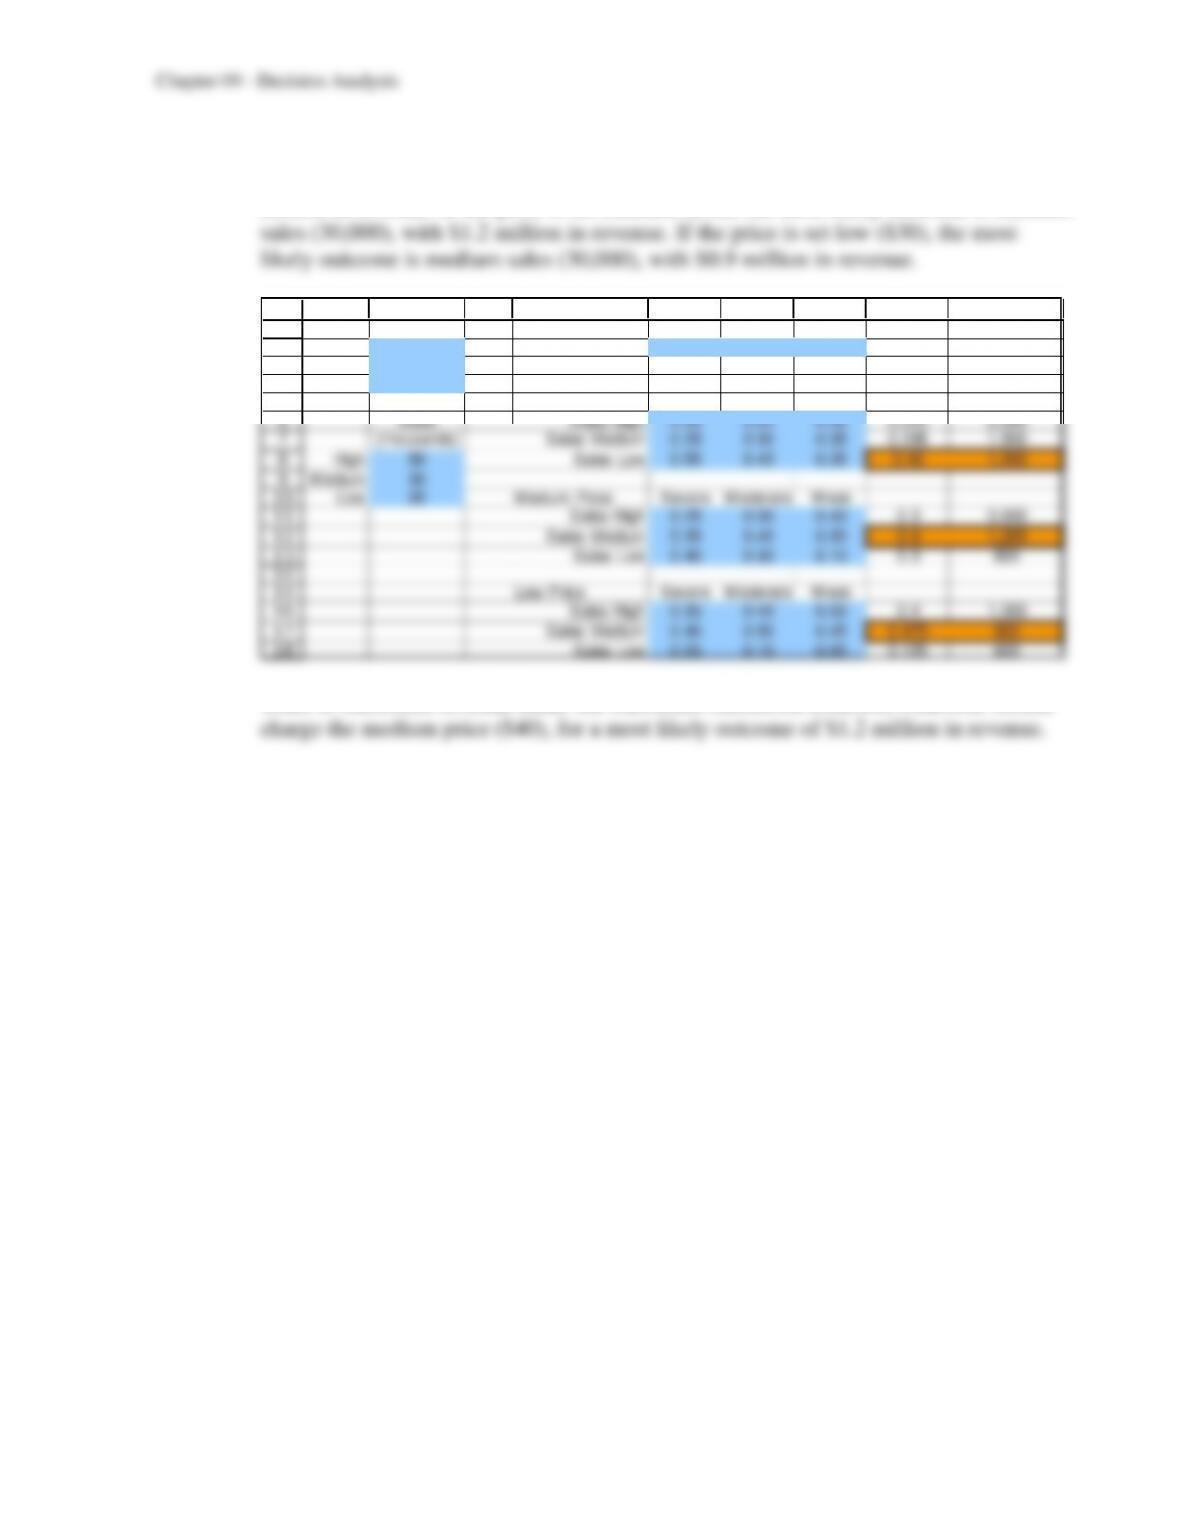
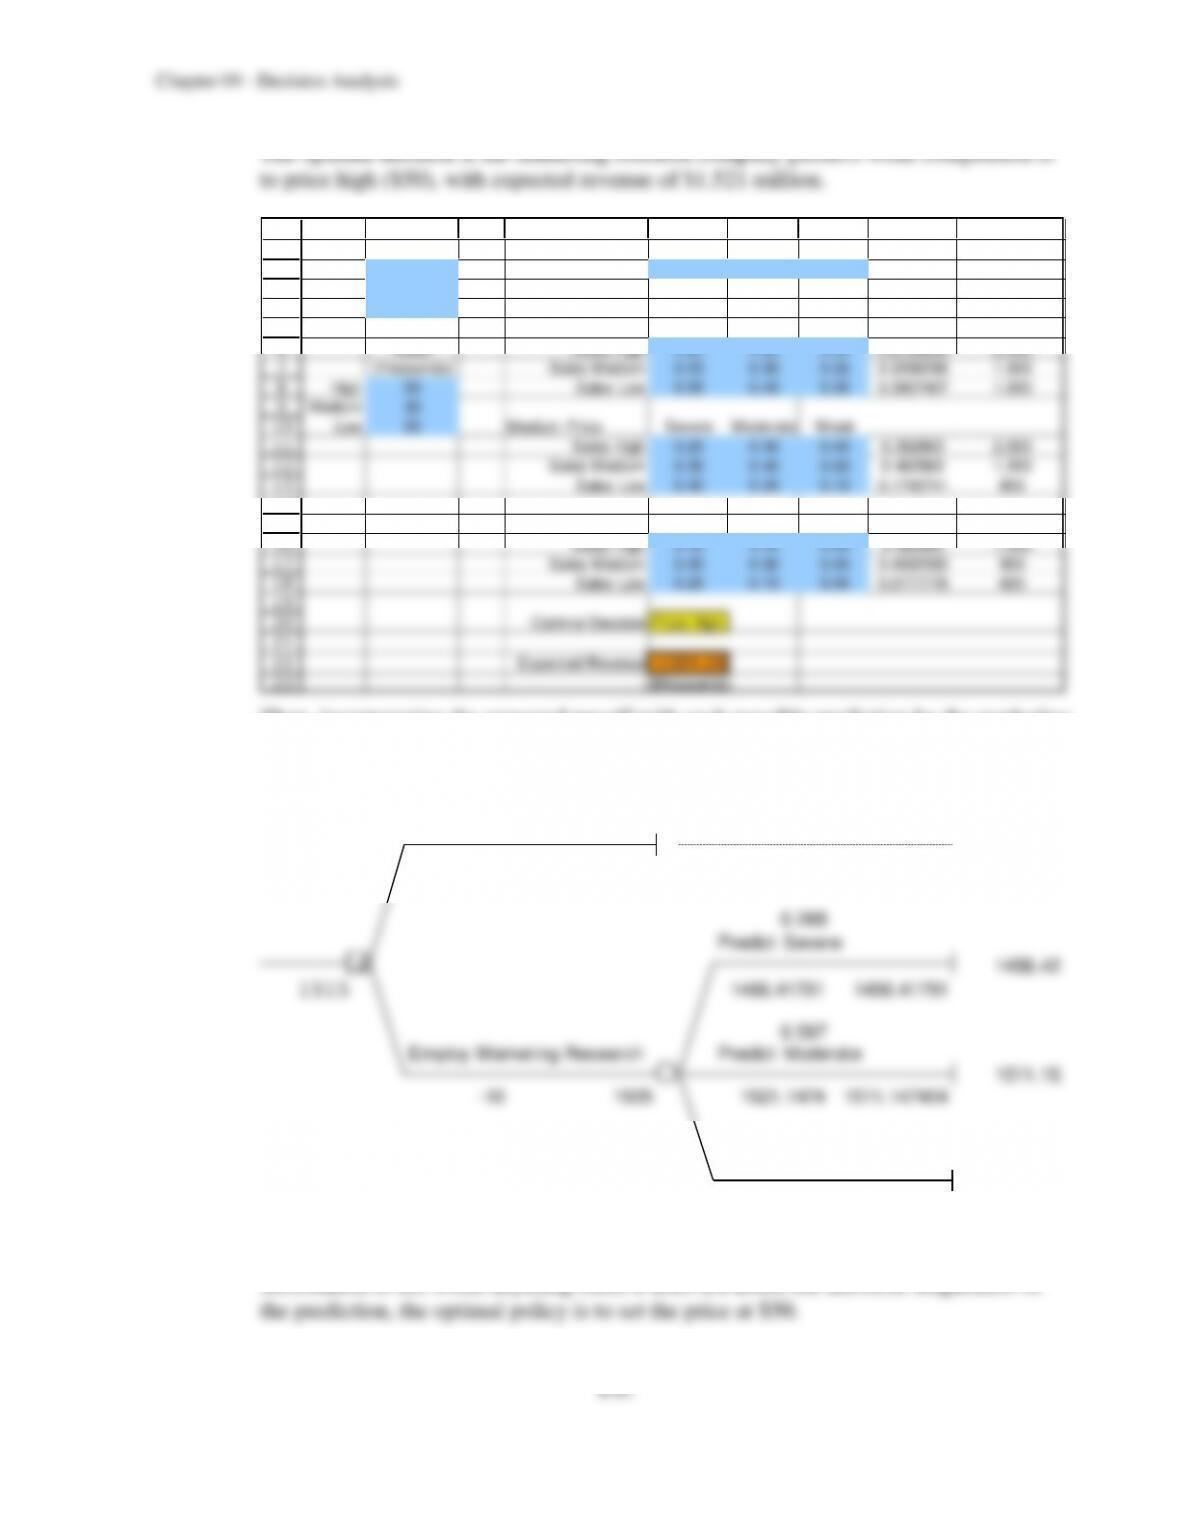
b) The most likely state depends upon the price. As calculated in the spreadsheet below, if
the price is set high ($50), the most likely outcome is low sales (20,000), with $1
million in revenue. If the price is set medium ($40), the most likely outcome is medium
1
2
3
4
5
6
7
8
9
10
11
12
13
14
15
16
17
18
A B C D E F G H I
Price Severe Moderate Weak
High $50 Prior Probability 0.2 0.7 0.1
Medium $40
Low $30 Prior Revenue
High Price Severe Moderate W eak Probability ($thousands)
Sales Sales High 0.20 0.25 0.30 0.245 2,500
(thousands) Sales Medium 0.25 0.30 0.35 0.295 1,500
High 50 Sales Low 0.55 0.45 0.35 0.46 1,000
Medium 30
Low 20 Medium Price Severe Moderate W eak
Sales High 0.25 0.30 0.40 0.3 2,000
Sales Medium 0.35 0.40 0.50 0.4 1,200
Sales Low 0.40 0.30 0.10 0.3 800
Low Price Severe Moderate W eak
Sales High 0.35 0.40 0.50 0.4 1,500
Sales Medium 0.40 0.50 0.45 0.475 900
Sales Low 0.25 0.10 0.05 0.125 600
Thus, to maximize revenue under the maximum likelihood criterion, Charlotte should
9-94
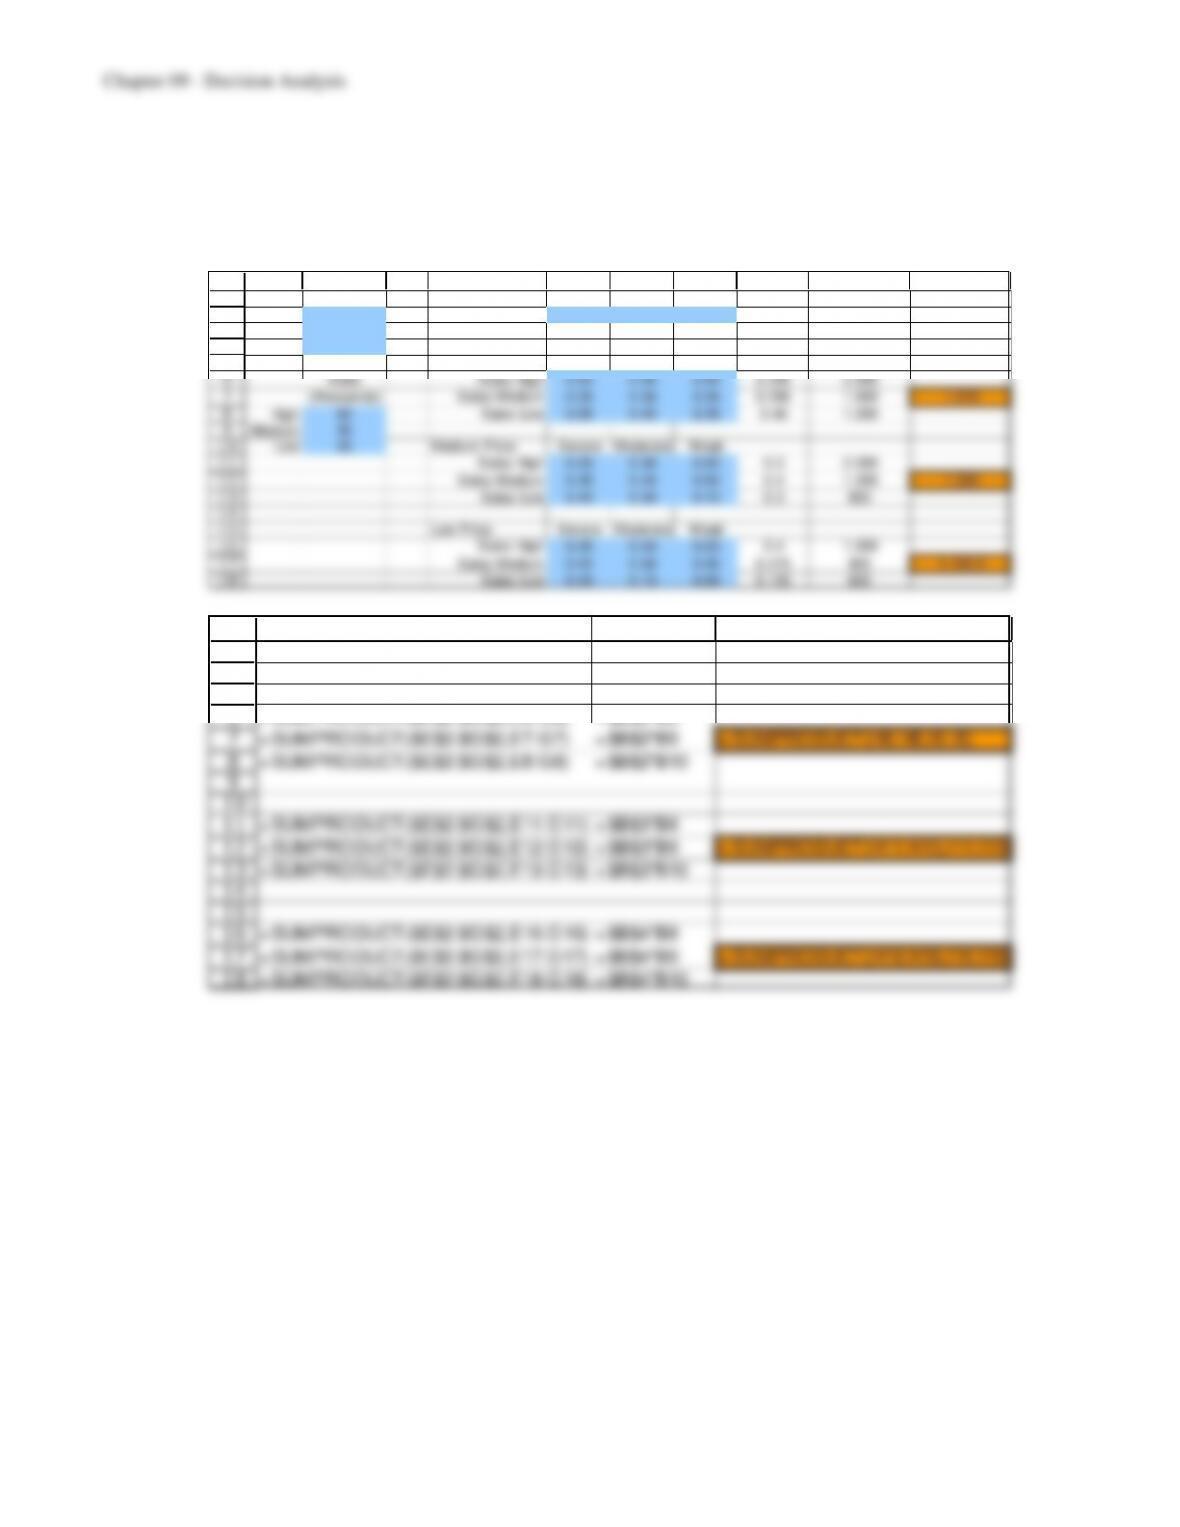
c) As shown in the decision tree for part a (recall that decision trees assume Bayes’
decision rule), Charlotte should charge the high price ($50), since this maximizes the
expected revenue ($1.515 million). Alternatively, the expected revenues for each
possible decision can be calculated directly as shown in the following spreadsheet.
1
2
3
4
5
6
7
8
9
10
11
12
13
14
15
16
17
18
A B C D E F G H I J
Price Severe Moderate Weak
High $50 Prior Probability 0.2 0.7 0.1
Medium $40 Expected
Low $30 Prior Revenue Revenue
High Price Severe Moderate W eak Probability ($thousands) ($thousands)
Sales Sales High 0.20 0.25 0.30 0.245 2,500
(thousands) Sales Medium 0.25 0.30 0.35 0.295 1,500 1,515
High 50 Sales Low 0.55 0.45 0.35 0.46 1,000
Medium 30
Low 20 Medium Price Severe Moderate W eak
Sales High 0.25 0.30 0.40 0.3 2,000
Sales Medium 0.35 0.40 0.50 0.4 1,200 1,320
Sales Low 0.40 0.30 0.10 0.3 800
Low Price Severe Moderate W eak
Sales High 0.35 0.40 0.50 0.4 1,500
Sales Medium 0.40 0.50 0.45 0.475 900 1,102.5
Sales Low 0.25 0.10 0.05 0.125 600
3
4
5
6
7
8
9
10
11
12
13
14
15
16
17
18
H I J
Expected
Prior Revenue Revenue
Probability ($thousands) ($thousands)
= SUMPRODUCT($E$2:$G $2,E6:G 6) = $B$2*B8
= SUMPRODUCT($E$2:$G $2,E7:G 7) = $B$2*B9 = SUMPRO DUCT(H6:H8, I6:I8)
= SUMPRODUCT($E$2:$G $2,E8:G 8) = $B$2*B10
= SUMPRODUCT($E$2:$G $2,E11:G 11) = $B$3*B8
= SUMPRODUCT($E$2:$G $2,E12:G 12) = $B$3*B9 = SUMPRODUCT(H11:H13,I11:I13)
= SUMPRODUCT($E$2:$G $2,E13:G 13) = $B$3*B10
= SUMPRODUCT($E$2:$G $2,E16:G 16) = $B$4*B8
= SUMPRODUCT($E$2:$G $2,E17:G 17) = $B$4*B9 = SUMPRODUCT(H16:H18,I16:I18)
= SUMPRODUCT($E$2:$G $2,E18:G 18) = $B$4*B10
9-95
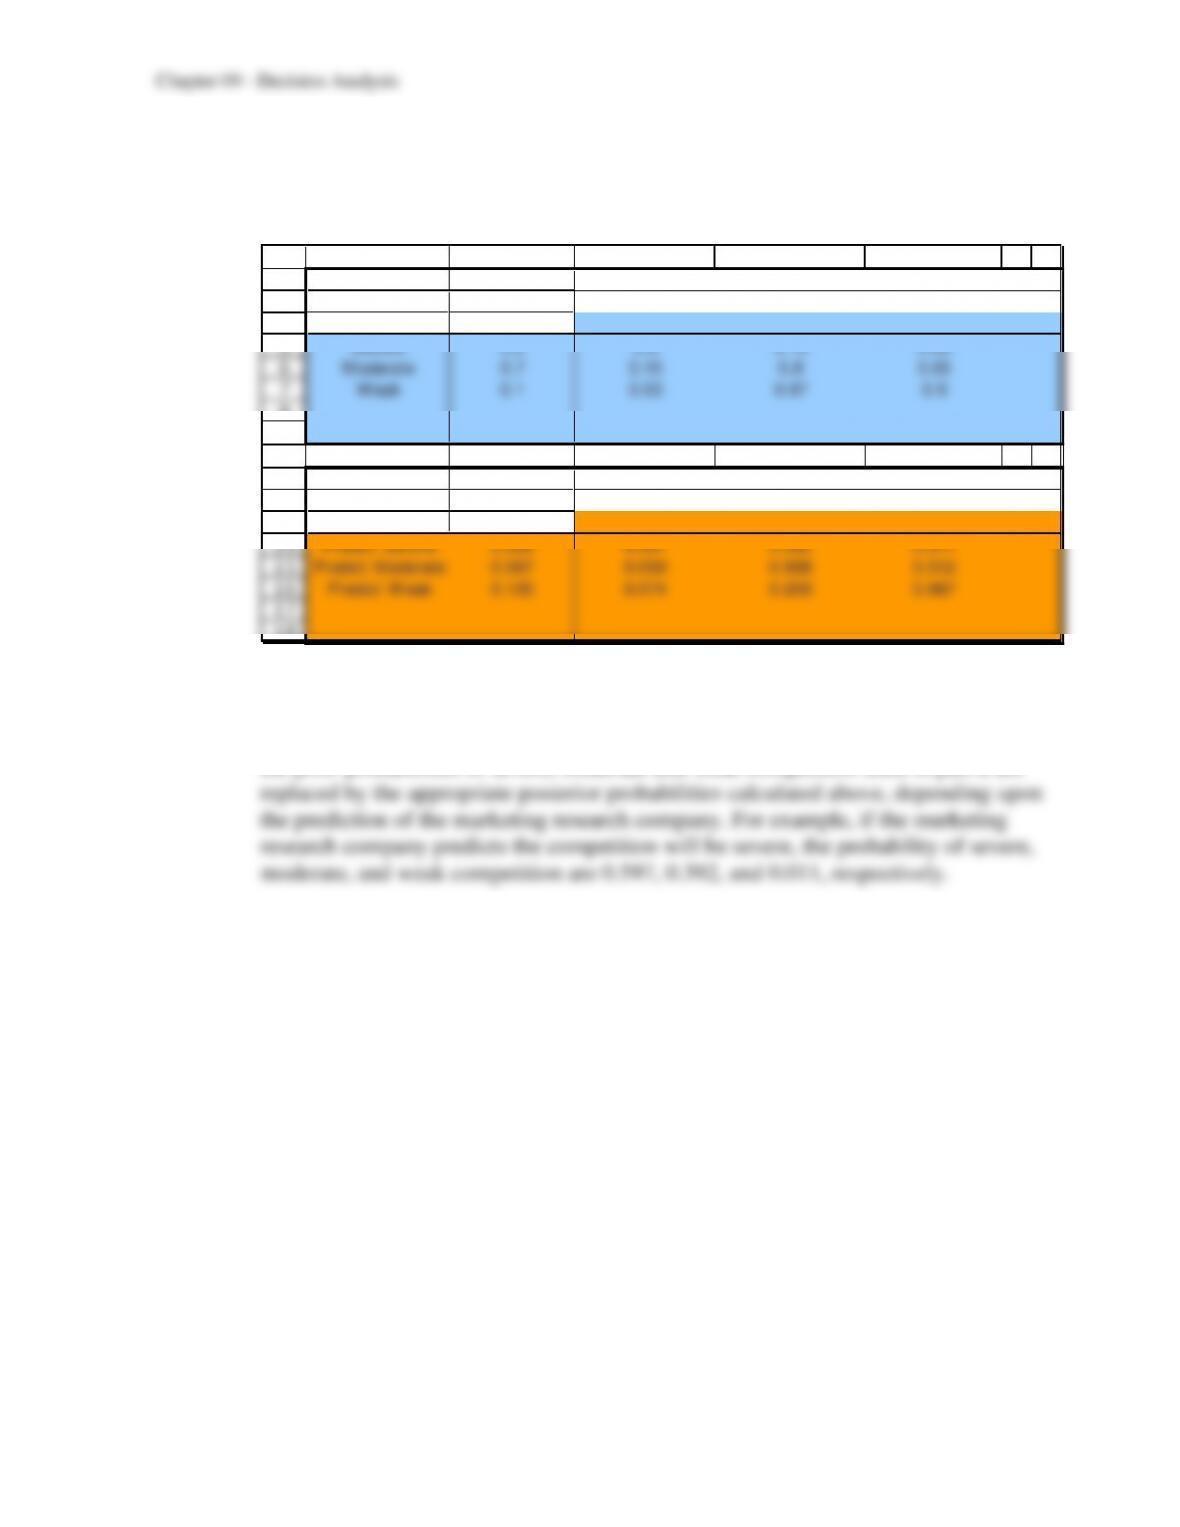
d) With more information from the marketing research company, the posterior
probabilities for the state of competition can be found using the template for posterior
probabilities as follows.
2
3
4
5
6
7
8
9
10
11
12
13
14
15
16
17
18
B C D E F G H
Data:
State of Prior
Nature Probability Predict Severe Predict Moderate Predict W eak
Severe 0.2 0.8 0.15 0.05
Moderate 0.7 0.15 0.8 0.05
W eak 0.1 0.03 0.07 0. 9
Po sterio r
Prob ab il i ties:
F inding P(Finding) Severe Moderate W eak
Predict Severe 0.268 0.597 0.392 0.011
Predict Moderate 0.597 0.050 0.938 0.012
Predict W eak 0.135 0.074 0.259 0.667
P(Finding | State)
Finding
P(State | Finding)
State of Nature
To keep the decision tree from becoming too unwieldy, we will break it into parts. The
first three parts consider the situation after each possible prediction by the marketing
research company. The decision tree from part a is reused with the only change being
the prior probabilities of severe, moderate and weak competition used in part a are
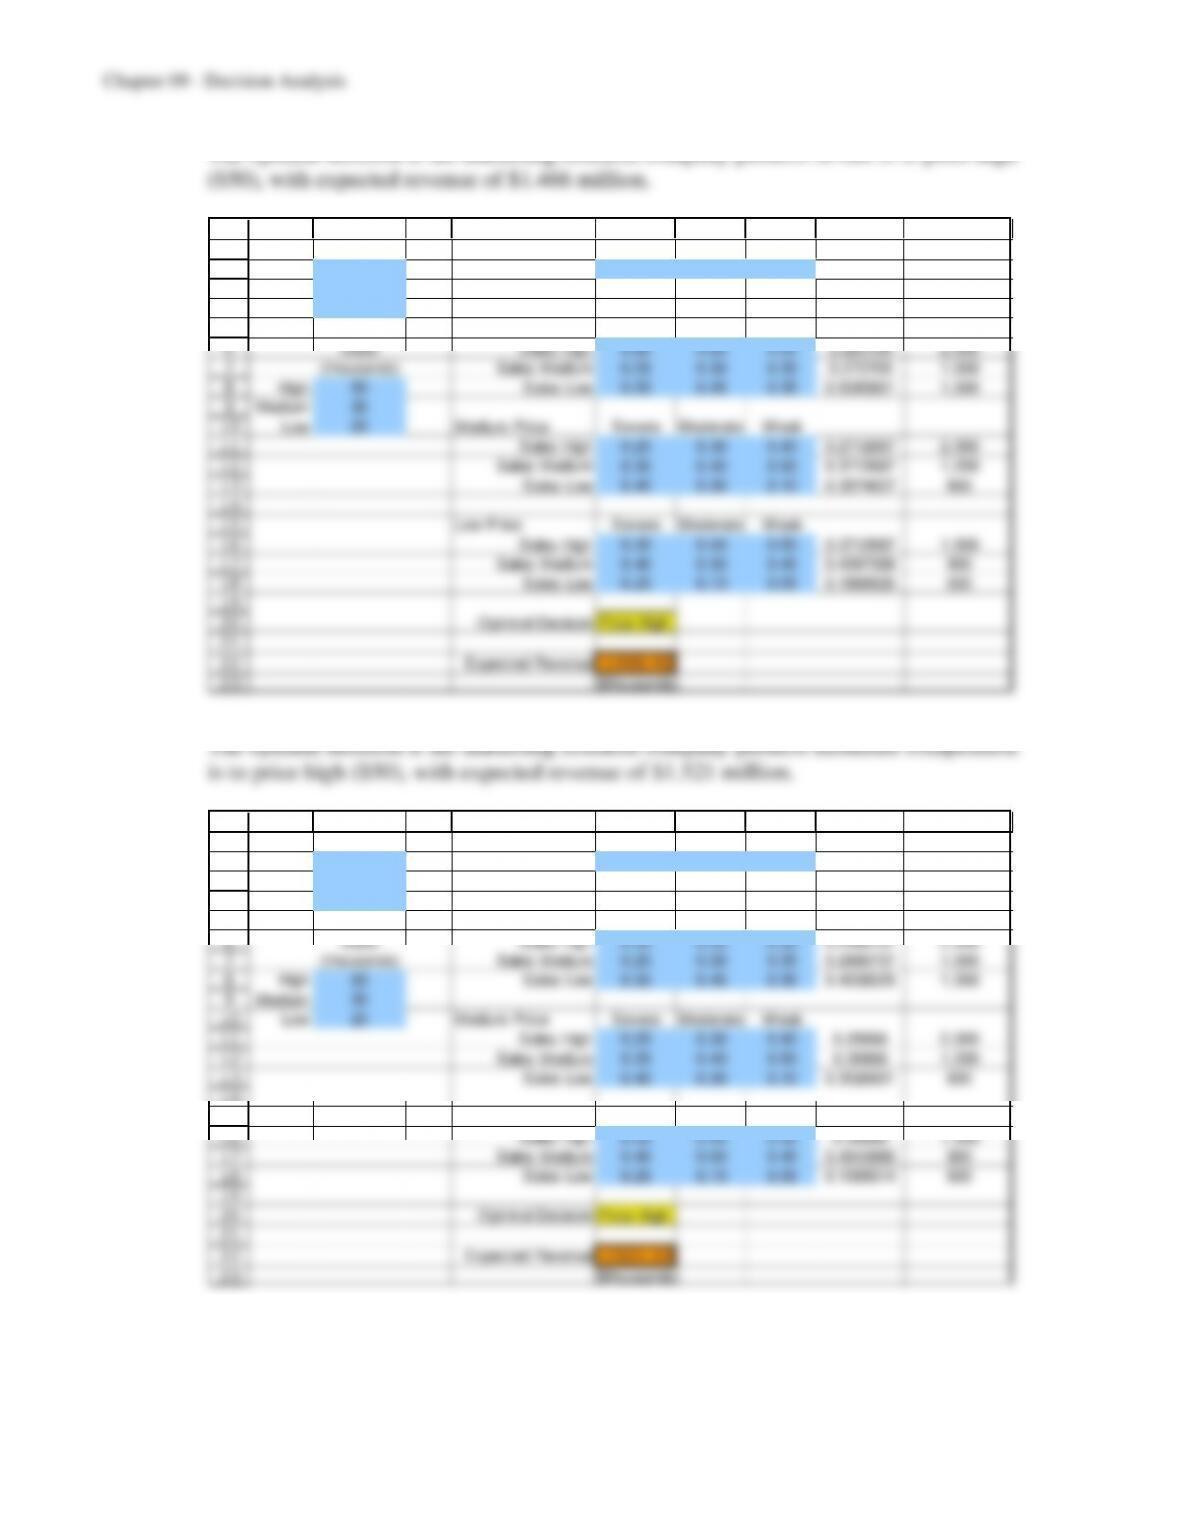
The optimal decision if the marketing research company predicts severe is to price high
1
2
3
4
5
6
7
8
9
10
11
12
13
14
15
16
17
18
19
20
21
22
23
A B C D E F G H I
Price Severe Moderate W eak
High $50 Prior Probability 0.597 0.392 0.011
Medium $40
Low $30 Prior Revenue
High Price Severe Moderate W eak Probability ($thousands)
Sales Sales High 0.20 0.25 0.30 0.220709 2,500
(thousands) Sales Medium 0.25 0.30 0.35 0.270709 1,500
High 50 Sales Low 0.55 0.45 0.35 0.5085821 1,000
Medium 30
Low 20 Medium Price Severe Moderate W eak
Sales High 0.25 0.30 0.40 0.2712687 2,000
Sales Medium 0.35 0.40 0.50 0.3712687 1,200
Sales Low 0.40 0.30 0.10 0.3574627 800
Low Price Severe Moderate W eak
Sales High 0.35 0.40 0.50 0.3712687 1,500
Sales Medium 0.40 0.50 0.45 0.4397388 900
Sales Low 0.25 0.10 0.05 0.1889925 600
Optimal Decision Price High
Expected Revenue 1466.42
($thousands)
1
2
3
4
5
6
7
8
9
10
11
12
13
14
15
16
17
18
A B C D E F G H I
Price Severe Moderate W eak
High $50 Prior Probability 0.050 0.938 0.012
Medium $40
Low $30 Prior Revenue
High Price Severe Moderate W eak Probability ($thousands)
Sales Sales High 0.20 0.25 0.30 0.2480737 2,500
(thousands) Sales Medium 0.25 0.30 0.35 0.2980737 1,500
High 50 Sales Low 0.55 0.45 0.35 0.4538526 1,000
Medium 30
Low 20 Medium Price Severe Moderate W eak
Sales High 0.25 0.30 0.40 0.29866 2,000
Sales Medium 0.35 0.40 0.50 0.39866 1,200
Sales Low 0.40 0.30 0.10 0.3026801 800
Low Price Severe Moderate W eak
Sales High 0.35 0.40 0.50 0.39866 1,500
Sales Medium 0.40 0.50 0.45 0.4943886 900
Sales Low 0.25 0.10 0.05 0.1069514 600
1
2
3
4
5
6
7
8
9
10
11
12
13
14
15
16
17
18
19
20
21
22
23
A B C D E F G H I
Price Severe Moderate W eak
High $50 Prior Probability 0.074 0.259 0.667
Medium $40
Low $30 Prior Revenue
High Price Severe Moderate W eak Probability ($thousands)
Sales Sales High 0.20 0.25 0.30 0.2796296 2,500
(thousands) Sales Medium 0.25 0.30 0.35 0.3296296 1,500
High 50 Sales Low 0.55 0.45 0.35 0.3907407 1,000
Medium 30
Low 20 Medium Price Severe Moderate W eak
Sales High 0.25 0.30 0.40 0.362963 2,000
Sales Medium 0.35 0.40 0.50 0.462963 1,200
Sales Low 0.40 0.30 0.10 0.1740741 800
Low Price Severe Moderate W eak
Sales High 0.35 0.40 0.50 0.462963 1,500
Sales Medium 0.40 0.50 0.45 0.4592593 900
Sales Low 0.25 0.10 0.05 0.0777778 600
Optimal Decision Price High
Expected Revenue 1584.26
($thousands)
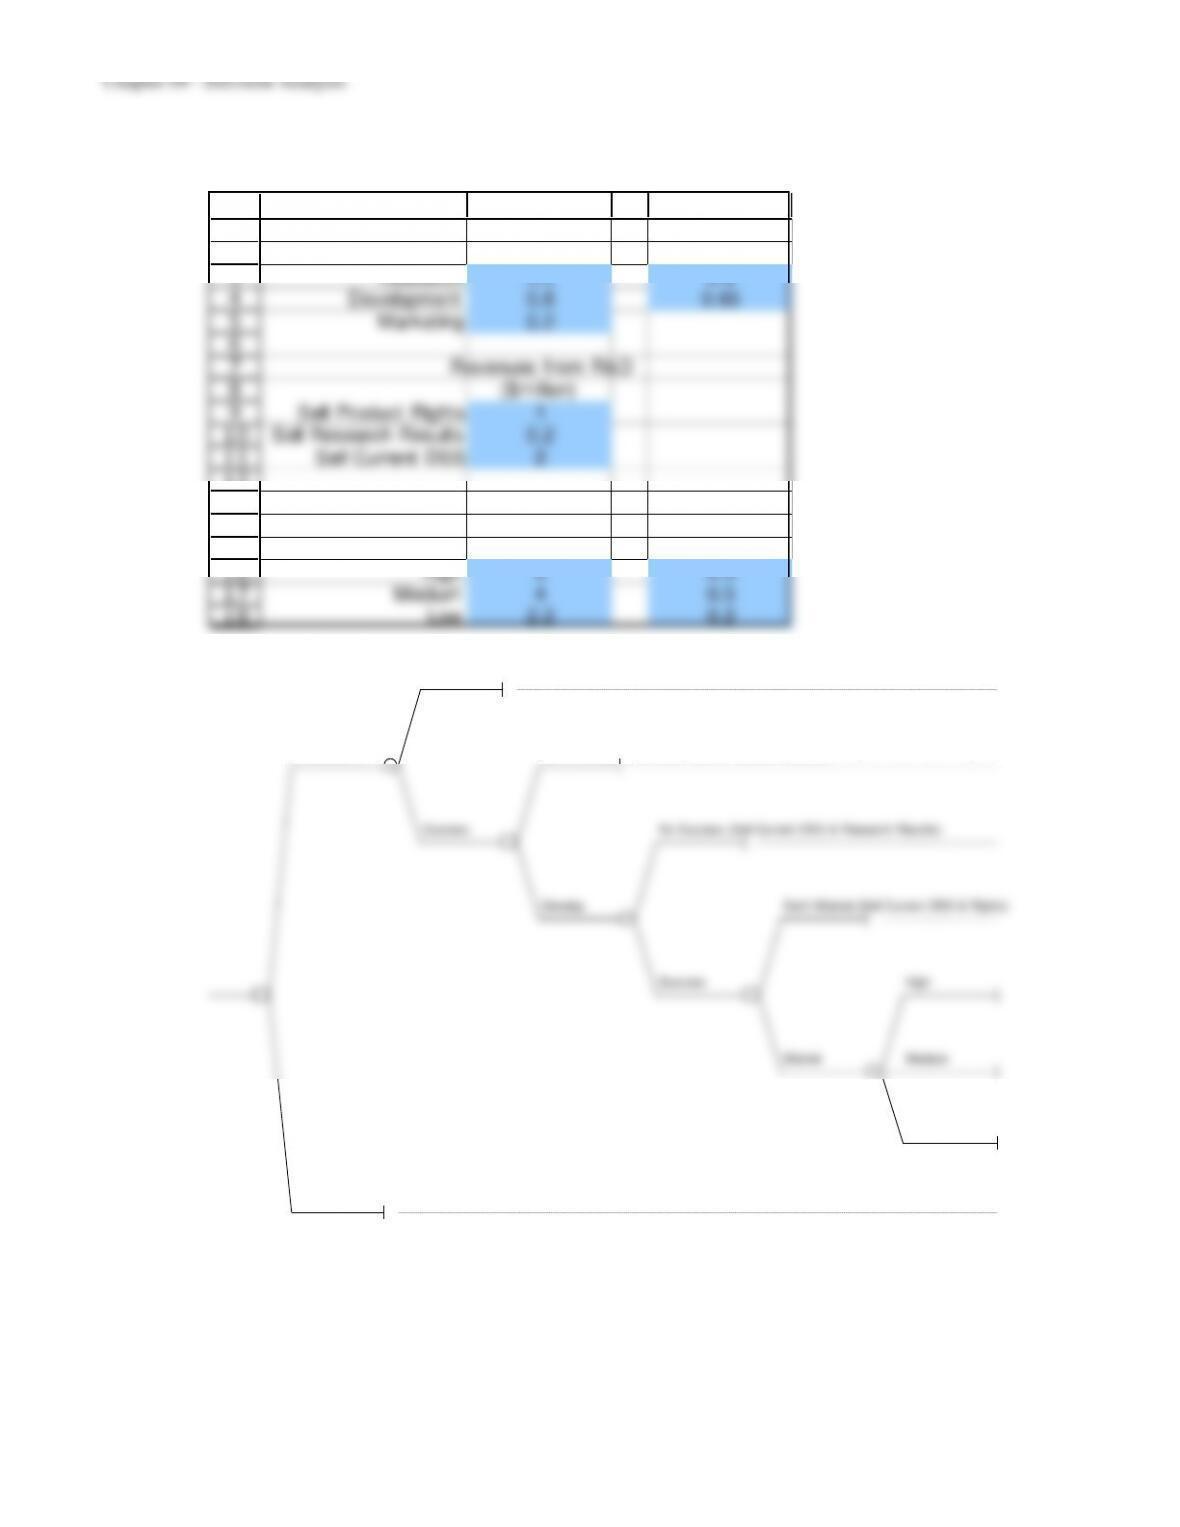
Then, incorporating the expected payoff with each possible prediction by the marketing
company, along with the expected revenue without information from part a, we
combine the whole problem into the following decision tree.
Proceed with no info
1515
1515 1 515
0.268
Predict Severe
11456.42
1515 1466.41791 1456.41791
0.597
Employ Marketing Research Predict Moderate
1511.15
-10 1505 1521.1474 1511.147404
0.135
Predict Weak
1574.26
9-98
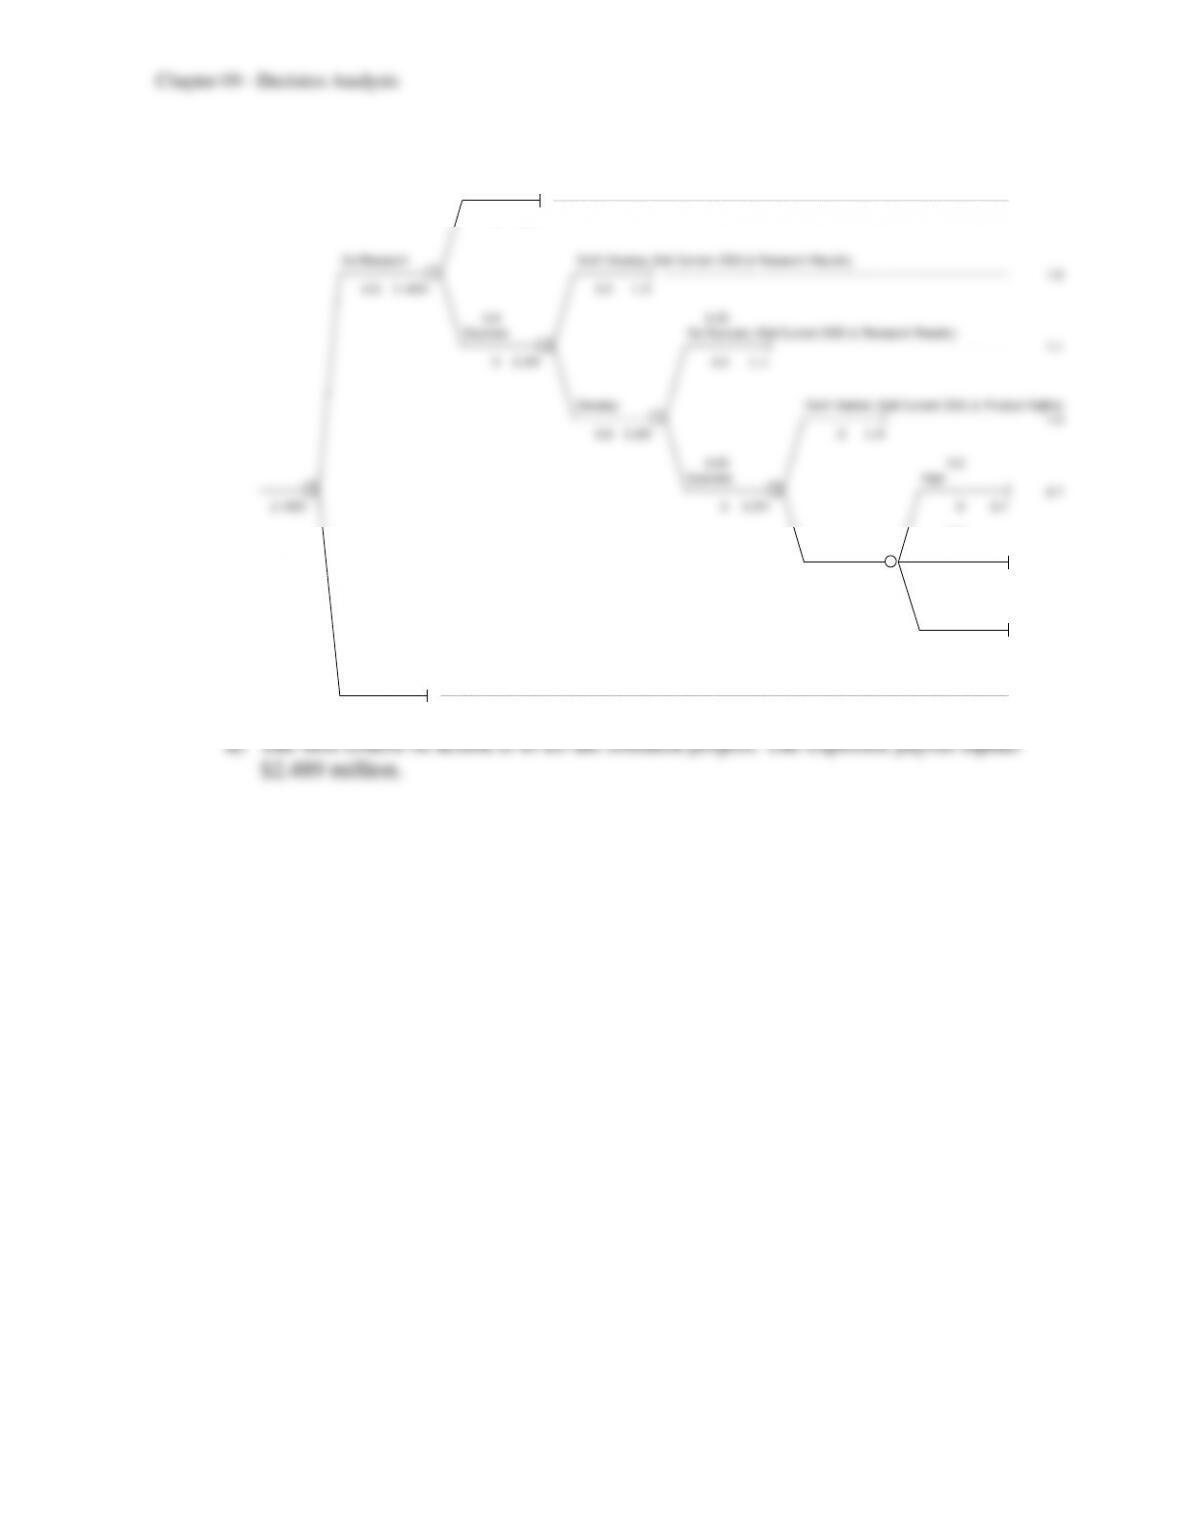
9.4 a) The available data are summarized in the following spreadsheet.
1
2
3
4
5
6
7
8
9
10
11
12
13
14
15
16
17
18
A B C D
Costs Probability
($million) of Success
Research 0.3 0.8
Development 0.8 0.65
Marketing 0.2
Revenues from R&D
($million)
Sell Product Rights 1
Sell Research Results 0.2
Sell Current DSS 2
Sales
Revenue
($million) Probability
High 8 0.3
Medium 4 0.5
Low 2.2 0.2
b) The basic decision tree is shown below.
No Success (Sell Current DSS)
Do Research Don‘t Develop (Sell Current DSS & Research Results)
Success No Success (Sell Current DSS & Research Results)
Develop Don‘t Market (Sell Current DSS & Rights)
Success High
Market Medium
9-99
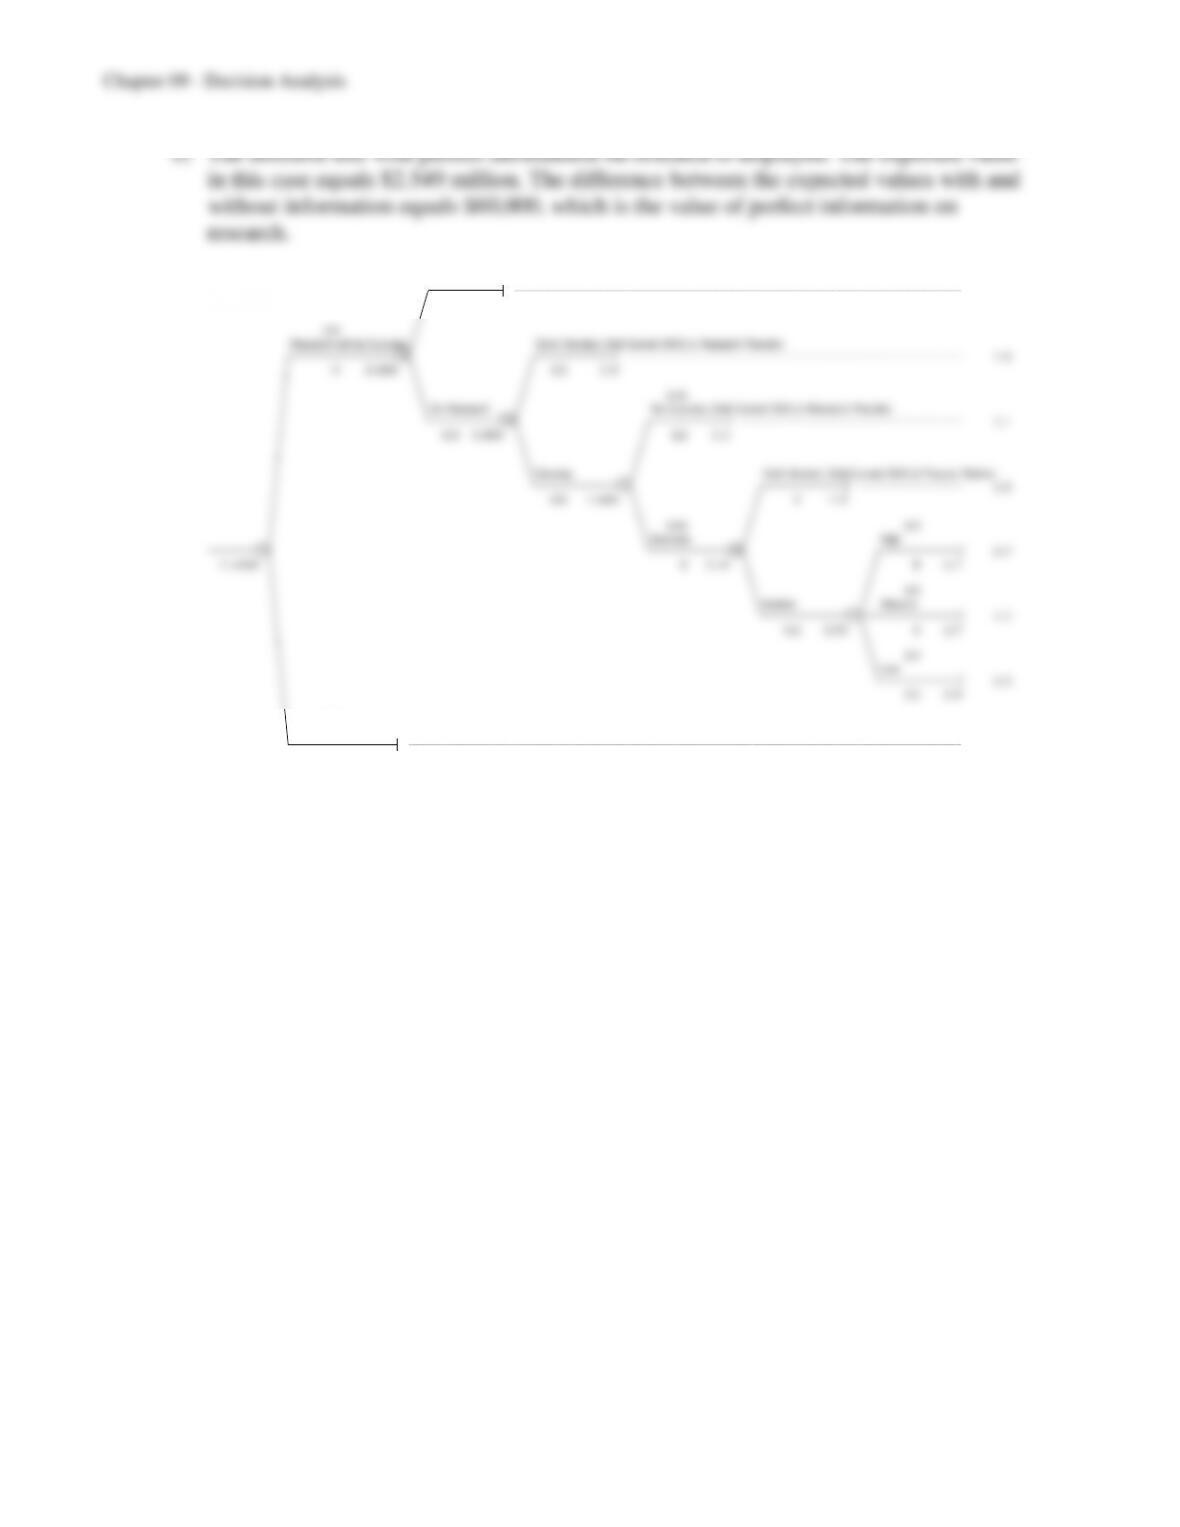
c) The decision tree displays all the expected payoffs and probabilities.
0.2
No Success (Sell Current DSS)
1.7
21.7
Do Research Don’t Develop (Sell Current DSS & Research Results)
1.9
-0.3 2.489 2.2 1.9
0.8 0.35
Success No Success (Sell Current DSS & Research Results)
21.1
02.69 2.2 1.1
Develop Don’t Market (Sell Current DSS & Product Rights)
1.9
-0.8 2.69 31.9
0.65 0.3
Success High
1 2 6.7
2.489 03 .54 8 6.7
0.5
Market Medium
2.7
-0.2 3.54 4 2.7
0.2
Low
0.9
2.2 0.9
Don’t do Research (Sell Current DSS)
2
2 2
No Research (Sell Current DSS)
2
22
0.8
Research will be Success Don‘t Develop (Sell Current DSS & Research Results)
2 1.9
02.686 2.2 1.9
0.35
Do Research No Success (Sell Current DSS & Research Results)
2 1.1
-0.3 2.686 2.2 1.1
Develop Don‘t Market (Sell Current DSS & Product Rights)
1.9
-0.8 2.686 31.9
0.65 0.3
Success High
2 6.7
2.5488 03 .54 86 .7
0.5
Market Medium
2.7
-0.2 3.54 42.7
0.2
Low
0.9
2.2 0 .9
0.2
Research won‘t be Successful (Sell Current DSS)
2
22
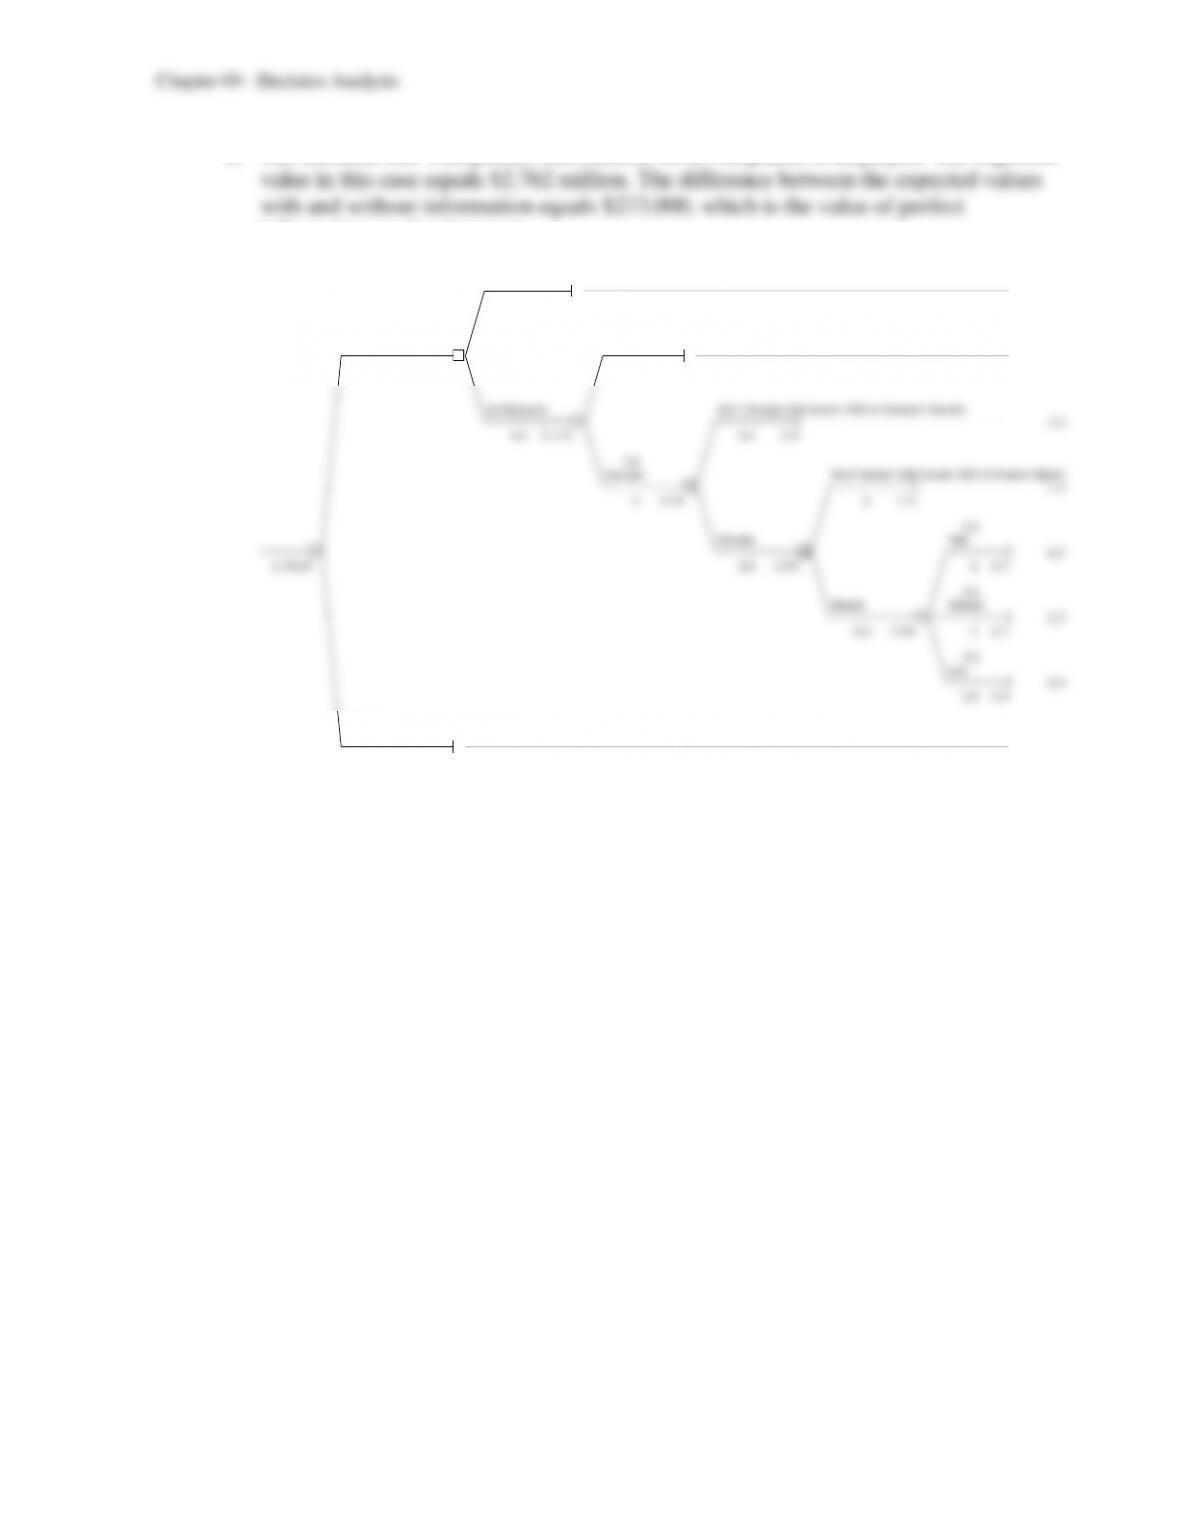
f) The decision tree with perfect information on development is displayed. The expected
information on development.
No Research (Sell Current DSS)
2
22
0.65 0.2
Development Successful No Success (Sell Current DSS)
2 1.7
03.172 21 .7
Do Research Don‘t Develop (Sell Current DSS & Research Results)
1.9
-0.3 3.172 2.2 1 .9
0.8
Success Don‘t Market (Sell Current DSS & Product Rights)
2 1.9
03.54 31.9
0.3
Develop High
2 6.7
2.761 8 –0.8 3.54 86.7
0.5
Market Medium
2.7
-0.2 3.54 42.7
0.2
Low
0.9
2.2 0.9
0.35
Development would not be Successful (Sell Current DSS
2
22
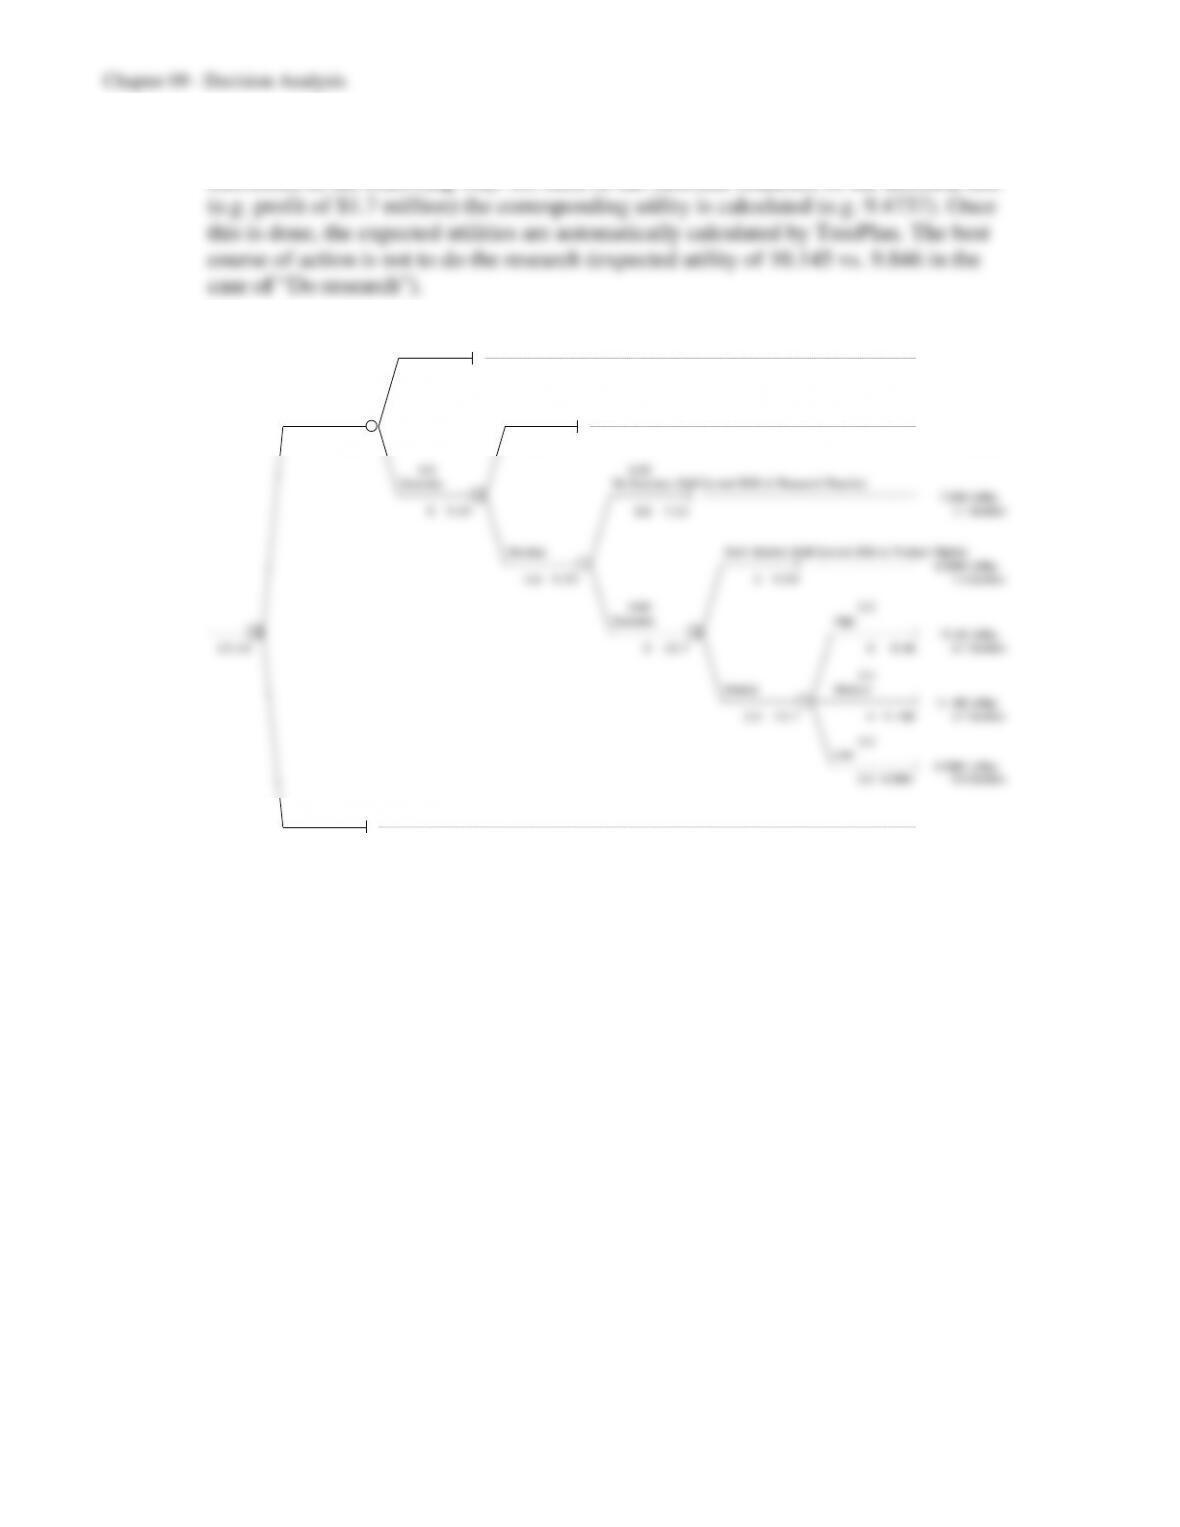
g-i) The decision tree with expected utilities is displayed. The expected utilities are
calculated in the following way: for each of the outcome branches of the decision tree
0.2
No Success (Sell Current DSS)
9.4737 Utility
29.47 1.7 $million
Do Research Don’t Develop (Sell Current DSS & Research Results)
9.9394 Utility
-0.3 9.846 2.2 9.94 1.9 $million
0.8 0.35
Success No Success (Sell Current DSS & Research Results)
17.506 Utility
09.94 2.2 7 .51 1.1 $million
Develop Don’t Market (Sell Current DSS & Product Rights)
9.9394 Utility
-0.8 9.55 39.94 1.9 $million
0.65 0.3
Success High
2 2 12.46 Utility
10.14 010.7 8 12.46 6.7 $million
0.5
Market Medium
11.189 Utility
-0.2 10.7 4 11.189 2.7 $million
0.2
Low
6.5991 Utility
2.2 6.5991 0.9 $million
Don’t do Research (Sell Current DSS)
10.145 Utility
2 10.145 2 $million
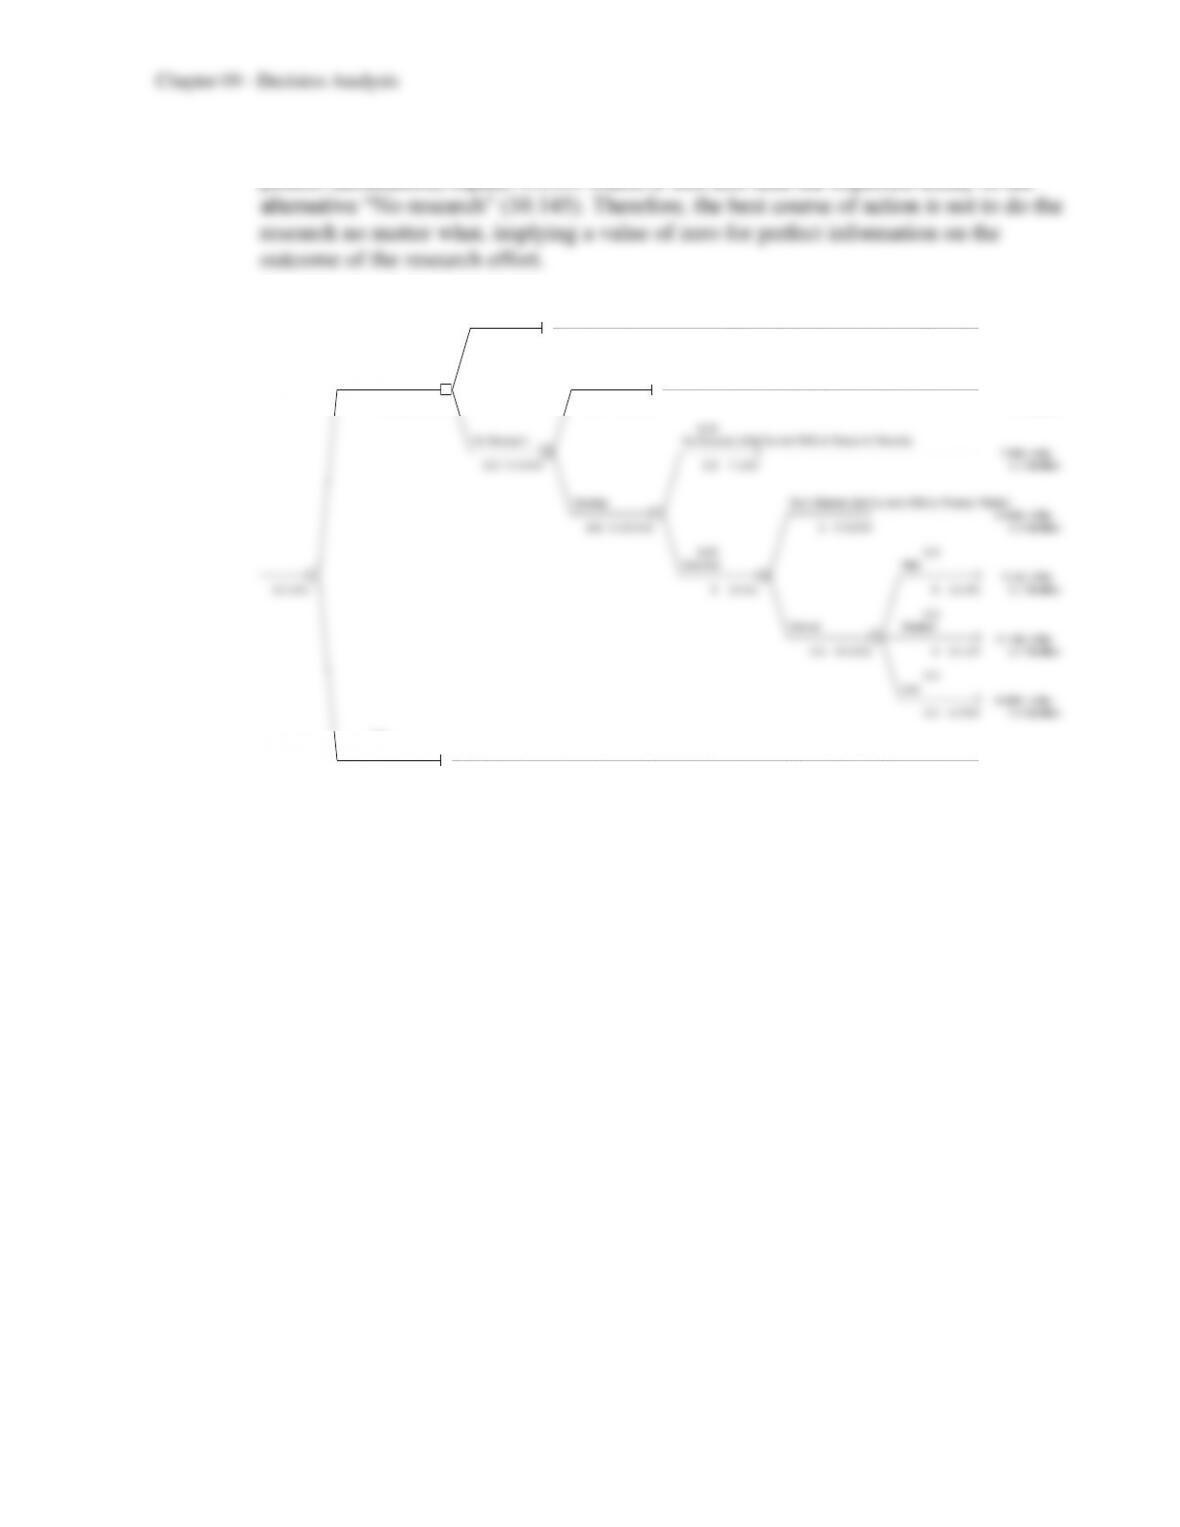
j) The expected utility of doing research, even if we know it will be successful (with
perfect information) equals 9.9394 which is still less than the expected utility of the
No Research (Sell Current DSS)
10.145 Utility
210.145 2 $million
0.8
Research will be Success Don‘t Develop (Sell Current DSS & Research Results)
19.9394 Utility
010.14469 2.2 9.9394 1.9 $million
0.35
Do Research No Success (Sell Current DSS & Research Results)
17.506 Utility
-0.3 9.9394 2.2 7.506 1.1 $million
Develop Don‘t Market (Sell Current DSS & Product Rights)
9.9394 Utility
-0.8 9.55102 39.9394 1.9 $million
0.65 0.3
Success High
212.46 Utility
10.145 010.65 812.46 6.7 $million
0.5
Market Medium
11.189 Utility
-0.2 10.652 411.19 2.7 $million
0.2
Low
6.5991 Utility
2.2 6 .59 9 0.9 $million
0.2
Research won’t be Successful (Sell Current DSS)
10.145 Utility
210.14469 2 $million
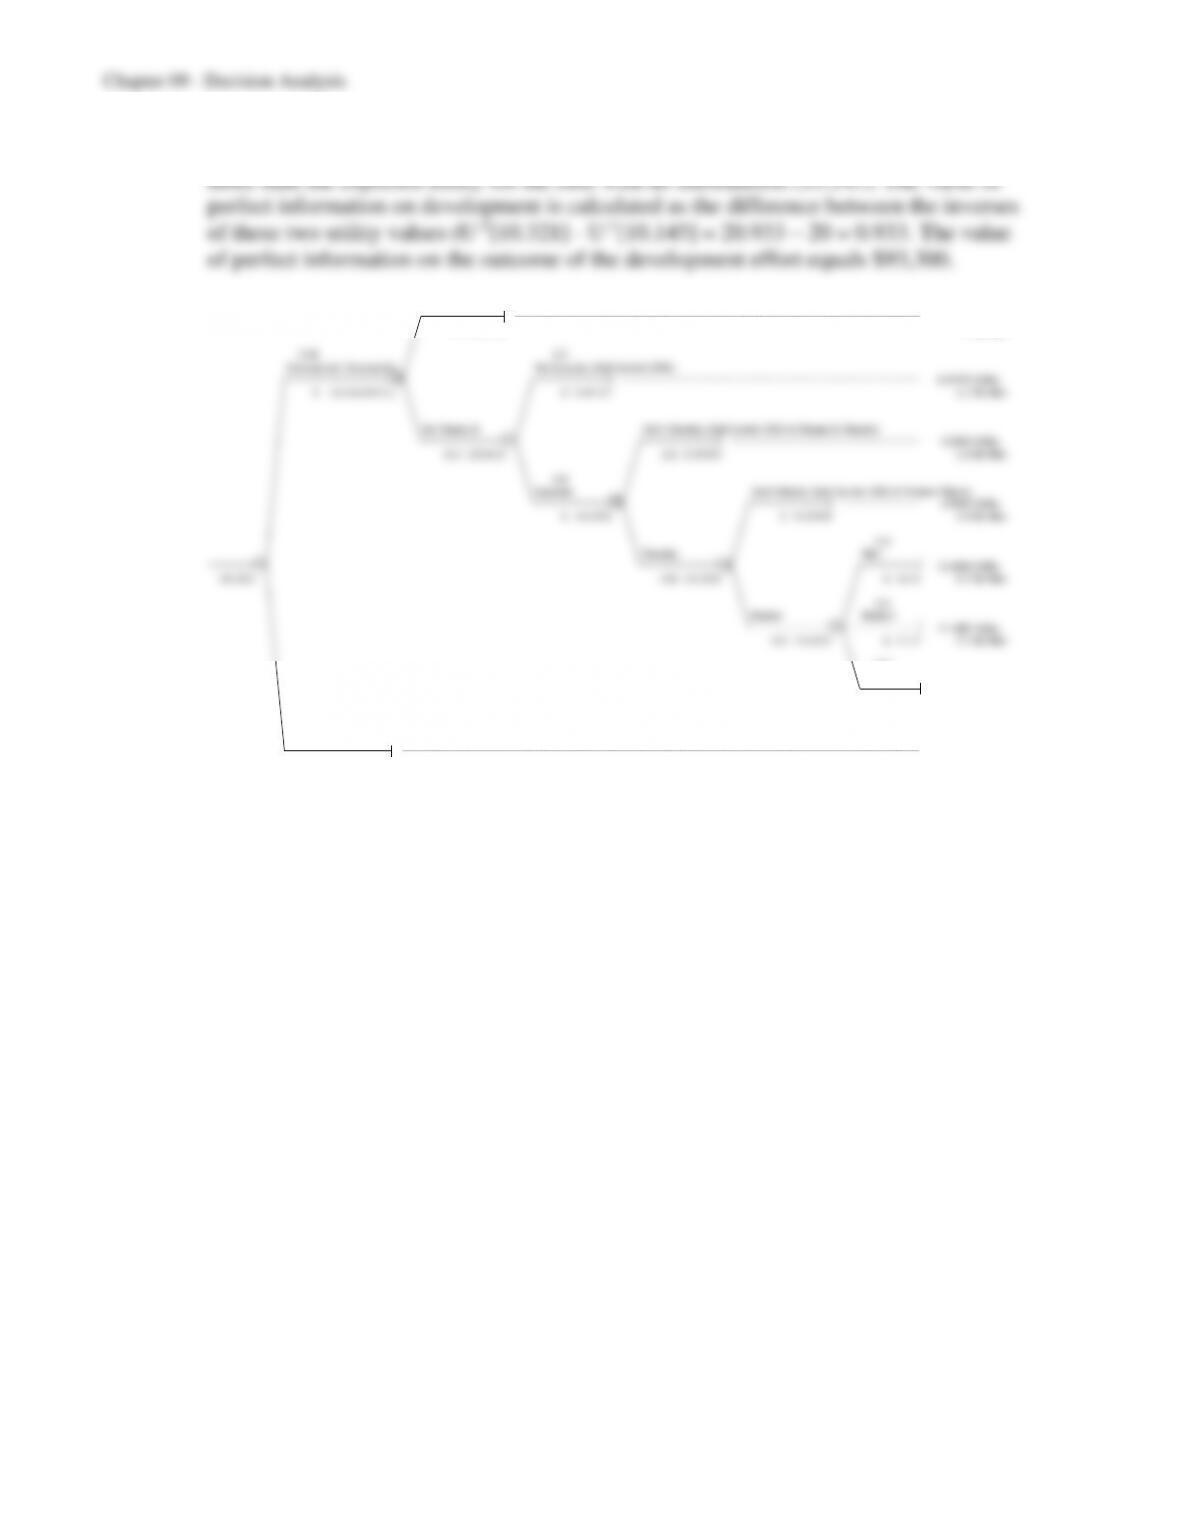
k) The expected utility for perfect information on development equals 10.321 which is
No Research (Sell Current DSS)
10.1447 Utility
210.145 2 $million
0.65 0.2
Development Successful No Success (Sell Current DSS)
29.47375 Utility
010.4164711 29.47 37 1.7 $million
Do Research Don‘t Develop (Sell Current DSS & Research Results)
9.9394 Utility
-0.3 10.41 6 2.2 9 .93 9 4 1.9 $million
0.8
Success Don‘t Market (Sell Current DSS & Product Rights)
29.9394 Utility
010.652 39 .93 9 4 1.9 $million
0.3
Develop High
212.4599 Utility
10.321 –0.8 1 0.6 52 812.5 6 .7 $million
0.5
Market Medium
11.1887 Utility
-0.2 10.65 2 41 1.2 2.7 $million
0.2
Low
6.59908 Utility
2.2 6 .6 0.9 $million
0.35
Development would not be Successf ul (Sell Current DSS
10.1447 Utility
210.1446871 2 $million