8-35
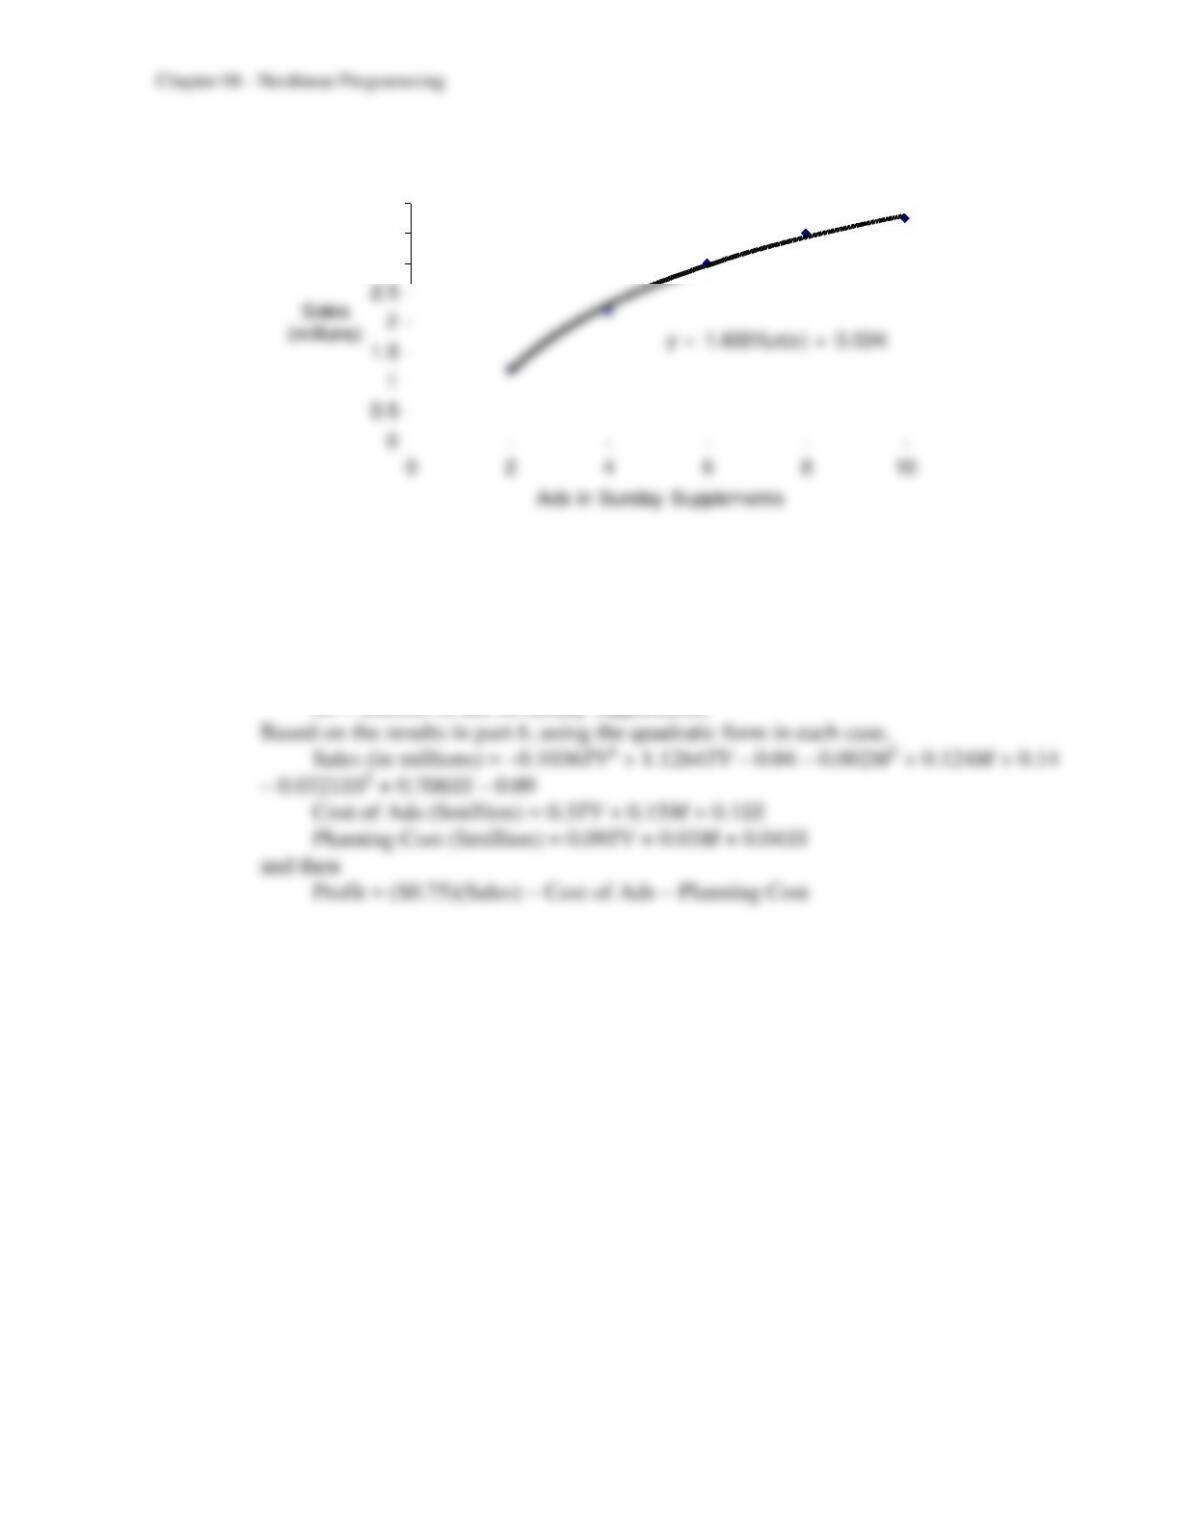
Ads in Sunday Supplements (Logarithmic Form)
y = 1.6331Ln(x) + 0.0343
0
0.5
1
1.5
2
2.5
3
3.5
4
0 2 4 6 8 10
Ads in Sunday Supplements
Sales
(millions)
In all three cases, the quadratic form is a close fit. The order-3 polynomial is also a
good fit. The logarithmic form is not a bad fit, but not as close as the polynomial forms.
We will use the quadratic form for the remainder of the case.
c) Let TV = number of TV spots
M = number of magazine ads
SS = number of ads in sunday supplements
8-36
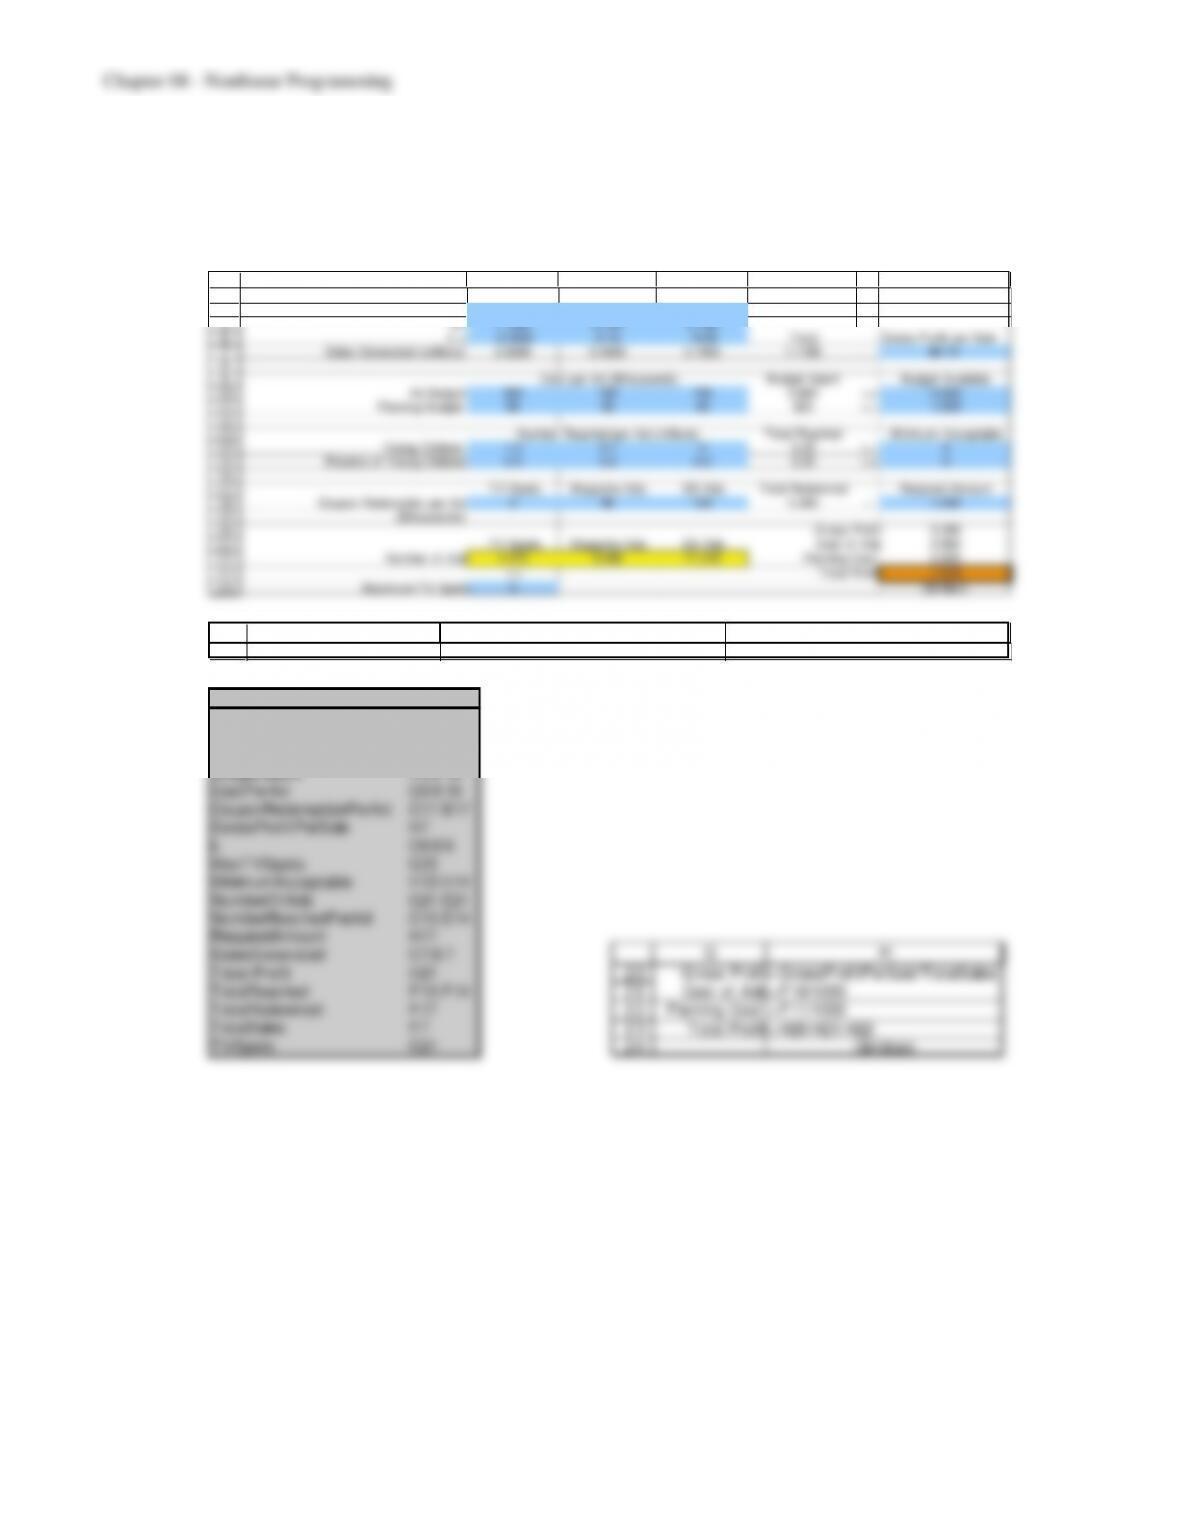
d) The total sales generated are calculated in row 7 using the nonlinear equations from
part b. Then, the gross profit from sales are calculated in H20. The TotalProfit (H23) is
the gross profit minus the cost of ads minus the planning cost. Maximizing the
TotalProfit yields the following solution.
3
4
5
6
7
8
9
10
11
12
13
14
15
16
17
18
19
20
21
22
23
24
B C D E F G H
Sales per Ad = ax^2 + bx + k, where TV Spots Magazine Ads SS Ads
a= -0.1036 -0.002 -0.0321
b= 1.1264 0.124 0.706
k = -0.0400 0.14 -0.09 Total Gross Profit per Sale
Sales Generated (millions) 2.8296 0.5600 3.7903 7.1799 $0.75
Cost per Ad ($thousands) Budget Spent Budget Available
Ad Budget 300 150 100 2,884 <= 4,000
Planning Budget 90 30 40 923 <= 1,000
Number Reached per Ad (millions) Total Reached Minimum Acceptable
Young Children 1.2 0.1 0 5.25 >= 5
Parents of Young Children 0.5 0.2 0.2 5.00 >= 5
TV Spots Magazine Ads SS Ads Total Redeemed Required Amount
Coupon Redemption per Ad 0 40 120 1,490 = 1,490
($thousands)
Gross Profit 5.385
TV Spots Magazine Ads SS Ads Cost of Ads 2.884
Number of Ads 4.075 3.596 11.218 Planning Cost 0.923
<= Total Profit 1.578
Maximum T V Spots 5 ($million)
7
B C D
Sales Generated (millions) =a*(NumberOfAds)^2+b*NumberOfAds+k =a*(NumberOfAds)^2+b*NumberOfAds+k
Ran ge Name Cells
a C4:E4
b C5:E5
BudgetAvailable H9:H10
BudgetSpent F9:F10
CostPerAd C9:E10
CouponRedemptionPerAd C17:E17
GrossProfitPerSale H7
k C6:E6
MaxTVSpots C23
MinimumAcceptable H13:H14
NumberOfAds C21:E21
NumberReachedPerAd C13:E14
RequiredAmount H17
SalesGenerated C7:E7
Total Profit H21
TotalReached F13:F14
TotalRedeemed F17
TotalSales F7
TVSpots C21
20
21
22
23
24
G H
Gross Profit= GrossProfitPerSale*TotalSales
Cost of Ads= F10/1000
Planning Cost =F11/1000
Total Profit = H20-H21-H22
($million)
8-37
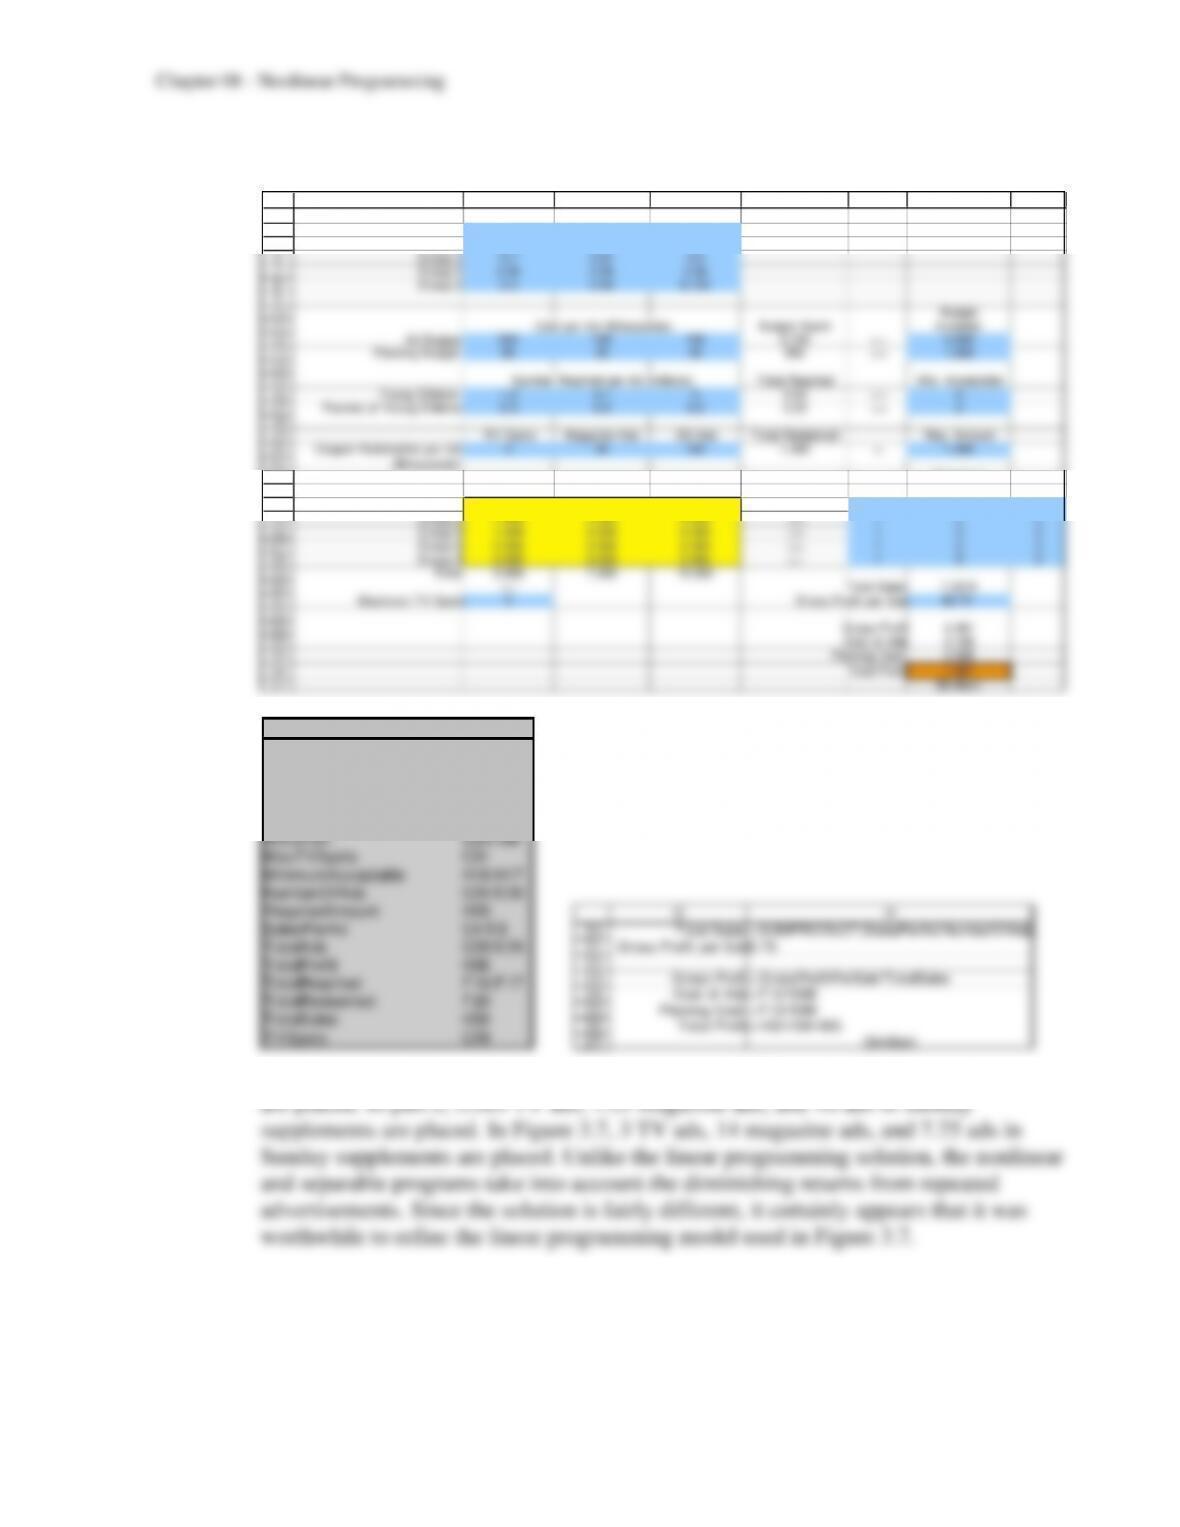
e) The separable programming formulation is as follows.
3
4
5
6
7
8
9
10
11
12
13
14
15
16
17
18
19
20
21
22
23
24
25
26
27
28
29
30
31
32
33
34
35
36
37
B C D E F G H I
Sales per Ad TV Spots Magazine Ads SS Ads
Group 1 1 0.14 0.6
Group 2 0.75 0.1 0.5
Group 3 0.7 0.07 0.4
Group 4 0.35 0.05 0.25
Group 5 0.2 0.04 0.125
Budget
Cost per Ad ($thousands) Budget Spent Available
Ad Budget 300 150 100 3,156 <= 4,000
Planning Budget 90 30 40 938 <= 1,000
Number Reached per Ad (millions) Total Reached Min. Acceptable
Young Children 1.2 0.1 0 5.00 >= 5
Parents of Young Children 0.5 0.2 0.2 5.23 >= 5
TV Spots Magazine Ads SS Ads Total Redeemed Req. Amount
Coupon Redemption per Ad 0 40 120 1,490 = 1,490
($thousands)
Maximum
Number of Ads T V Spots Magazine Ads SS Ads TV Spots Magazine Ads SS Ads
Group 1 1.000 5.000 2.000 <= 1 5 2
Group 2 1.000 2.250 2.000 <= 1 5 2
Group 3 1.000 0.000 2.000 <= 1 5 2
Group 4 0.563 0.000 2.000 <= 1 5 2
Group 5 0.000 0.000 2.000 <= 1 5 2
Total 3.563 7.250 10.000
<= Total Sales 7.3219
Maximum TV Spots 5 Gross Profit per Sale $0.75
Gross Profit 5.491
Cost of Ads 3.156
Planning Cost 0.938
Total Profit 1.397
($million)
Rang e Name Cells
BudgetAvailable H12:H13
BudgetSpent F12:F13
CostPerAd C12:E13
CouponRedemptionPerAd C20:E20
GrossProfitPerSale H31
Maximum G24:I28
MaxT VSpots C31
MinimumAcceptable H16:H17
NumberOfAds C24:E28
RequiredAmount H20
SalesPerAd C4:E8
TotalAds C29:E29
TotalProfit H36
TotalReached F16:F17
TotalRedeemed F20
TotalSales H30
TVSpots C29
30
31
32
33
34
35
36
37
G H
Total Sales =SUMPRODUCT(SalesPerAd,NumberOfAds)
Gross Profit per Sale0.75
Gross Profit= GrossProfitPerSale*TotalSales
Cost of Ads= F12/1000
Planning Cost =F 13/1000
Total Profit = H33-H34-H35
($million)
f) In part d, 4.075 TV ads, 3.596 magazine ads, and 11.218 ads in Sunday supplements
8-39
21
1
2
3
4
5
6
7
8
9
10
11
12
13
14
15
16
17
18
19
20
A B C D E F G H I J
BB LO P I LI HEAL Q UI AUA
Expected Retu rn 20% 42% 100% 50% 46% 30%
Covariance Matrix
(Variance on Diagonal) BB LO P I LI HEAL Q UI AUA
BB 0.032 0.005 0.030 –0.031 -0.027 0.010
LO P 0.005 0. 1 0.085 -0.07 -0.05 0.020
ILI 0.030 0.085 0.333 -0.11 -0.02 0.042
HEAL -0.031 -0.07 -0.11 0.125 0.05 -0.060
QUI -0.027 -0.05 -0.02 0.05 0.065 -0.020
AUA 0.010 0.020 0.042 –0.060 –0.020 0.08
BB LO P I LI HEAL Q UI AUA Total
Portfo lio 0% 0% 40% 40% 20% 0% 100% = 100%
<= <= <= <= <= <=
Max in Single Stock 40% 40% 40% 40% 40% 40%
Portfo lio
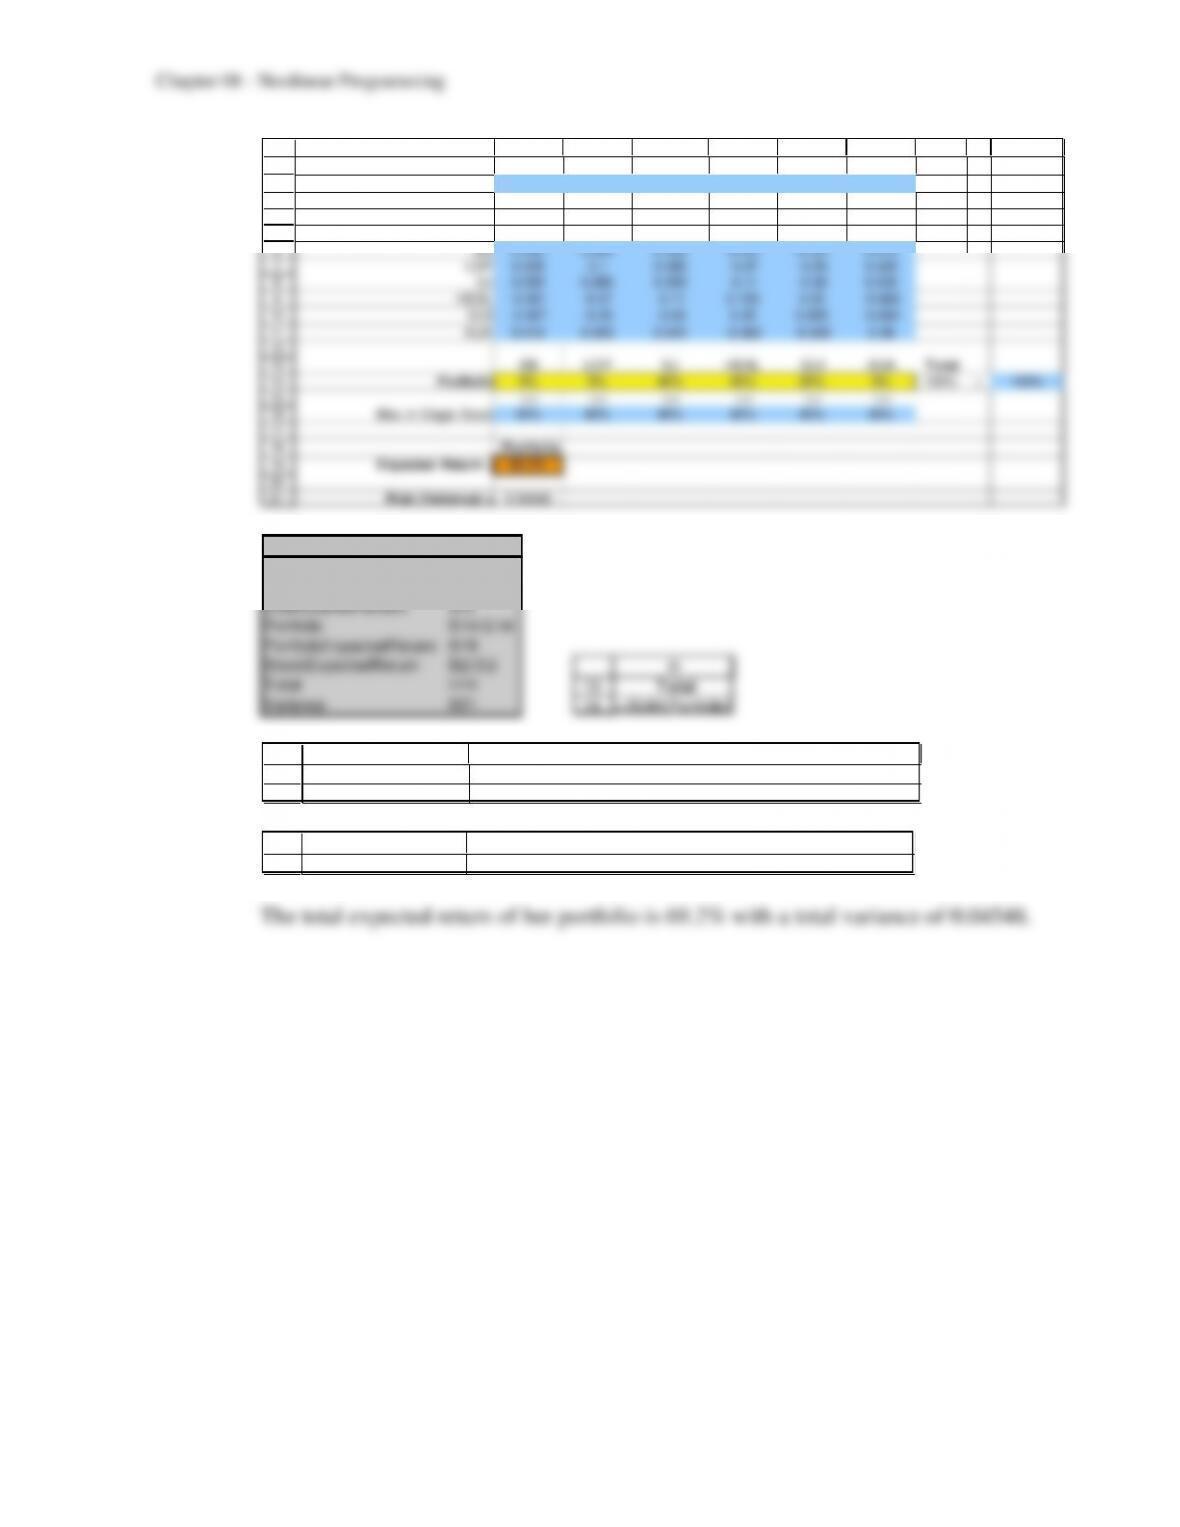
Expected Retu rn = 69.2%
Range Name Cells
CovarianceMatrix B6:G 11
MaxInSingleStock B16:G16
OneHundredPercent J14
Portfolio B14:G 14
PortfolioExpectedReturn B19
StockExpectedReturn B2:G2
Total H14
Variance B21
13
14
H
To tal
= SUM(Portfolio)
18
19
A B
Portfo lio
Expected Return == SUMPRO DUCT(St ockExpectedReturn,Port folio)
21
A B
Risk (Variance) = =SUMPRODUCT(MMULT(Portfolio,CovarianceMatrix),Portfolio
8-40
1
2
3
4
5
6
7
8
9
10
11
12
13
14
15
16
17
18
19
20
21
22
23
A B C D E F G H I J
BB LO P I LI HEAL Q UI AUA
Expected Retu rn 20% 42% 100% 50% 46% 30%
Covariance Matrix
(Variance on Diagonal) BB LO P I LI HEAL Q UI AUA
BB 0.032 0.005 0.030 -0.031 -0.027 0.010
LO P 0.005 0. 1 0.085 -0.07 -0.05 0.020
ILI 0.030 0.085 0.333 -0.11 –0.02 0.042
HEAL -0.031 -0.07 -0.11 0.125 0.05 –0.060
QUI -0.027 -0.05 -0.02 0.05 0.065 -0.020
AUA 0.010 0.020 0.042 –0.060 –0.020 0.08
BB LO P I LI HEAL Q UI AUA To tal
Portfo lio 31.8% 19.9% 0.0% 16.8% 20.9% 10.6% 100% = 100%
<= <= <= <= <= <=
Max in Single Stock 40% 40% 40% 40% 40% 40%
Minimum
Expected
Portfolio Return
Expected Retu rn = 35.9% >= 35%
Risk (Variance) = 0.00136
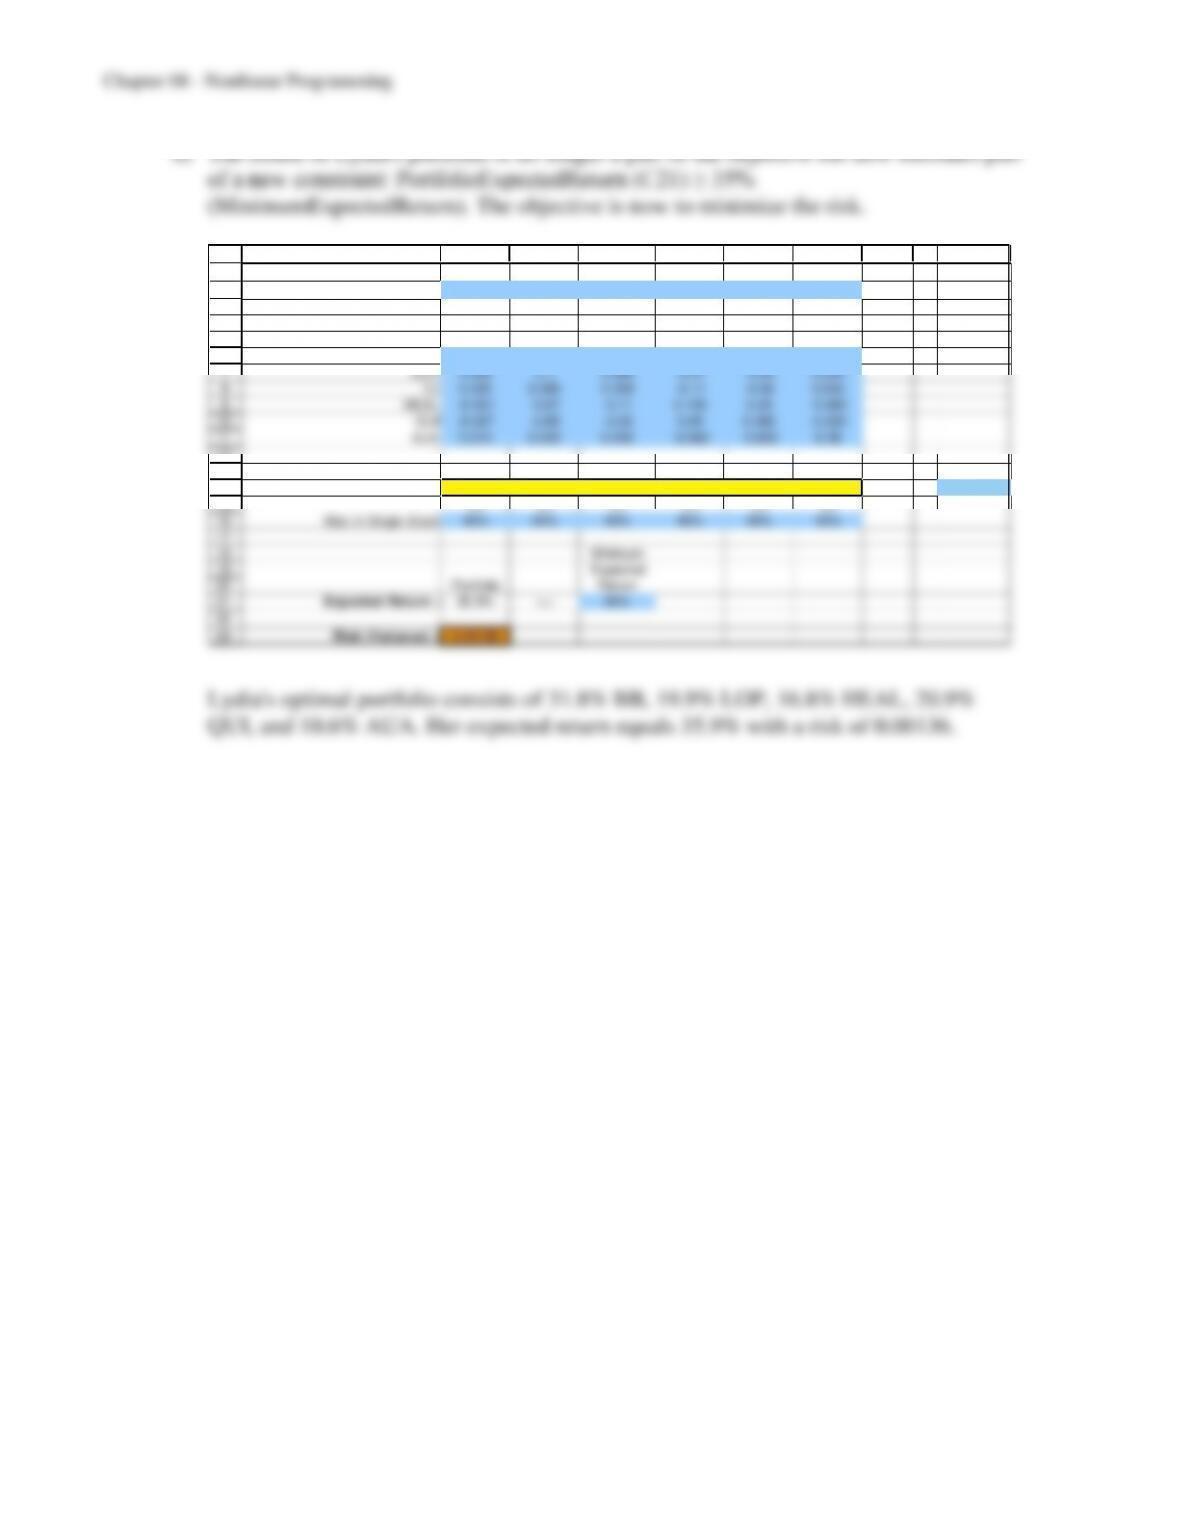
Lydia’s optimal portfolio consists of 31.8% BB, 19.9% LOP, 16.8% HEAL, 20.9%
QUI, and 10.6% AUA. Her expected return equals 35.9% with a risk of 0.00136.
8-42
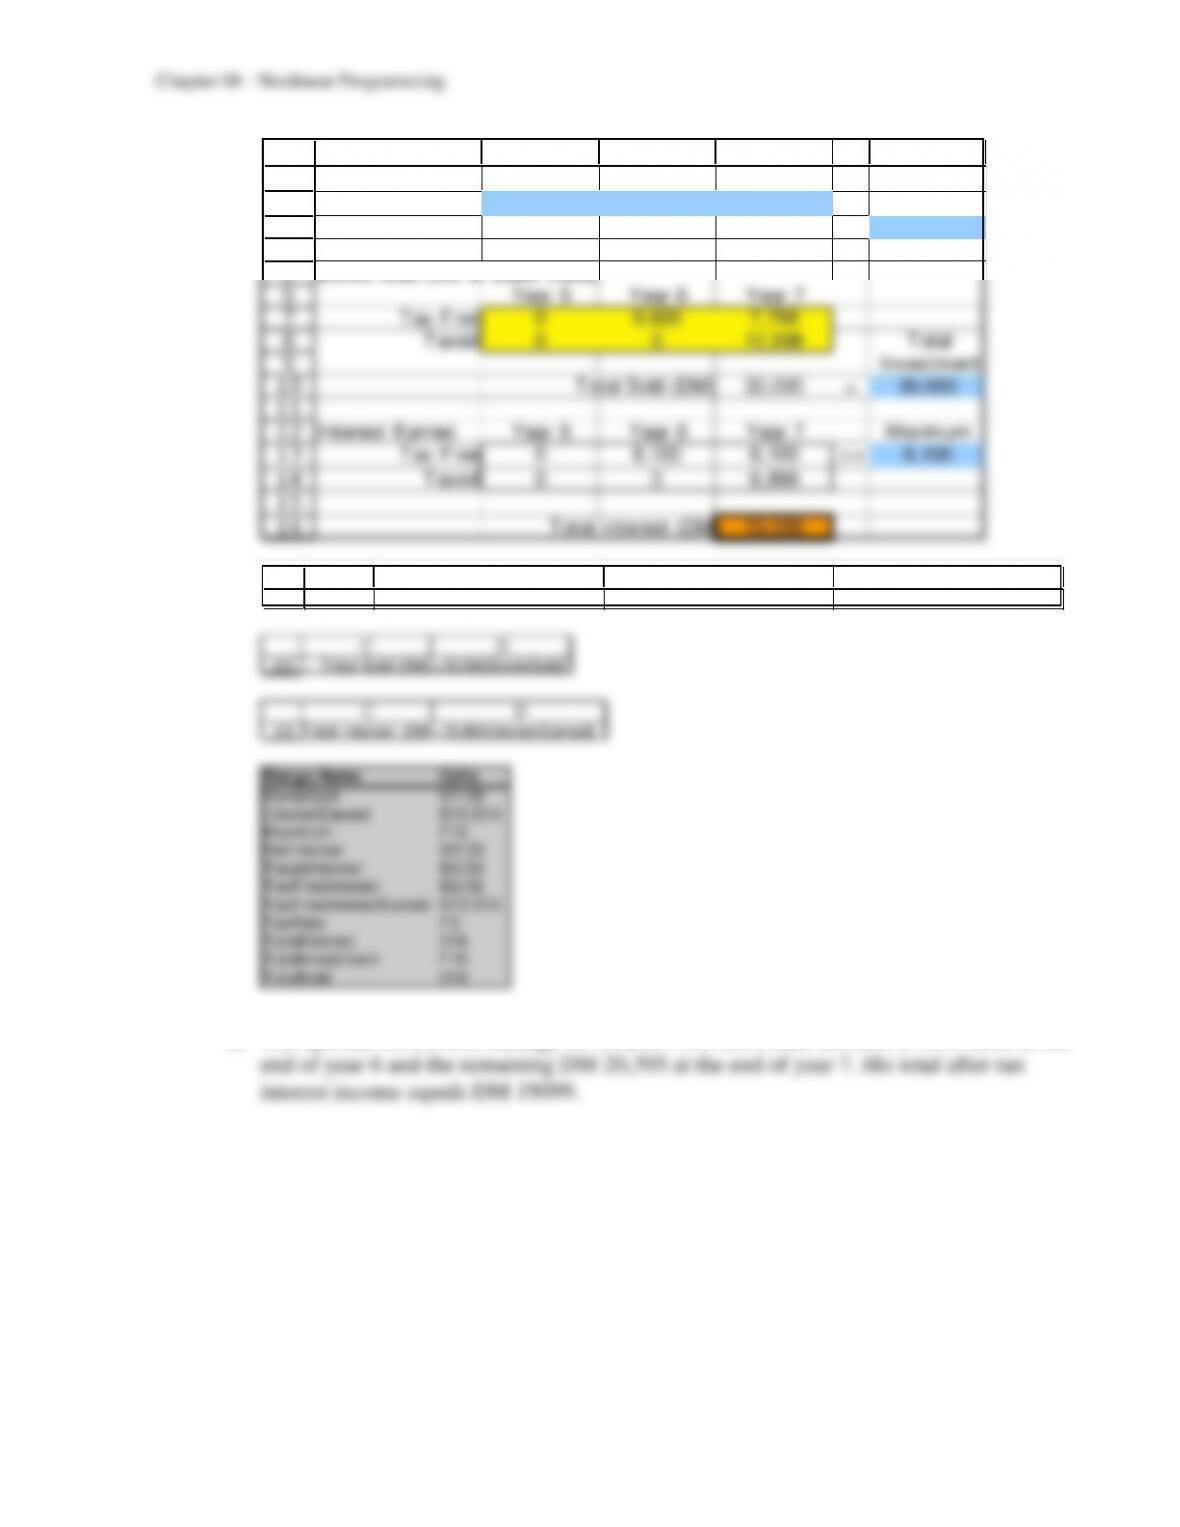
8-3 a) When Charles sells a portion of his B-Bonds in a given year, the first DM 6,100 of
interest are tax-free, but the interest earnings exceeding DM 6,100 are levied a 30
percent tax. Therefore, Charles encounters decreasing marginal returns, and we can use
separable programming to solve this problem.
Define the following variables:
Similarly, Year6TaxFree, Year6Taxed, Year7TaxFree, and Year7Taxed are defined.
8-43
1
2
3
4
5
6
7
8
9
10
11
12
13
14
15
16
A B C D E F
Net Interest Year 5 Year 6 Year 7
Tax F ree 0.5001 0.6351 0.7823 Tax Rate
Taxed 0.3501 0.4446 0.5476 30%
Bonds Sold (DM at Base Value)
Year 5 Year 6 Year 7
Tax F ree 0 9,605 7,798
Taxed 0 0 12,598 Total
Investment
Total Sold (DM) 30,000 = 30,000
Interest Earned Year 5 Year 6 Year 7 Maximum
Tax F ree 0 6,100 6,100 <= 6,100
Taxed 0 0 6,899
Total Interest (DM) 19,099
3
A B C D
Taxed =(1-TaxRate)*TaxFreeInterest =(1-TaxRate)*TaxFreeInterest =(1-TaxRate)*TaxFreeInterest
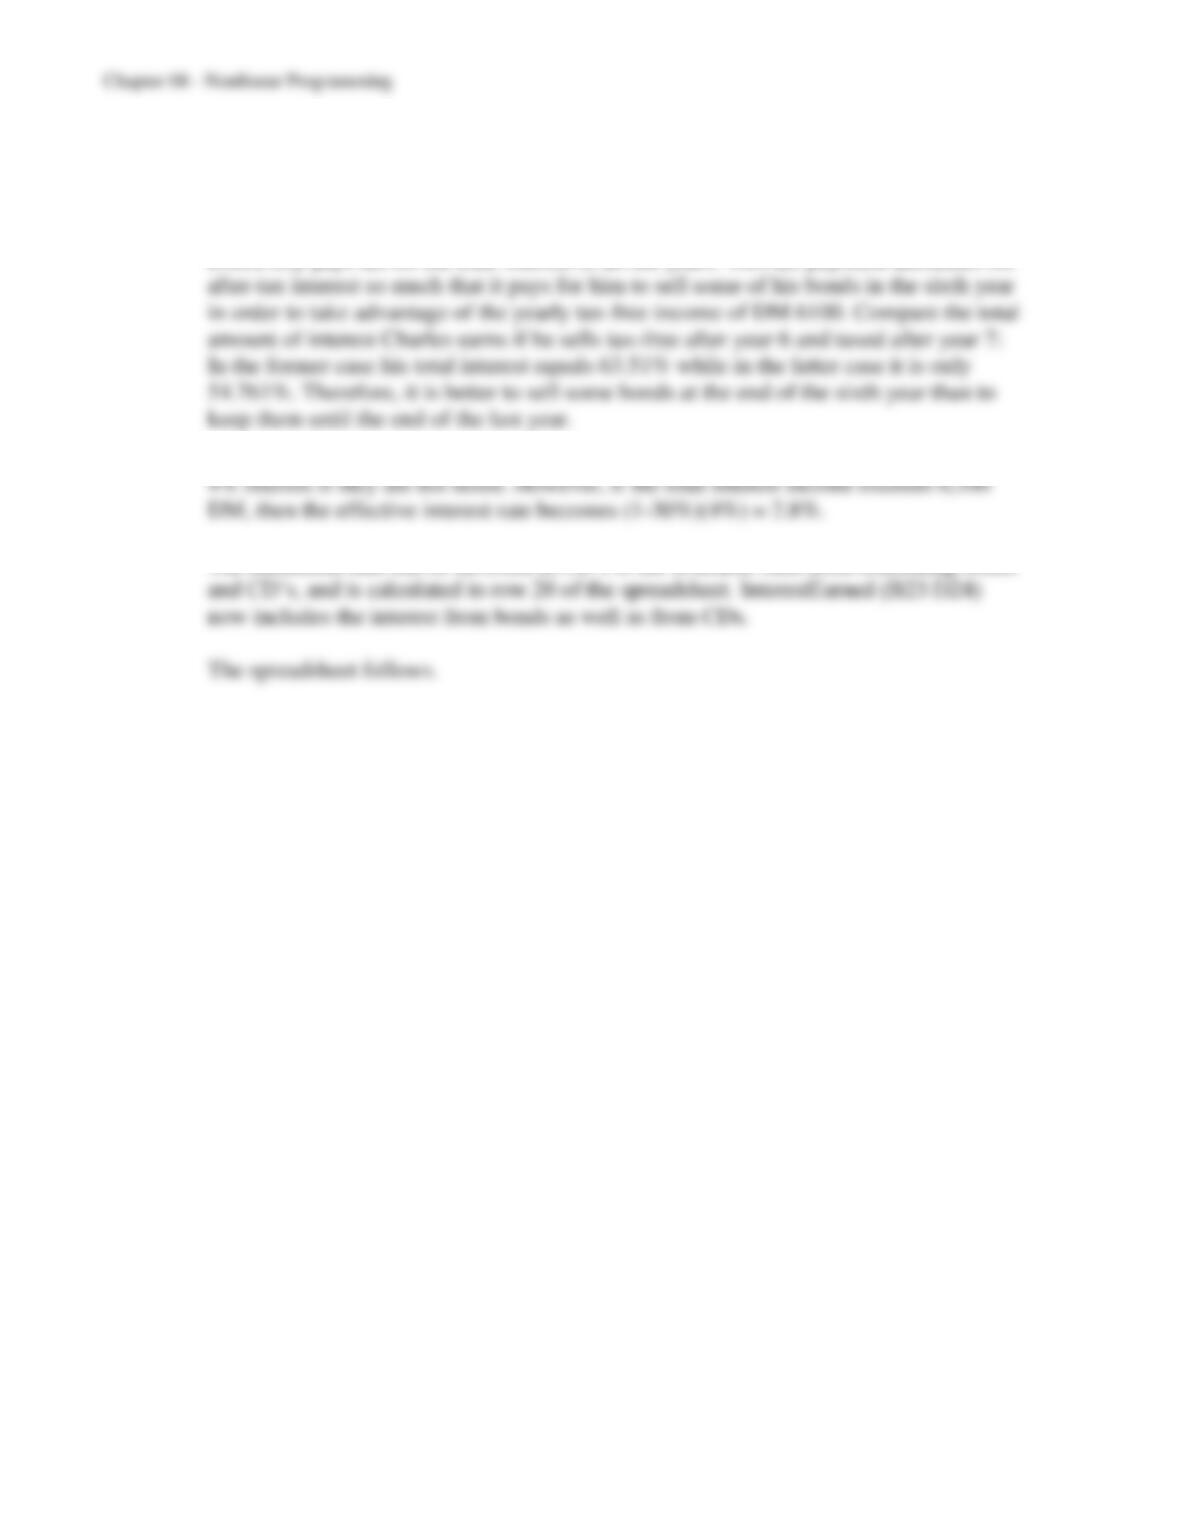
b) The optimal investment strategy for Charles is to sell a base amount of DM 9,605 at the
8-44
c) When Charles sells all B-Bonds in the seventh year, then he must pay 30% of taxes on
the amount of interest income exceeding DM 6100. This amount is earned interest not
only from the last year, but it includes interest from all the previous years. So Charles
does not pay 30% tax on the 9 percent interest he earned in the last year, but he
effectively pays tax on the total interest of all the years. This tax payment decreases his
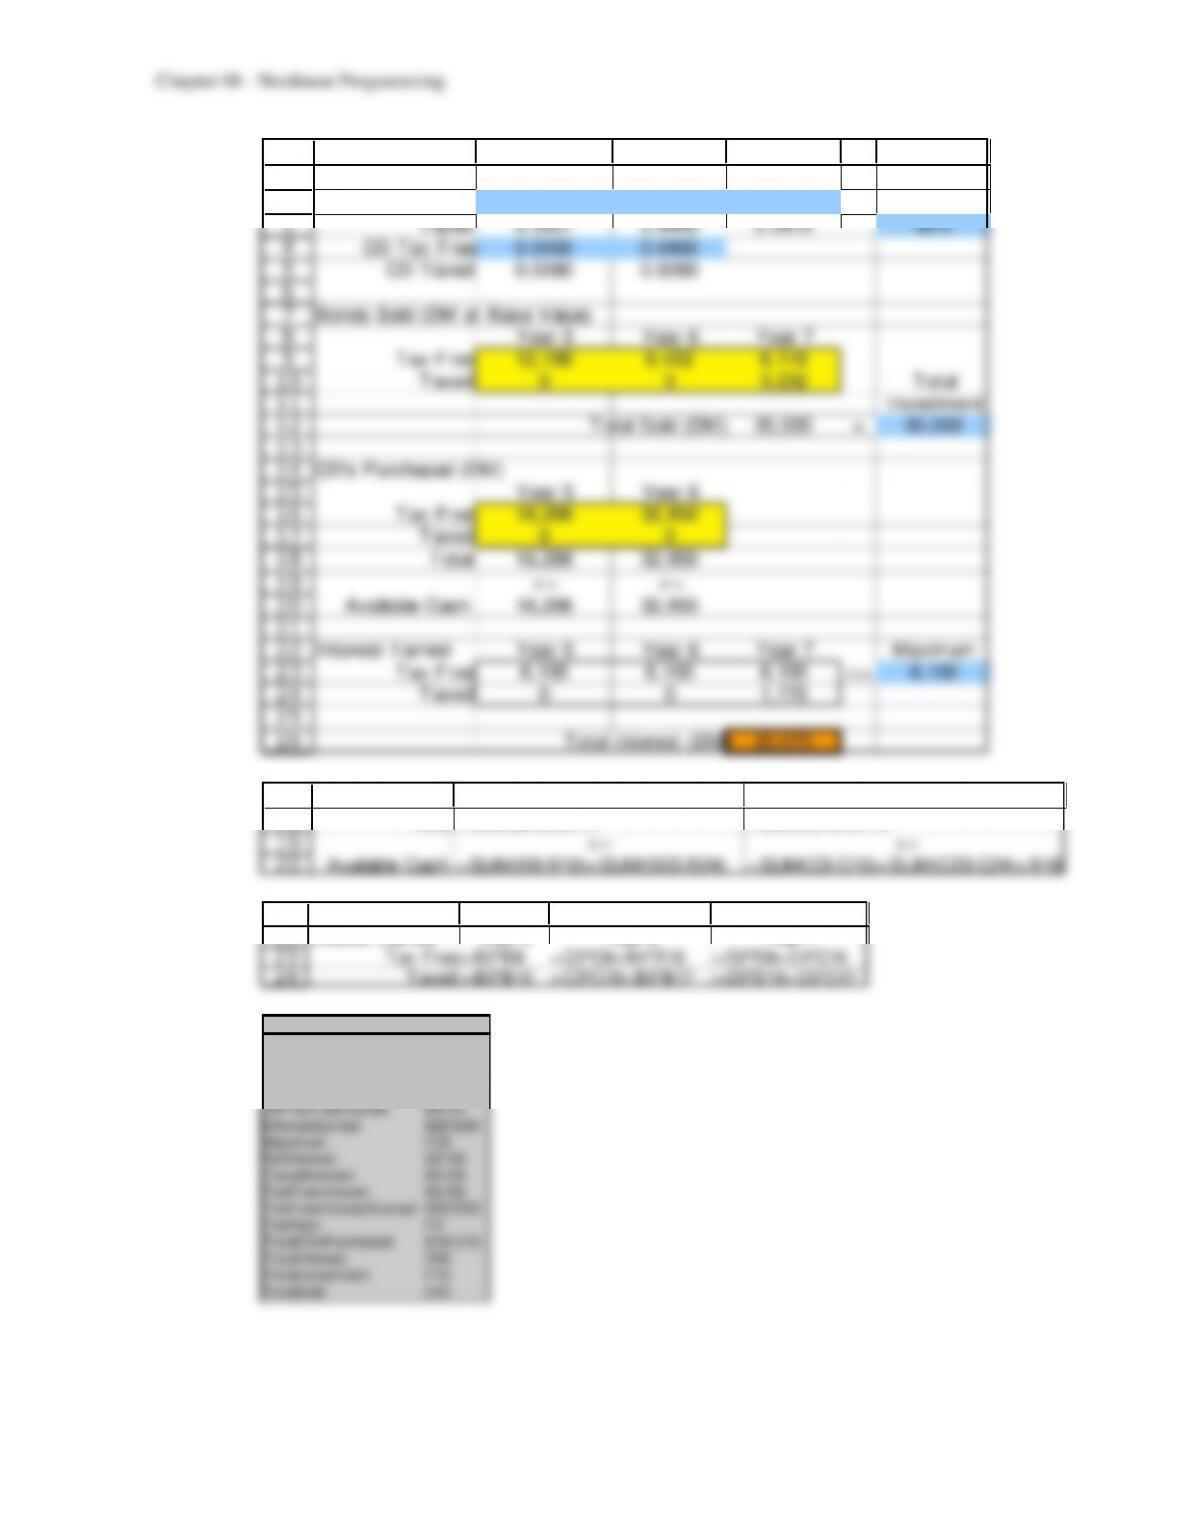
d) CD’s can be purchased in either year 5 or 6, and are redeemed one year later. They earn
The maximum that can be invested in CD’s is the available cash from redeeming bonds
8-45
1
2
3
4
5
6
7
8
9
10
11
12
13
14
15
16
17
18
19
20
21
22
23
24
25
26
A B C D E F
Net Interest Year 5 Year 6 Year 7
Tax Free 0.5001 0.6351 0.7823 Tax Rate
Taxed 0.3501 0.4446 0.5476 30%
CD Tax Free 0.0400 0.0400
CD Taxed 0.0280 0.0280
Bonds Sold (DM at Base Value)
Year 5 Year 6 Year 7
Tax Free 12,198 8,452 6,118
Taxed 0 0 3,232 Total
Investment
Total Sold (DM) 30,000 = 30,000
CD’s Purchased (DM)
Year 5 Year 6
Tax Free 18,298 32,850
Taxed 0 0
Total 18,298 32,850
<= <=
Available Cash 18,298 32,850
Interest Earned Year 5 Year 6 Year 7 Maximum
Tax Free 6,100 6,100 6,100 <= 6,100
Taxed 0 0 1,770
Total Interest (DM) 20,070
18
19
20
A B C
Total =SUM(B16:B17) =SUM(C16:C17)
<= <=
Available Cash =SUM(B9:B10)+SUM(B23:B24) =SUM(C9:C10)+SUM(C23:C24)+B18
22
23
24
A B C D
Interest Earned Year 5 Year 6 Year 7
Tax Free=B2*B9 =C2*C9+ B4*B16 =D2*D9+C4*C16
Taxed =B3*B10 =C3*C10+B5*B17 = D3*D10+C5*C17
Range Name Cells
AvailableCash B20:C20
BondsSold B9:D10
CDsPurchased B16:C17
CDTaxedInterest B5:C5
CDTaxFreeInterest B4:C4
InterestEarned B23:D24
Maximum F23
NetInterest B2:D3
TaxedInterest B3:D3
TaxFreeInterest B2:D2
TaxFreeInterestEarned B23:D23
TaxRate F3
TotalCDsPurchased B18:C18
TotalInterest D26
TotalInvestment F12
TotalSold D12
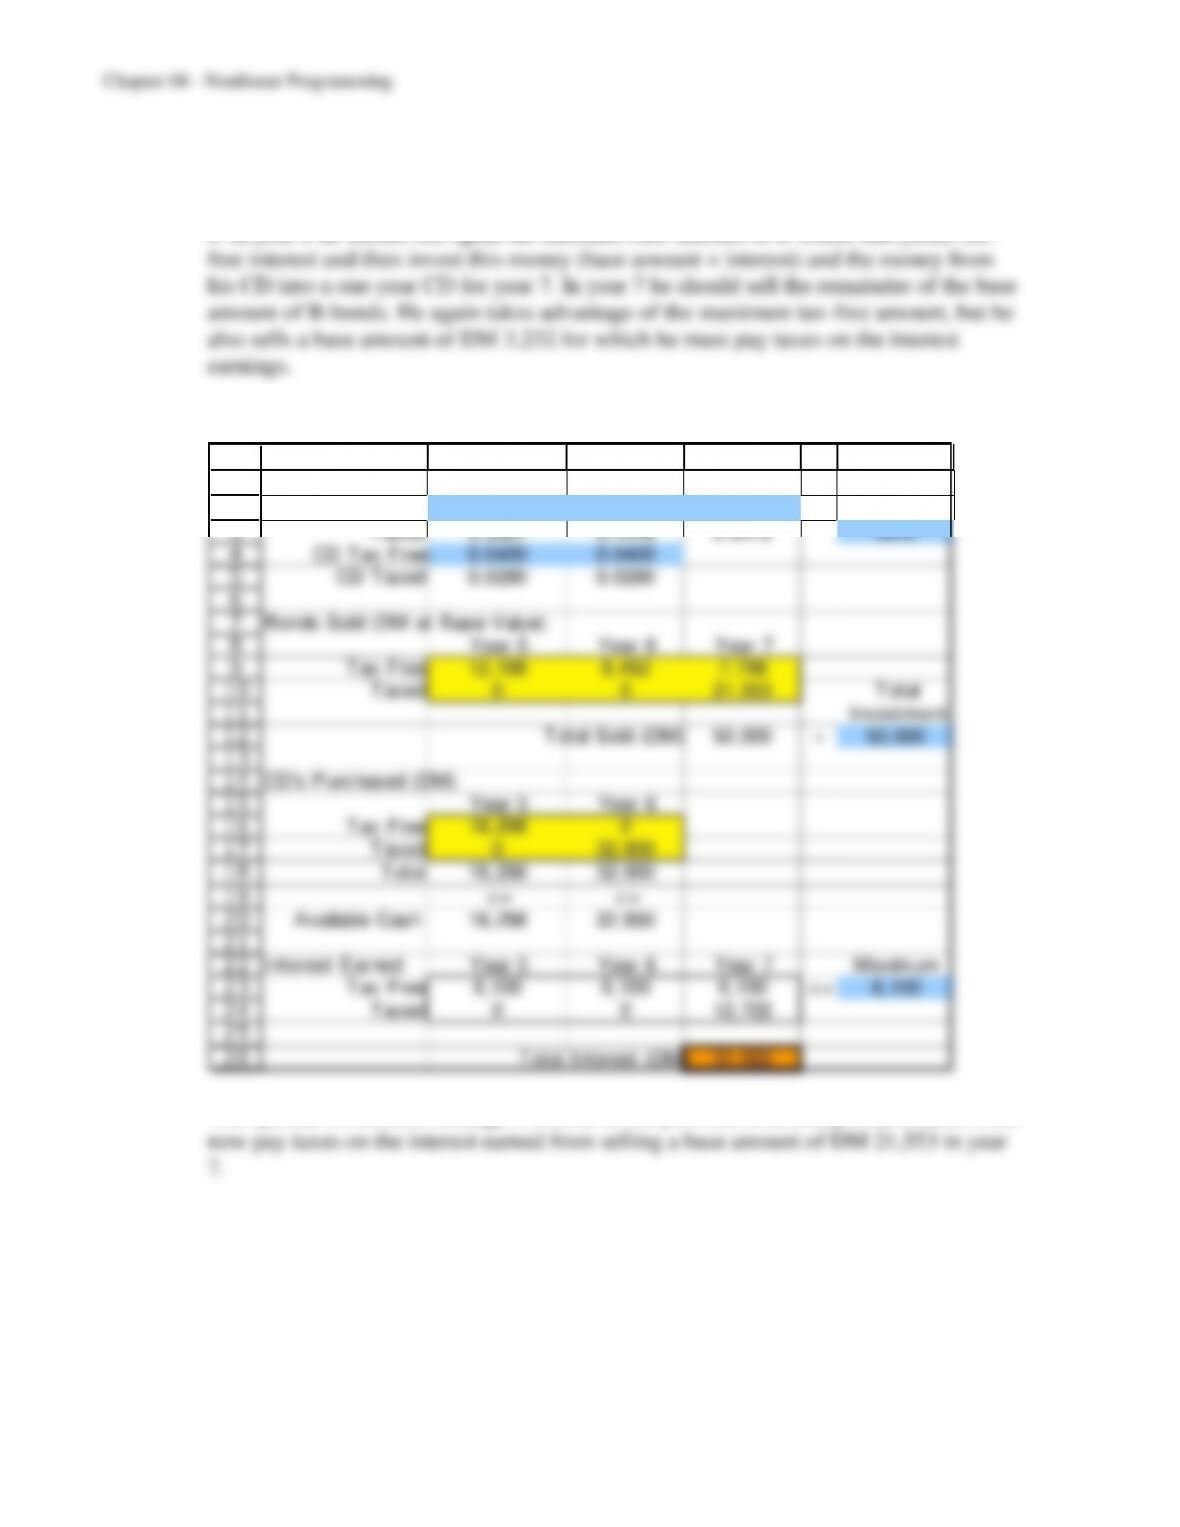
8-46
Charles should sell the maximal base amount of B-bonds in year 5 that yields tax-free
interest and then invest this money (base amount + interest) into a one-year CD for year
6. In year 6 he should sell again the maximal base amount of B-bonds that yields tax-
e) The TotalInvestment (F12) is changed to $50,000.
1
2
3
4
5
6
7
8
9
10
11
12
13
14
15
16
17
18
19
20
21
22
23
24
25
26
A B C D E F
Net Interest Year 5 Year 6 Year 7
Tax Free 0.5001 0.6351 0.7823 Tax Rate
Taxed 0.3501 0.4446 0.5476 30%
CD Tax Free 0.0400 0.0400
CD Taxed 0.0280 0.0280
Bonds Sold (DM at Base Value)
Year 5 Year 6 Year 7
Tax Free 12,198 8,452 7,798
Taxed 0 0 21,553 Total
Investment
Total Sold (DM) 50,000 = 50,000
CD’s Purchased (DM)
Year 5 Year 6
Tax Free 18,298 0
Taxed 0 32,850
Total 18,298 32,850
<= <=
Available Cash 18,298 32,850
Interest Earned Year 5 Year 6 Year 7 Maximum
Tax Free 6,100 6,100 6,100 <= 6,100
Taxed 0 0 12,722
Total Interest (DM) 31,022
The optimal investment strategy is similar to the previous one, except that Charles must