CD17-1
CD Chapter 17 Goal Programming
Review Questions
17.1-1 The management science team has been asked to analyze what the new product mix should
be for the three new products.
17.1-2 1. Achieve a total profit of at least $125 million.
17.1-3 When using a goal programming approach, the total number of penalty points incurred by
missing goals is to be minimized.
17.2-1 Goal programming does not possess the characteristic of a single objective function.
17.2-2 The basic approach of goal programming is to establish a specific numeric goal for each of
17.2-3 The objective function represents the weighted sum of deviations of the individual
objective functions from their respective goals.
17.2-4 The changing cells show the amounts over or under the respective goals.
17.2-5 A goal programming model can be formulated as a linear programming model.
17.3-2 Preemptive goal programming beings by focusing solely on meeting the most important
goal, then doing the same for the second goal, and so on.
17.3-4 A constraint is added that the deviation achieved on the more important goals must
continue to be met while switching to minimizing the less important goals.
Problems
17.1 The coefficient for L7 is three times as large as the coefficient for K7.
CD17-2
b)
1
2
3
4
5
6
7
8
9
10
A B C D E F G H I J K L M N
Market Share per $million
Ad Ad Ad Level Amount Amount Balance
Camp. 1 Camp. 2 Camp. 3 Achieved Goal Over Under (Level-Over+Under) Goal
Goal 1 (M. Share of Prod. 1) 0.5% 0.2% 15.0% >= 15% 0.0% 0.0% 15% = 15%
Goal 2 (M. Share of Prod. 2) 0.3% 0.2% 8.33% >= 10% 0.0% 1.67% 10% = 10%
Ad Ad Ad
Camp. 1 Camp. 2 Camp. 3 Total Penalty Over Under Weighted Sum
Millions of Dollars Spent 13.33 0 41.67 55 Weights Goal Goal of Deviations
>= <= Goal 1 1 1.67%
Deviations
Constraints
Goals
c) Both goals of market share cannot be met with an advertising budget of $55 million.
With this budget, spending $13.33 million on campaign 1 and $41.67 million on
17.3 a)
1
2
3
4
5
6
7
8
9
10
11
12
13
A B C D E F G H I J K L M N
Unit Contribution of Product
Product Product Product Level Amount Amount Balance
1 2 3 Achieved Goal Over Under (Level–Over+Under) Goal
Goal 1 (Total Profit) 20 15 25 375 Max
Goal 2 (Employment Level) 6 4 5 75 =50 25 0 50.000 = 50
Goal 3 (Earnings Next Year) 8 7 5 75 >= 75 0 0 75.000 = 75
Product Product Product
1 2 3 Over Under Measure of
Production Rate 0 0 15 Benefit Goal Goal Performance
Goal 1 225
Goal 2 -6 -6
Goal 3 -3
Deviations
Constraints
Goals
Level Achieved
Measure of Performance = E4 + SUMPRODUCT(I12:J13, I5:J6)
b) Emax should produce 15 units of product 3. While this does increase the present level
of employment by 25, it does maximize profit over the life of the new products and it
does not decrease next year’s earnings from the current level.
17.4 a) No, we would not expect the optimal solution to change. Goal 1 is already met, so
increasing the weight on that goal would not change anything. We already exceed goal
2, so decreasing the penalty weight for goal 2 would only decrease our desire to avoid
exceeding this goal.
b)
3
4
5
6
7
8
9
10
11
12
13
14
B C D E F G H I J K L M N O
Goals
Contribution per Unit Produced Level Amount Amount Balance
Product 1 Product 2 Product 3 Achieved Goal Over Under (Level – Over + Under) Goal
Goal 1 (Profit) 12 915 140 >= 140 0 0 140 = 140
Goal 2 (Employment) 5 3 4 58.333 = 40 18.333 0 40 =40
Goal 3 (Investment) 5 7 8 58.333 <= 55 3.333 0 55 =55
Product 1 Product 2 Product 3 Penalty Over Under Weighted Sum
Units Produced 11.667 0 0 Weights Goal Goal of Deviations
Profit 5 46.667
Employment 2 4
Deviations
Constraints
CD17-3
c)
3
4
5
6
7
8
9
10
11
12
13
14
B C D E F G H I J K L M N O
Goals
Contribution per Unit Produced Level Amount Amount Balance
Product 1 Product 2 Product 3 Achieved Goal Over Under (Level – Over + Under) Goal
Goal 1 (Profit) 12 915 140 >= 140 0 0 140 = 140
Goal 2 (Employment) 5 3 4 58.333 = 40 18.333 0 40 =40
Goal 3 (Investment) 5 7 8 58.333 <= 55 3.333 0 55 =55
Product 1 Product 2 Product 3 Penalty Over Under Weighted Sum
Units Produced 11.667 0 0 Weights Goal Goal of Deviations
Profit 7 28.333
Employment 1 4
Deviations
Constraints
Overall objective is to Minimize W = (amount under Goal 1)/100 + amount under Goal
2 + amount under Goal 3 + amount over Goal 3.
b)
1
2
3
4
5
6
7
8
9
10
11
12
A B C D E F G H I J K L M N
Contribution per 1000 Acres Level Amount Amount Balance
Crop 1 Crop 2 Crop 3 Achieved Goal O ver Under (Level-O ver+Under) Goal
Goal 1 (Foreign Capital) $3,000 $5,000 $4,000 $58,333,333 >= $70,000,000 $0 $11,666,667 $70,000,000 = $70,000,000
Goal 2 (Citizens Fed) 150 75 100 1,750,000 >= 1,750,000 0 0 1,750,000 = 1,750,000
Goal 3 (Citizens Employed) 10 15 12 183,333 = 200,000 0 16,667 200,000 = 200,000
Crop 1 Crop 2 Crop 3 Total Penalty Over Under Weighted Sum
Thousands of Acres Planted 8,333 6,667 0 15,000 Weights Goal Goal of Deviations
<= Goal 1 0.01 133,333
15,000 Goal 2 1
Deviations
Constraints
Goals
17.6 Start by minimizing the amount under goal 1 (citizens employed ≥ 200,000).
1
2
3
4
5
6
7
8
9
10
A B C D E F G H I J K L M N
Contribution per 1000 Acres Level Amount Amount Balance
Crop 1 Crop 2 Crop 3 Achieved Goal Over Under (Level-Over+Under) G oal
Goal 1 (Citizens Employed) 10 15 12 210,000 >= 200,000 10,000 0 200,000 = 200,000
Goal 2 (Foreign Capital) $3,000 $5,000 $4,000 $70,000,000 >= $70,000,000 $0 $0 $70,000,000 = $70,000,000
Goal 3 (Citizens Fed) 150 75 100 1,050,000 >= 1,750,000 0 700,000 1,750,000 = 1,750,000
Goal 4 (Citizens Employed) 10 15 12 210,000 <= 200,000 10,000 0 200,000 = 200,000
Minimize Under Goal 1
Crop 1 Crop 2 Crop 3 Total
Deviations
Constraints
Goals
Finally, minimum amount over goal 4 while constraining (Amount Under Goal 1 = 0),
CD17-5
Finally, we minimize amount over goal 3 while constraining (Amount Over Goal 1 = 0)
and (Amount Under Goal 2 = 0).
1
2
3
4
5
6
7
8
9
10
11
12
13
14
15
16
17
18
A B C D E F G H I J K L M N O P
Level Amount Amount Balance
Property Sales
Entertainment
Utility Achieved Goal Over Under (Level-Over+Under) Goal
Goal 1 (Low Income Tax) 600 400 50 100 1,933 <= 2,000 0 67 2,000 = 2,000
Goal 2 (Property Tax) 1 0 0 0 1 >= 1 0 0 1 = 1
Goal 3 (Potential Movers) 760 250 78 76 1,611 <= 1,500 111 0 1,500 = 1,500
Potential Minimize Over Goal 3
Movers Property Sales
Entertainment
Utility Level Limit (Amount Over Goal 1 = 0)
LI Tax Burden 20% 600 400 50 100 1,933 (Amount Under Goal 2 = 0)
MI Tax Burden 20% 800 350 100 120 2,010 <= 2,500
HI Tax Burden 40% 1,200 250 120 80 2,057 <= 2,300
Total 6,000 >= 6,000
1
<=
Tax Rate (Percent) 1 3 0 1.33
<=
3
$thousands per 1% Tax
Deviations
Constraints
Goals
$thousands per 1% Tax
b)
1
2
3
4
5
6
7
8
9
10
11
12
13
14
15
16
17
18
A B C D E F G H I J K L M N O P
Level Amount Amount Balance
Property Sales
Entertainment
Utility Achieved Goal Over Under (Level-Over+ Under) Goal
Goal 1 (Low Income Tax) 600 400 50 100 2,000 <= 2,000 0 0 2,000 = 2,000
Goal 2 (Property Tax) 1 0 0 0 0.75 >= 1 0 0.25 1 = 1
Goal 3 (Potential Movers) 760 250 78 76 1,586 <= 1,500 86 0 1,500 = 1,500
Potential Penalty Amount Amount Weighted Sum
Movers Property Sales
Entertainment
Utility Level Limit Weights Over Under of Deviations
LI Tax Burden 20% 600 400 50 100 2,000 Goal 1 1 0 109
MI Tax Burden 20% 800 350 100 120 2,070 <= 2,500 Goal 2 0 90
HI Tax Burden 40% 1,200 250 120 80 1,930 <= 2,300 Goal 3 1 0
Total 6,000 >= 6,000
1
<=
Tax Rate (Percent) 0.75 3 0 3.5
<=
3
$thousands per 1% Tax
Deviations
Constraints
Goals
$thousands per 1% Tax
17.8 Start by minimizing the amount under goal 1 (market share for product 1 ≥ 15%).
1
2
3
4
5
6
7
8
9
10
A B C D E F G H I J K L M N
Market Share per $million
Ad Ad Ad Level Amount Amount Balance
Camp. 1 Camp. 2 Camp. 3 Achieved Goal Over Under (Level–Over+ Under) Goal
Goal 1 (M. Share of Prod. 1) 0.5% 0.2% 15.0% >= 15% 0.0% 0.0% 15% = 15%
Goal 2 (M. Share of Prod. 2) 0.3% 0.2% 2.00% >= 10% 0.0% 8.00% 10% = 10%
Ad Ad Ad Minimize Under Goal 1
Camp. 1 Camp. 2 Camp. 3 Total
Millions of Dollars Spent 26 010 36
>= <=
Deviations
Constraints
Goals
CD17-6
1
2
3
4
5
6
7
8
9
10
A B C D E F G H I J K L M N
Market Share per $million
Ad Ad Ad Level Amount Amount Balance
Camp. 1 Camp. 2 Camp. 3 Achieved Goal Over Under (Level–Over+ Under) Goal
Goal 1 (M. Share of Prod. 1) 0.5% 0.2% 15.0% >= 15% 0.0% 0.0% 15% = 15%
Goal 2 (M. Share of Prod. 2) 0.3% 0.2% 8.33% >= 10% 0.0% 1.67% 10% = 10%
Ad Ad Ad Minimize Under Goal 2
Camp. 1 Camp. 2 Camp. 3 Total (Under Goal 1 = 0%)
Millions of Dollars Spent 13.33333 0 41.66667 55
>= <=
Deviations
Constraints
Goals
17.9 Since the first priority goal is to keep the employment level at 4,000, we minimize the sum
of the amount over and the amount under this goal.
3
4
5
6
7
8
9
10
11
B C D E F G H I J K L M N O
Goals
Contribution per Unit Produced Level Amount Amount Balance
Product 1 Product 2 Product 3 Achieved Goal Over Under (Level – Over + Under) Goal
Goal 1 (Employment) 5 3 4 40 =40 0 0 40 =40
Goal 2 (Investment) 5 7 8 61.481 <= 55 6.481 0 55 =55
Goal 3 (Profit) 12 915 125 >= 125 0 0 125 = 125
Over + Under Goal 1 0
Product 1 Product 2 Product 3
Deviations
Constraints
Next we minimize the amount over goal 2 (investment ≤ $55 million) while constraining
the amount over and under goal 1 to equal 0.
3
4
5
6
7
8
9
10
11
B C D E F G H I J K L M N O
Goals
Contribution per Unit Produced Level Amount Amount Balance
Product 1 Product 2 Product 3 Achieved Goal Over Under (Level – Over + Under) Goal
Goal 1 (Employment) 5 3 4 40 =40 0 0 40 =40
Goal 2 (Investment) 5 7 8 55 <= 55 0 0 55 =55
Goal 3 (Profit) 12 915 116.25 >= 125 0 8.75 125 = 125
Minimize Over Goal 2
Product 1 Product 2 Product 3 (Over Goal 1 = 0)
Deviations
Constraints
3
4
5
6
7
8
9
10
11
12
B C D E F G H I J K L M N O
Goals
Contribution per Unit Produced Level Amount Amount Balance
Product 1 Product 2 Product 3 Achieved Goal Over Under (Level – Over + Under) Goal
Goal 1 (Employment) 5 3 4 40 =40 0 0 40 =40
Goal 2 (Investment) 5 7 8 55 <= 55 0 0 55 =55
Goal 3 (Profit) 12 915 116.25 >= 125 0 8.75 125 = 125
Minimize Under Goal 3
Product 1 Product 2 Product 3 (Over Goal 1 = 0)
Units Produced 5 0 3.75 (Under Goal 1 = 0)
Deviations
Constraints
CD17-7
17.10 Since the first priority goal is to include at least 240 students, we minimize the amount
under goal 1.
1
2
3
4
5
6
7
8
9
10
11
12
13
14
15
16
17
A B C D E F G H I J K L M
Fraction Total in Estimated Number Percent
GMAT Under 30 Over 30 Over 30 Admits Group That Enter of Admits
High Men 720 120 32 21.1% 152 <= 152 91.2 That Enter
High Women 720 28 4 12.5% 32 <= 32 19.2 60%
Medium Men 670 104 56 35.0% 128 <= 160 76.8
Medium Women 670 32 32 50.0% 64 <= 64 38.4
Low Men 620 40 40 50.0% 24 <= 80 14.4
Low Women 620 32 48 60.0% 0 <= 80 0
Level Amount Amount Balance
Achieved Goal Over Under (Level-Over+Under) Goal
Goal 1 (# of Students) 240 >= 240 0 0 240 = 240
Goal 2 (GMAT Score) 165600 >= 165600 690 times (# Students) 0 0 165,600 = 165,600
Goal 3 (W omen) 57.60 >= 60 25% times (# Students) 0 2.4 60.00 = 60.00
Goal 4 (At Least 30) 74.88 >= 96 0 21.12 96 =96
Deviations
Constraints
Goals
1
2
3
4
5
6
7
8
9
10
11
12
13
14
15
16
17
18
19
A B C D E F G H I J K L M
Fraction Total in Estimated Number Percent
GMAT Under 30 Over 30 Over 30 Admits Group That Enter of Admits
High Men 720 120 32 21.1% 136 <= 152 81.6 That Enter
High Women 720 28 4 12.5% 32 <= 32 19.2 60%
Medium Men 670 104 56 35.0% 160 <= 160 96
Medium Women 670 32 32 50.0% 64 <= 64 38.4
Low Men 620 40 40 50.0% 4 <= 80 2.4
Low W omen 620 32 48 60.0% 4 <= 80 2.4
Level Amount Amount Balance
Achieved Goal Over Under (Level-O ver+Under) Goal
Goal 1 (# of Students) 240 >= 240 0 0 240 = 240
Goal 2 (GMAT Score) 165600 >= 165600 690 times (# Students) 0 0 165600 = 165600
Goal 3 (Women) 60.00 >= 60 25% times (# Students) 0 0 60 =60
Goal 4 (At Least 30) 75.018947 >= 96 0 20.98105 96 =96
Minimize Under Goal 3
(Under G oal 1 = 0)
Deviations
Constraints
Goals
1
2
3
4
5
6
7
8
9
10
11
12
13
14
15
16
17
18
19
20
A B C D E F G H I J K L M
Fraction Total in Estimated Number Percent
GMAT Under 30 Over 30 Over 30 Admits Group That Enter of Admits
High Men 720 120 32 21.1% 152 <= 152 91.2 That Enter
High Women 720 28 4 12.5% 32 <= 32 19.2 60%
Medium Men 670 104 56 35.0% 160 <= 160 96
Medium Women 670 32 32 50.0% 64 <= 64 38.4
Low Men 620 40 40 50.0% 0 <= 80 0
Low W omen 620 32 48 60.0% 14.86 <= 80 8.914285714
Level Amount Amount Balance
Achieved Goal Over Under (Level-Over+ Under) Goal
Goal 1 (# of Students) 253.71429 >= 240 13.71 0 240 = 240
Goal 2 (GMAT Score) 175062.86 >= 175062.86 690 times (# Students) 0 0 175,063 = 175,063
Goal 3 (W omen) 66.51 >= 63.428571 25% times (# Students) 3.085714 0 63.43 = 63.43
Goal 4 (At Least 30) 79.748571 >= 96 0 16.25 96 =96
Minimize Under Goal 4
(Under Goal 1 = 0)
(Under Goal 2 = 0)
Deviations
Constraints
Goals
CD17-8
Cases
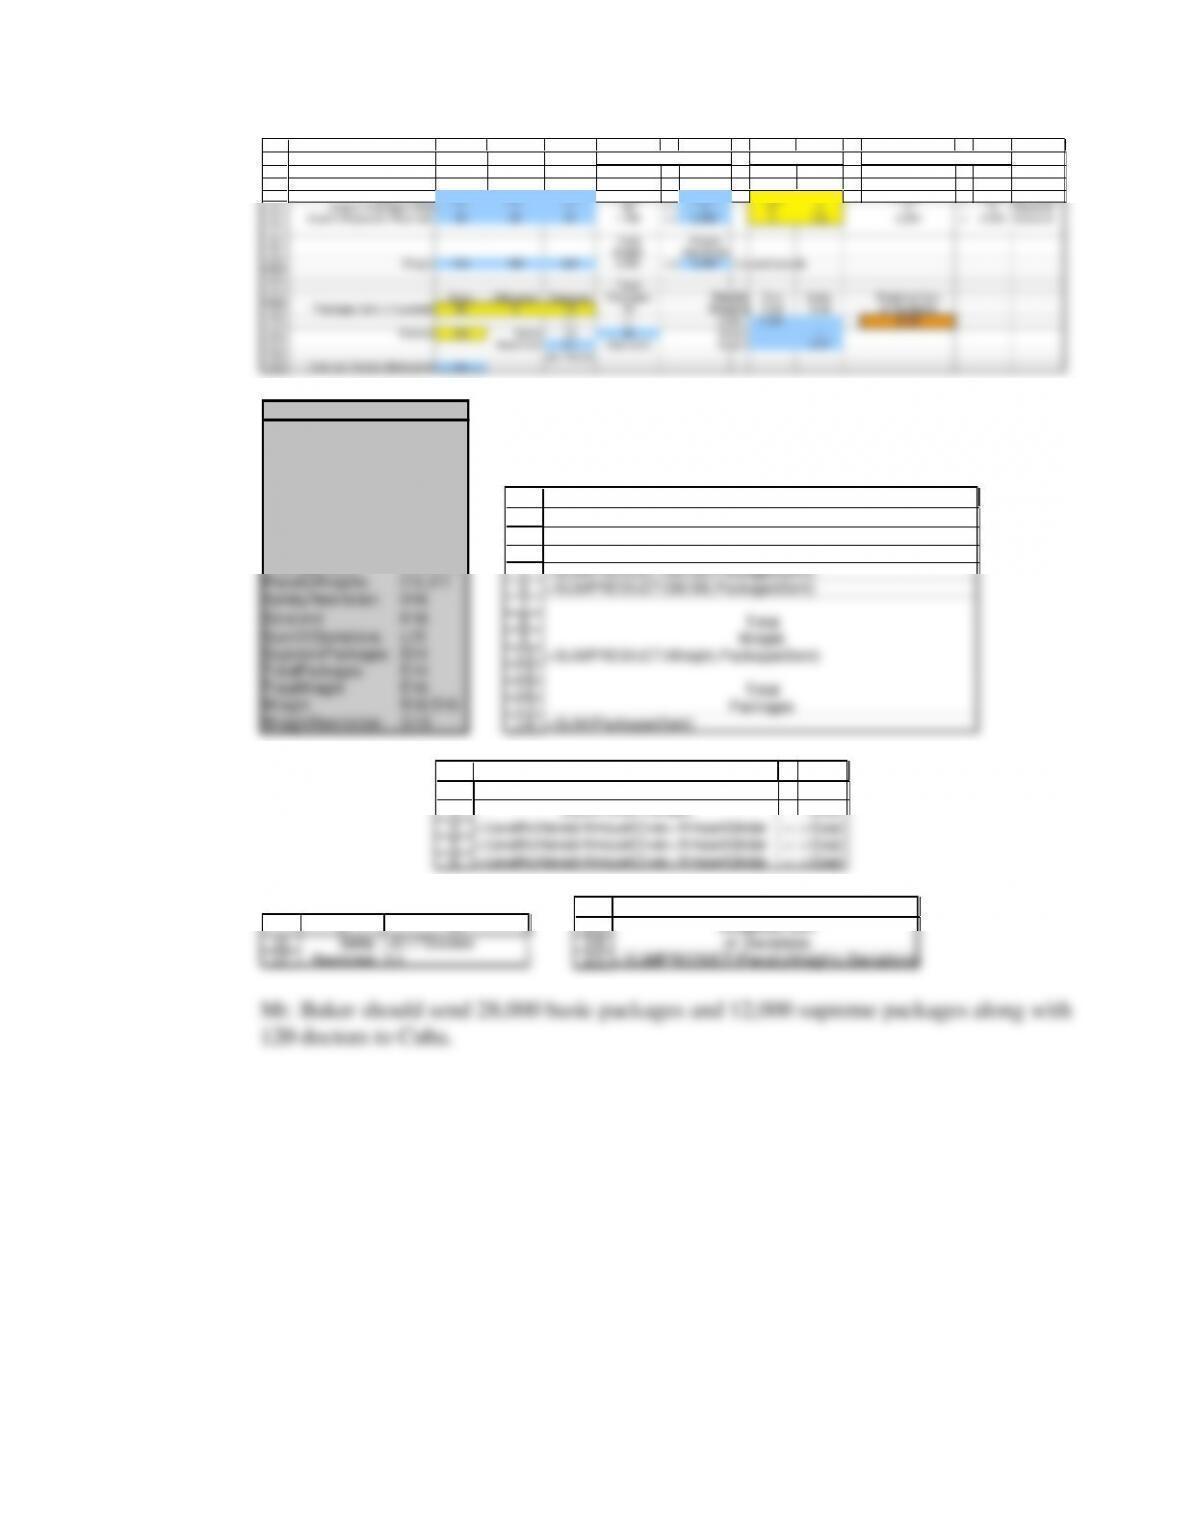
17.1 a) We need to develop a goal programming problem whose solution characterizes Mr.
Baker’s shipping policy. The decision variables are the number (in 1000’s) of basic,
Mr. Baker faces three hard constraints. Because of the size limitation, the total number
In addition, we need to include three constraints for Mr. Baker’s goals. We measure the
deviations from the goals using changing cells (Deviations in I4:J6), and enforce the
correct value of these changing cells with the constraints in columns L through N.
The spreadsheet follows.
CD Chapter 17 – Goal Programming
CD17-9
1
2
3
4
5
6
7
8
9
10
11
12
13
14
15
16
17
18
A B C D E F G H I J K L M N O
Level Amount Amount Balance
Basic Advanced Supreme Achieved Goal Over Under (Level-Over+ Under) Goal
Goal 1 (Cost) $300 $350 $720 21,000 <= 20,000 1,000 0 20,000 = 20,000 $thousand
Goal 2 (Packages Sent) 1 1 1 40 >= 337 0 3 = 3 thousand
Goal 3 (Population Reached) 30 35 54 1,488 >= 2,200 0 712 2,200 = 2,200 thousand
Total Weight
Weight Restriction
Weight 120 180 220 6,000 <= 6,000 thousand pounds
Total
Basic Advanced Supreme Packages Penalty Over Under Weighted Sum
Packages Sent (thousands) 28 012 40 W eights Goal Goal of Deviations
<= <= Goal 1 0.001 50.84
Doctors 120 Safety 12 40 Goal 2 1
Restriction 0.1 Size Limit Goal 3 0.07
per Doctor
Deviations
Constraints
Goals
Range Name Cells
AmountOver I4:I6
AmountUnder J4:J6
Balance L4:L6
CostPerDoctor B19
Deviations I4:J6
Doctors B16
Goal G4:G6
LevelAchieved E4:E6
PackagesSent B14:D14
PenaltyWeights I15:J17
SafetyRestriction D16
SizeLimit E16
SumOfDeviations L15
SupremePackages D14
TotalPackages E14
TotalW eight E10
Weight B10:D10
WeightRestriction G10
2
3
4
5
6
7
8
9
10
11
12
13
14
E
Level
Achieved
=SUMPRODUCT(B4:D4,PackagesSent)+Doctors*CostPerDoctor
=SUMPRODUCT(B5:D5,PackagesSent)
=SUMPRODUCT(B6:D6,PackagesSent)
Total
Weight
=SUMPRODUCT(Weight,PackagesSent)
Total
Packages
=SUM(PackagesSent)
2
3
4
5
L M N
Balance
(Level-Over+Under) Goal
=LevelAchieved–AmountOver+AmountUnder = =Goal
=LevelAchieved–AmountOver+AmountUnder = =Goal
16
17
C D
Safety =D17*Doctors
Restriction 0.1
13
14
15
L
Weighted Sum
of Deviations
=SUMPRODUCT(PenaltyWeights,Deviations)
Mr. Baker should send 28,000 basic packages and 12,000 supreme packages along with
120 doctors to Cuba.
CD17-10
1
2
3
4
5
6
7
8
9
10
11
12
13
14
15
16
17
18
A B C D E F G H I J K L M N O
Level Amount Amount Balance
Basic Advanced Supreme Achieved Goal Over Under (Level-Over+ Under) Goal
Goal 1 (Cost) $300 $350 $720 21,000 <= 20,000 1,000 0 20,000 = 20,000 $thousand
Goal 2 (Packages Sent) 1 1 1 40 >= 337 0 3 = 3 thousand
Goal 3 (Population Reached) 30 35 54 1,488 >= 2,200 0 712 2,200 = 2,200 thousand
Total Weight
Weight Restriction
Weight 120 180 220 6,000 <= 6,000 thousand pounds
Total
Basic Advanced Supreme Packages Penalty Over Under Weighted Sum
Packages Sent (thousands) 28 012 40 W eights Goal Goal of Deviations
<= <= Goal 1 0.001 130.45
Doctors 120 Safety 12 40 Goal 2 1
Restriction 0.1 Size Limit Goal 3 0.182
per Doctor
Deviations
Constraints
Goals
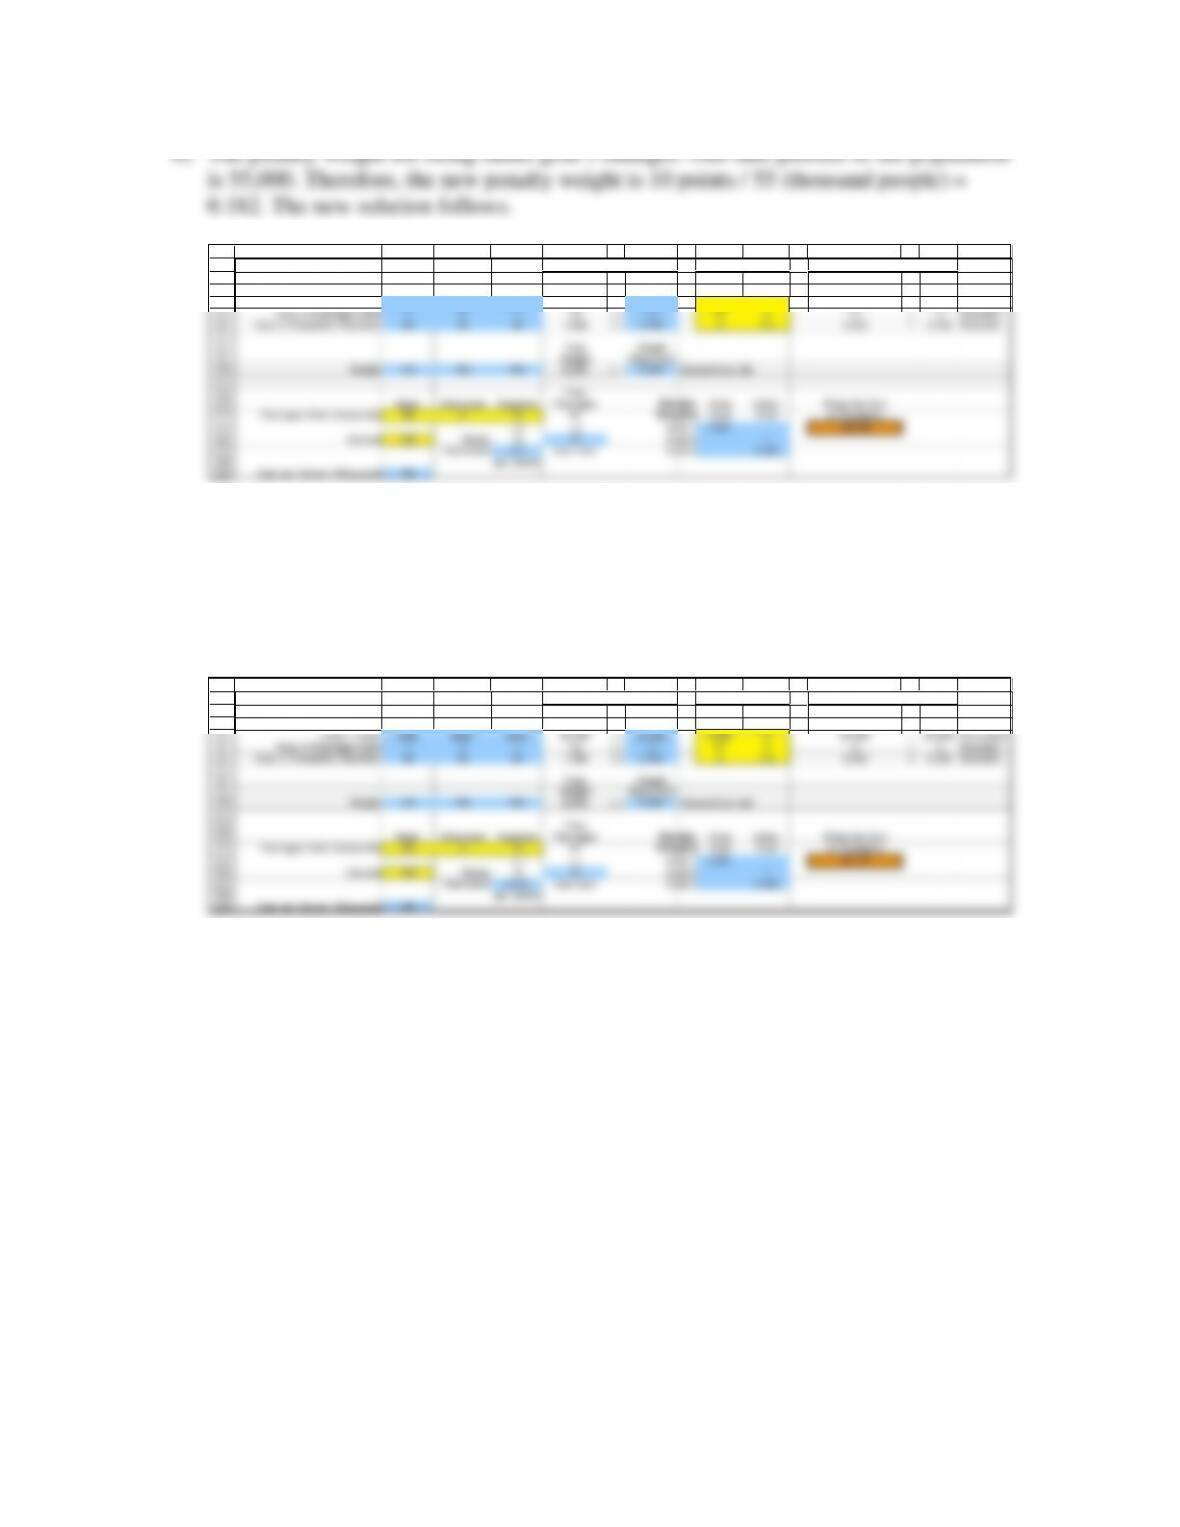
The optimal shipping policy did not change. The plan appears to be insensitive to
increases in the penalty weight for violating the goal to reach at least 20% of the Cuban
population.
c) The doctors needed per thousand supreme packages changes from 0.1 to 0.075. The
new solution follows.
1
2
3
4
5
6
7
8
9
10
11
12
13
14
15
16
17
18
A B C D E F G H I J K L M N O
Level Amount Amount Balance
Basic Advanced Supreme Achieved Goal Over Under (Level-Over+ Under) Goal
Goal 1 (Cost) $300 $350 $720 22,320 <= 20,000 2,320 0 20,000 = 20,000 $thousand
Goal 2 (Packages Sent) 1 1 1 40 >= 337 0 3 = 3 thousand
Goal 3 (Population Reached) 30 35 54 1,488 >= 2,200 0 712 2,200 = 2,200 thousand
Total Weight
Weight Restriction
Weight 120 180 220 6,000 <= 6,000 thousand pounds
Total
Basic Advanced Supreme Packages Penalty Over Under Weighted Sum
Packages Sent (thousands) 28 012 40 W eights Goal Goal of Deviations
<= <= Goal 1 0.001 131.77
Doctors 160 Safety 12 40 Goal 2 1
Restriction 0.075 Size Limit Goal 3 0.182
per Doctor
Deviations
Constraints
Goals
While the number of packages Mr. Baker should ship has not changed, the number of
doctors is now 160.
d) The budget restriction is now a hard constraint and the penalty variables for the cost goal can be
eliminated.
1
2
3
4
5
6
7
8
9
10
11
12
13
14
15
16
17
18
A B C D E F G H I J K L M N O
Level Amount Amount Balance
Basic Advanced Supreme Achieved Goal Over Under (Level-Over+Under) Goal
Cost (Hard Constraint) $300 $350 $720 20,000 <= 20,000 $thousand
Goal 2 (Packages Sent) 1 1 1 40 >= 337 0 3 = 3 thousand
Goal 3 (Population Reached) 30 35 54 1,465 >= 2,200 0 735.5 2,200 = 2,200 thousand
Total Weight
Weight Restriction
Weight 120 180 220 6,000 <= 6,000 thousand pounds
Total
Basic Advanced Supreme Packages
Packages Sent (thousands) 27 2.5 10.5 40 Penalty Over Under Weighted Sum
<= <= Weights Goal Goal of Deviations
Doctors 105 Safety 10.5 40 Goal 2 1 51.49
Restriction 0.1 Size Limit Goal 3 0.07
per Doctor
Deviations
Constraints
Goals
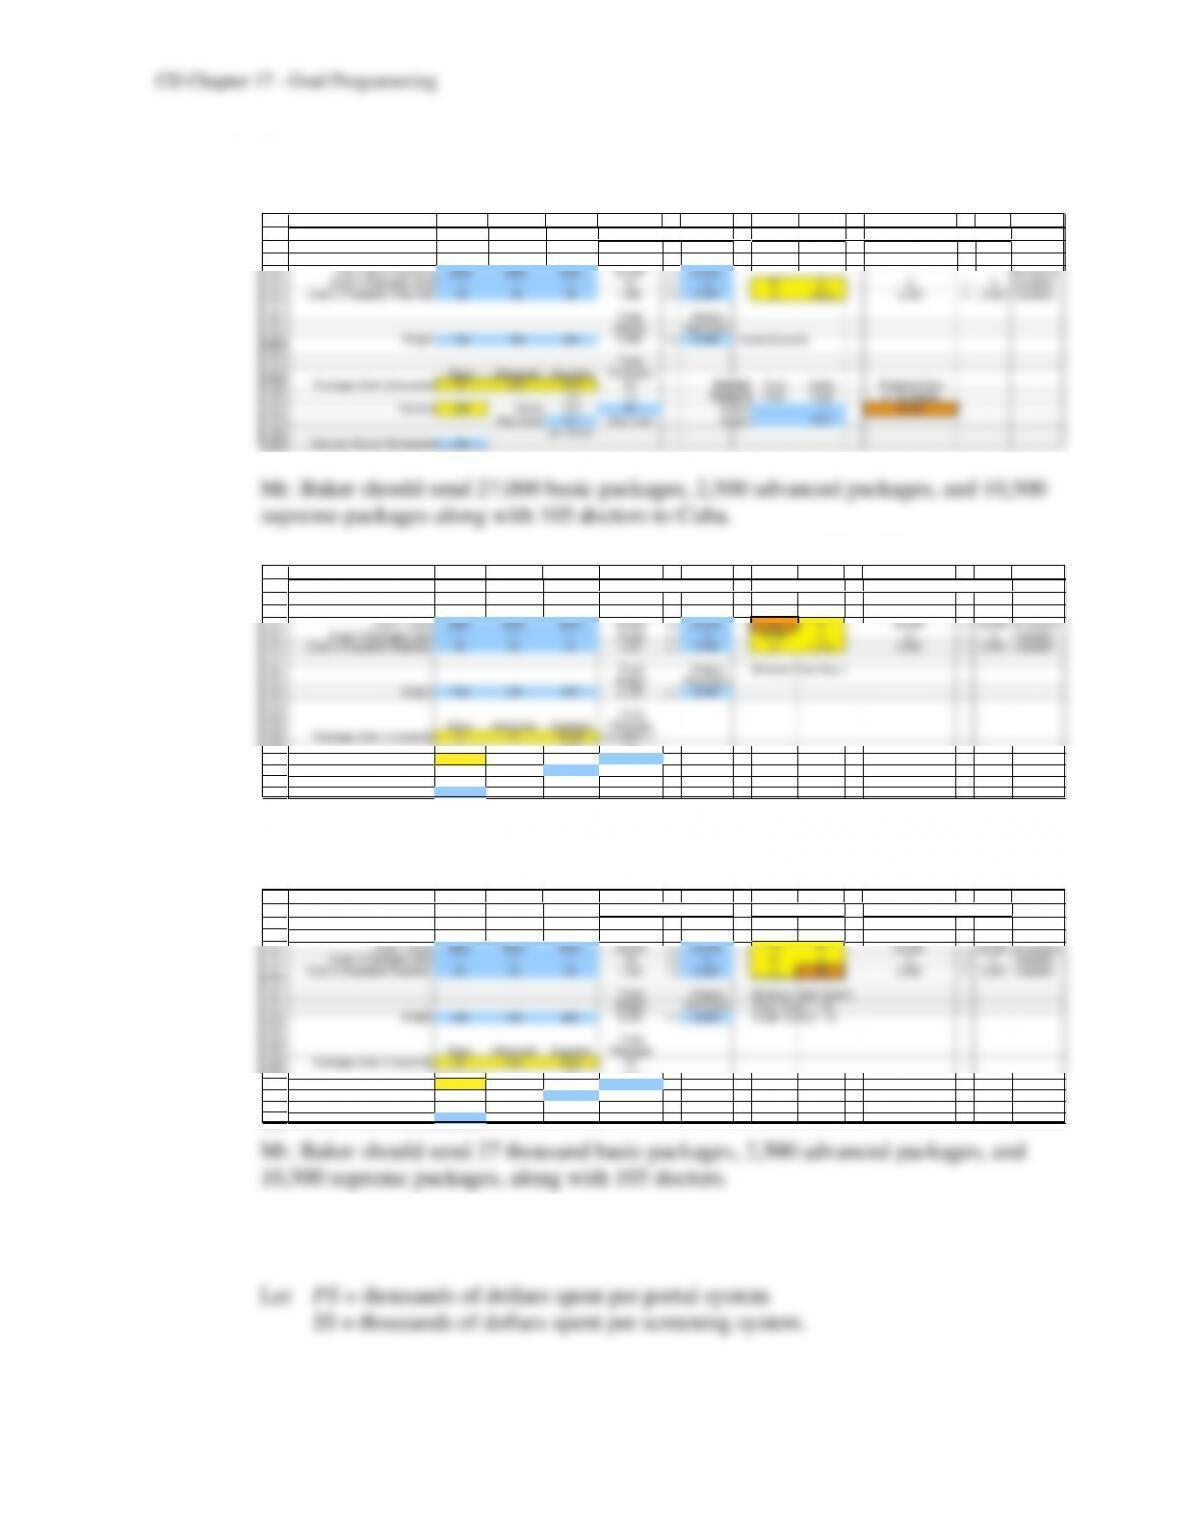
e) We start by minimizing the amount over goal 1 (total cost ≤ $20 million).
1
2
3
4
5
6
7
8
9
10
11
12
13
14
15
16
17
18
19
A B C D E F G H I J K L M N O
Level Amount Amount Balance
Basic Advanced Supreme Achieved Goal Over Under (Level-O ver+Under) Goal
Goal 1 (Cost) $300 $350 $720 20,000 <= 20,000 0 0 20,000 = 20,000 $thousand
Goal 2 (Packages Sent) 1 1 1 19.024 >= 3 16.024 0 3 = 3 thousand
Goal 3 (Population Reached) 30 35 54 1,027 >= 2,200 0 1,173 2,200 = 2,200 thousand
Total Weight Minimize Over Goal 1
Weight Restriction
Weight 120 180 220 4,185 <= 6,000
Total
Basic Advanced Supreme Packages
Packages Sent (thousands) 0 0 19.024 19.02361111
<= <=
Doctors 191 Safety 19.1 40
Restriction 0.1 Size Limit
per Doctor
Cost per Doctor ($thousand) 33
Deviations
Constraints
Goals
Then, since goal 2 is already met, we move on to goal 3. We minimize the amount
under goal 3 (population reached ≥ 20%), while constraining (amount over goal 1 = 0)
and (amount under goal 2 = 0).
1
2
3
4
5
6
7
8
9
10
11
12
13
14
15
16
17
18
19
A B C D E F G H I J K L M N O
Level Amount Amount Balance
Basic Advanced Supreme Achieved Goal Over Under (Level–Over+ Under) Goal
Goal 1 (Cost) $300 $350 $720 20,000 <= 20,000 0 0 20,000 = 20,000 $thousand
Goal 2 (Packages Sent) 1 1 1 40 >= 337 0 3 = 3 thousand
Goal 3 (Population Reached) 30 35 54 1,464 >= 2,200 0 735 2,200 = 2,200 thousand
Total Weight Minimize Under Goal 3
Weight Restriction (Over Goal 1 = 0)
Weight 120 180 220 6,000 <= 6,000 (Under Goal 2 = 0)
Total
Basic Advanced Supreme Packages
Packages Sent (thousands) 27 2.5 10.5 40
<= <=
Doctors 105 Safety 10.5 40
Restriction 0.1 Size Limit
per Doctor
Cost per Doctor ($thousand) 33
Deviations
Constraints
Goals
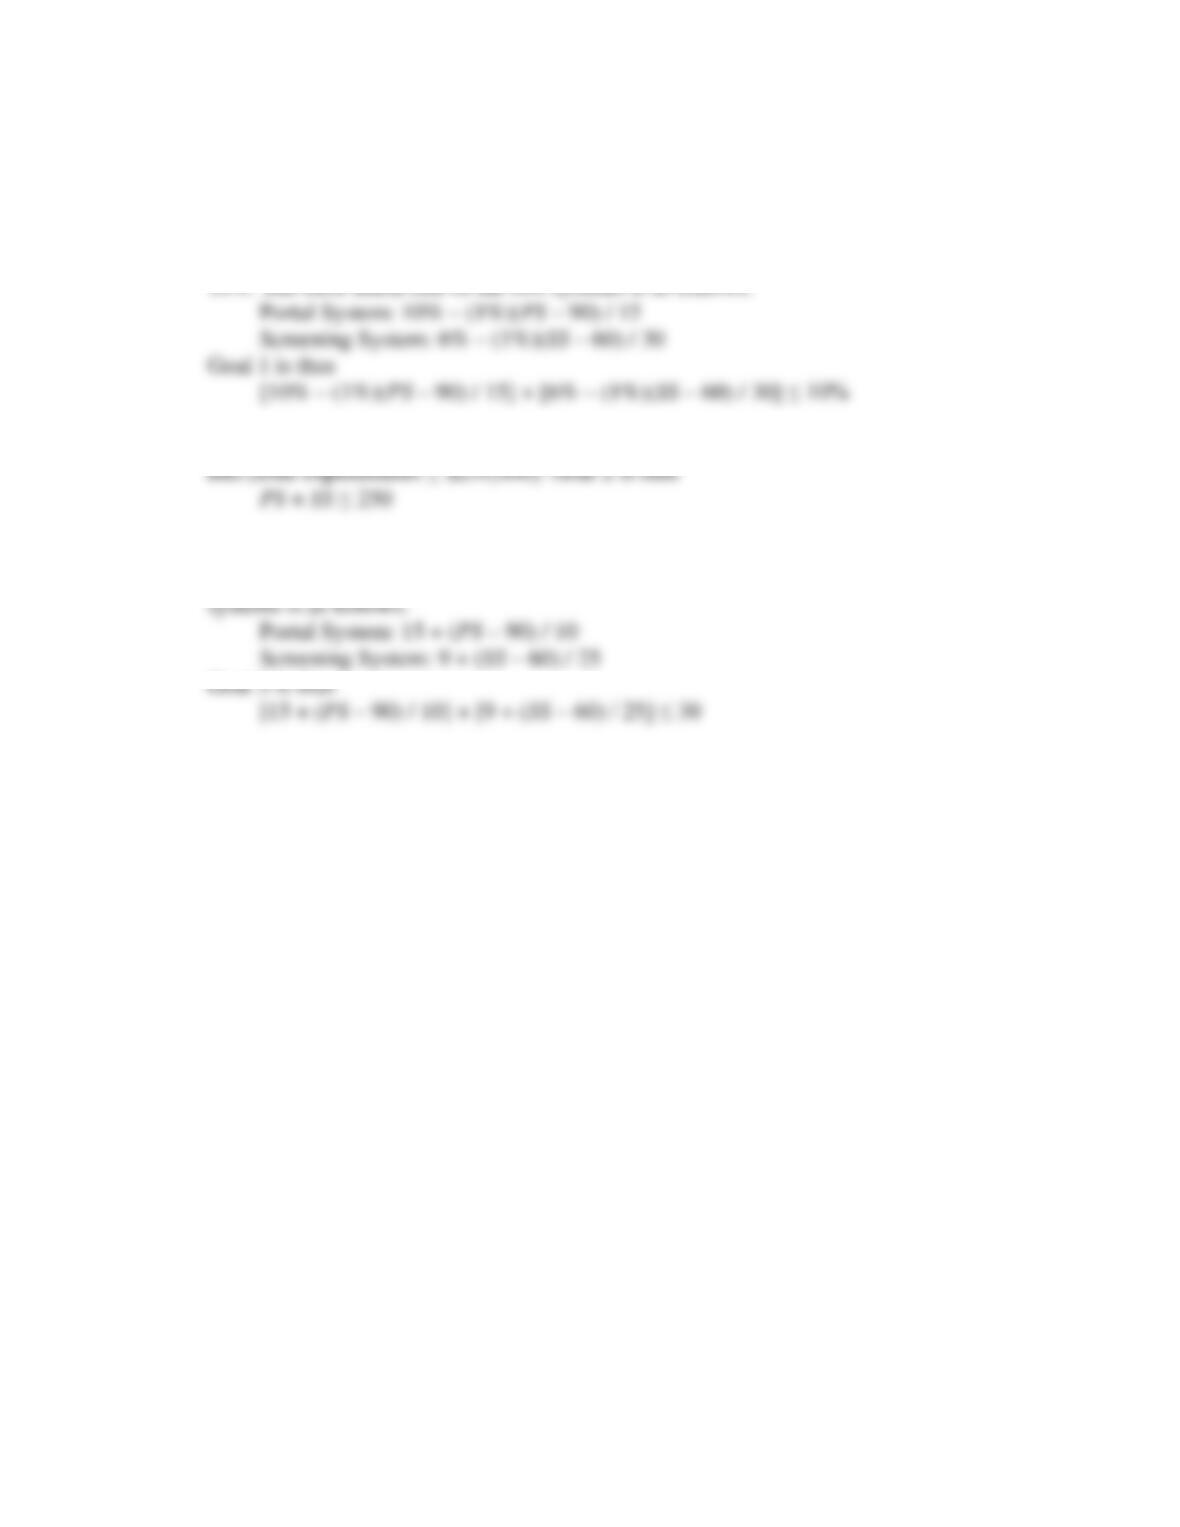
17.2 a) The two decisions to be made are how much to spend on the two security systems.
Hence, we define the following two variables.
CD17-12
b) Preemptive goal programming is appropriate because there is a clear order of priorities.
Priority 1 is met by all possible systems.
Priority 2 (hereafter referred to as goal 1) is that the false alarm rate should not exceed
10%. The false alarm rate of the two systems is as follows:
Priority 3 (hereafter referred to as goal 2) is that the first budgetary guideline should be
Priority 4 (hereafter referred to as goal 3) is that the second budgetary guideline should
be met (average total maintenance cost $30,000). The maintenance cost of the two
CD17-13
c)
Applying preemptive goal programming, the first solution will be somewhere inside the
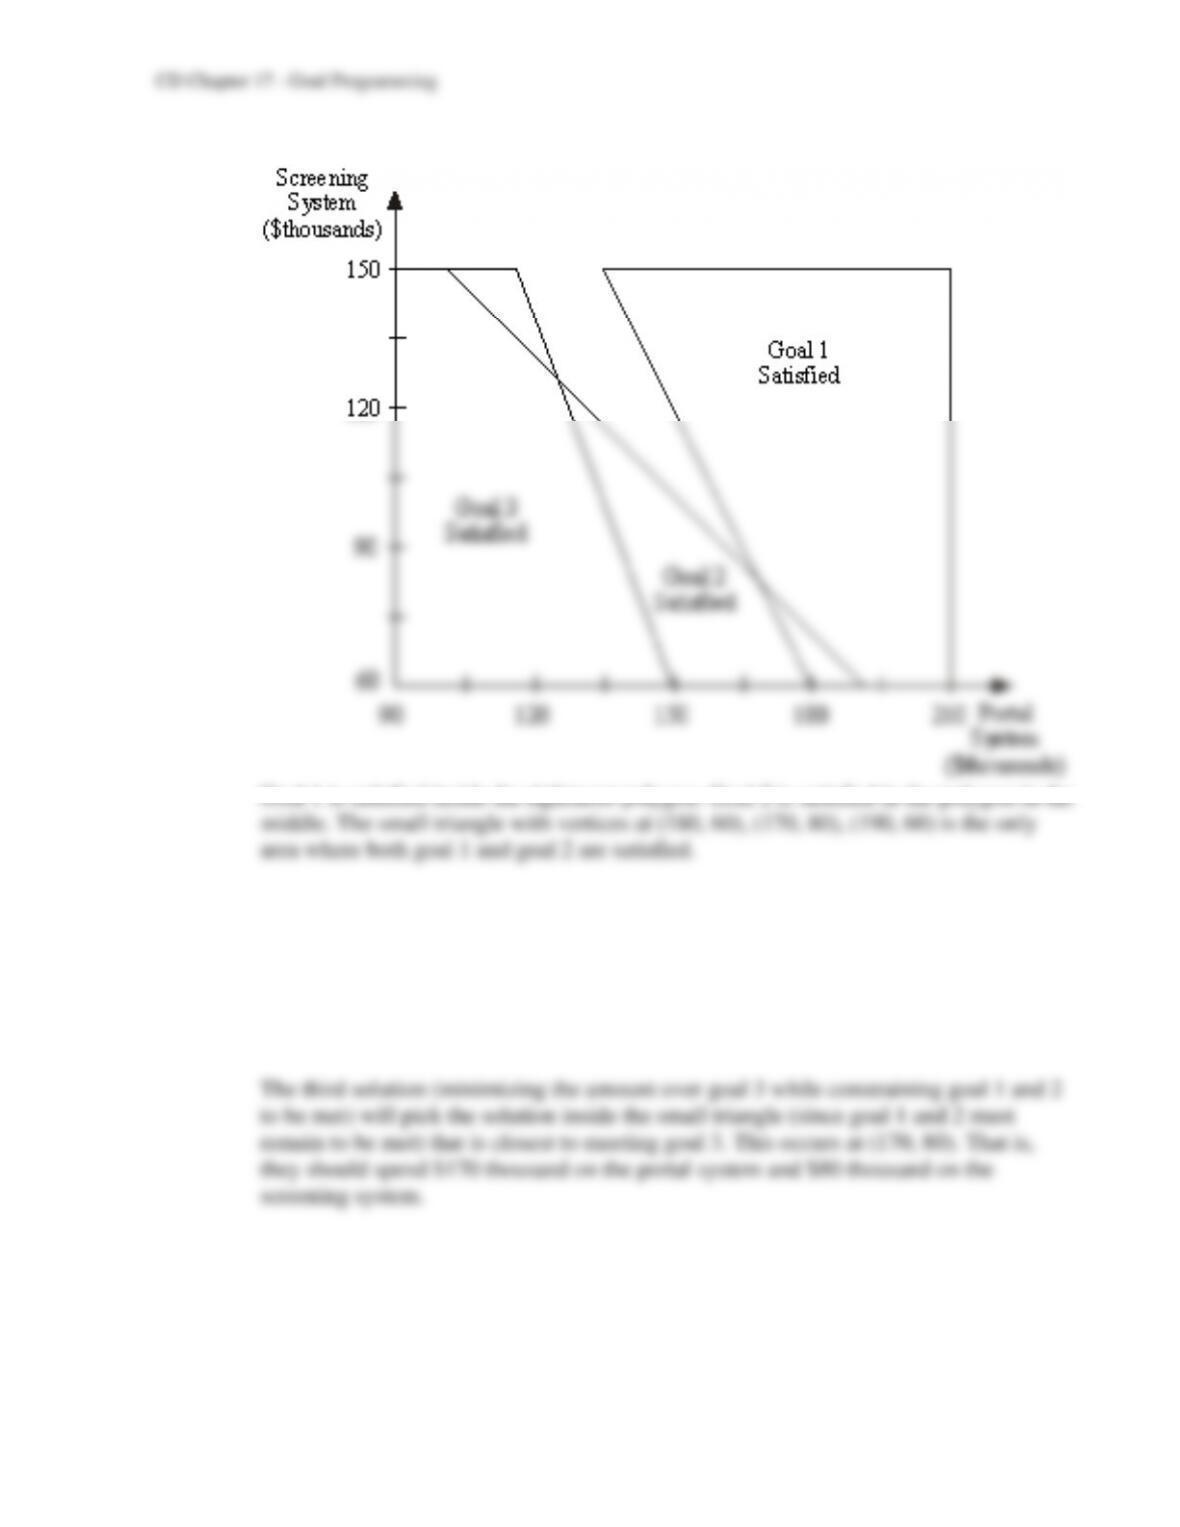
region where goal 1 is satisfied.
The second solution (minimizing the amount over goal 2 while constraining goal 1 to
be met) will give a solution inside the small triangle where both goal 1 and goal 2 are
met.
d) We start by minimizing the amount over goal 1 (false alarm rate ≤ 10%).
1
2
3
4
5
6
7
8
9
10
11
12
13
14
15
16
17
18
19
20
21
A B C D E F G H I J K L
Level Amount Amount Balance
Achieved Goal Over Under (Level-Over+Under) Goal
Goal 1 (False Alarm Rate) 10% <= 10% 0 0 10% = 10%
Goal 2 (Total Expenditure) 250 <= 250 0 0 250 = 250 ($thousand)
Goal 3 (Maintenance Cost) 32.8 <= 30 2.8 0 30 =30 ($thousand)
Portal Screening Minimize Over Goal 1
System System
Minimum 90 60
<= <=
Expenditure ($thousand/system) 170 80
<= <=
Maximum 210 150
False Alarm Rate 5% 5%
Base Rate 10% 6%
Minus 1% per ($x thousand) 15 30
Maintenance Cost ($thousand) 23 9.8
Base Rate 15 9
Deviations
Constraints
Goals
2
3
4
5
6
B
Level
Achieved
=SUM(FalseAlarmRate)
=SUM(Expenditure)
=SUM(MaintenanceCost)
2
3
4
5
6
I J K
Balance
(Level-Over+Under) Goal
=LevelAchieved-AmountOver+AmountUnder = =Goal
=LevelAchieved-AmountOver+AmountUnder = =Goal
=LevelAchieved-AmountOver+AmountUnder = =Goal
16
17
18
19
20
21
22
A B C
False Alarm Rate= B17-(1%)*(Expenditure-Minimum)/B18 =C17–(1%)*(Expenditure-Minimum)/C18
Base Rate 0.1 0.06
Minus 1% per ($x thousand) 15 30
Maintenance Cost ($thousand) =B21+ (Expenditure-Minimum)/B22 =C21+ (Expenditure-Minimum)/C22
Base Rate 15 9
Plus $1 per $x 10 =30/1.2
Range Name Cells
AmountOver F4:F6
AmountUnder G4:G6
Balance I4:I6
Deviations F4:G6
Expenditure B12:C12
FalseAlarmRate B16:C16
Goal D4:D6
LevelAchieved B4:B6
MaintenanceCost B20:C20
Maximum B14:C14
Minimum B10:C10
1
2
3
4
5
6
7
8
9
10
11
12
13
14
15
16
17
18
19
20
21
A B C D E F G H I J K L
Level Amount Amount Balance
Achieved Goal Over Under (Level-Over+Under) Goal
Goal 1 (False Alarm Rate) 10% <= 10% 0 0 10% = 10%
Goal 2 (Total Expenditure) 250 <= 250 0 0 250 = 250 ($thousand)
Goal 3 (Maintenance Cost) 32.8 <= 30 2.8 0 30 =30 ($thousand)
Portal Screening Minimize Over Goal 3
System System (Over Goal 1 = 0)
Minimum 90 60 (Over Goal 2 = 0)
<= <=
Expenditure ($thousand/system) 170 80
<= <=
Maximum 210 150
False Alarm Rate 5% 5%
Base Rate 10% 6%
Minus 1% per ($x thousand) 15 30
Maintenance Cost ($thousand) 23 9.8
Base Rate 15 9
Deviations
Constraints
Goals
e) The first two goals are now hard constraints, and we minimize the amount over goal 3.
1
2
3
4
5
6
7
8
9
10
11
12
13
14
15
16
17
18
19
20
21
A B C D E F G H I J K L
Level Amount Amount Balance
Achieved Goal Over Under (Level-Over+Under) Goal
Goal 1 (False Alarm Rate) 10% <= 10% Hard Constraint
Goal 2 (Total Expenditure) 250 <= 250 Hard Constraint ($thousand)
Goal 3 (Maintenance Cost) 32.8 <= 30 2.8 0 30 =30 ($thousand)
Portal Screening Minimize Over Goal 1
System System
Minimum 90 60
<= <=
Expenditure ($thousand/system) 170 80
<= <=
Maximum 210 150
False Alarm Rate 5% 5%
Base Rate 10% 6%
Minus 1% per ($x thousand) 15 30
Maintenance Cost ($thousand) 23 9.8
Base Rate 15 9
Deviations
Constraints
Goals
If the linear program had no feasible solution, this would imply that it is not possible to
meet all of the higher priority goals that were turned into hard constraints.
f) We no longer use goal programming. The goal is to minimize the total false alarm rate
subject to meeting the first budgetary guideline (total expenditure), but ignoring the
second budgetary guideline (maintenance cost). The spreadsheet model follows.
1
2
3
4
5
6
7
8
9
10
11
12
13
14
15
16
17
18
19
20
21
A B C D
Level
Achieved Maximum
Total False Alarm Rate 9% Expenditure
Total Expenditure 250 <= 250
Maintenance Cost 34
Portal Screening
System System
Minimum 90 60
<= <=
Expenditure ($thousand/system) 190 60
<= <=
Maximum 210 150
False Alarm Rate 3% 6%
Base Rate 10% 6%
Minus 1% per ($x thousand) 15 30
Maintenance Cost ($thousand) 25 9
Base Rate 15 9
Plus $1 per $x 10 25
The total false alarm rate can be lowered to 9% by ignoring the second budgetary
guideline (maintenance cost).
g) Further what-if analysis might look at how low the false-alarm rate can be lowered by