
CD11s-1
CD Supplement to Chapter 11 Additional Queuing Models
Review Questions
11s-1 When the system is full with K customers, any new arriving customers leave without
entering the system.
11s-2 PK is the probability that the system is full and therefore the probability that an arriving
customer is turned away.
11s-5 Upon completing service, the time until a member of the calling population needs service
again has an exponential distribution with a mean of N/.
11s-7 Utilization of servers =
s
.
11s-8 No, this approximation should not be used when is nearly 1 unless K or N is huge.
11s-9 The M/M/s model has a great amount of variability in service times. The M/D/s model
CD11s-2
Problems
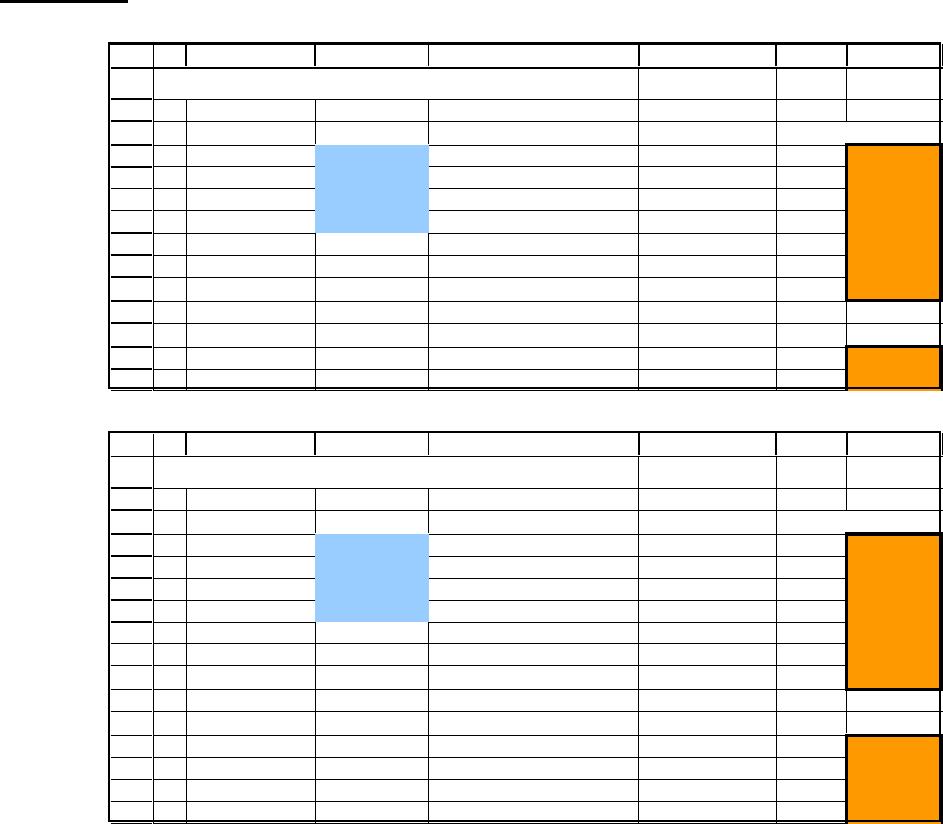
11s.1 a) With 0 spaces, 42.9% of customers will be lost.
1
2
3
4
14
A B C D E F G
Template for M/M/s Finite Queue Model
Data Results
= 0.25 (mean arrival rate) L = 0.4285714
1 0.4285714
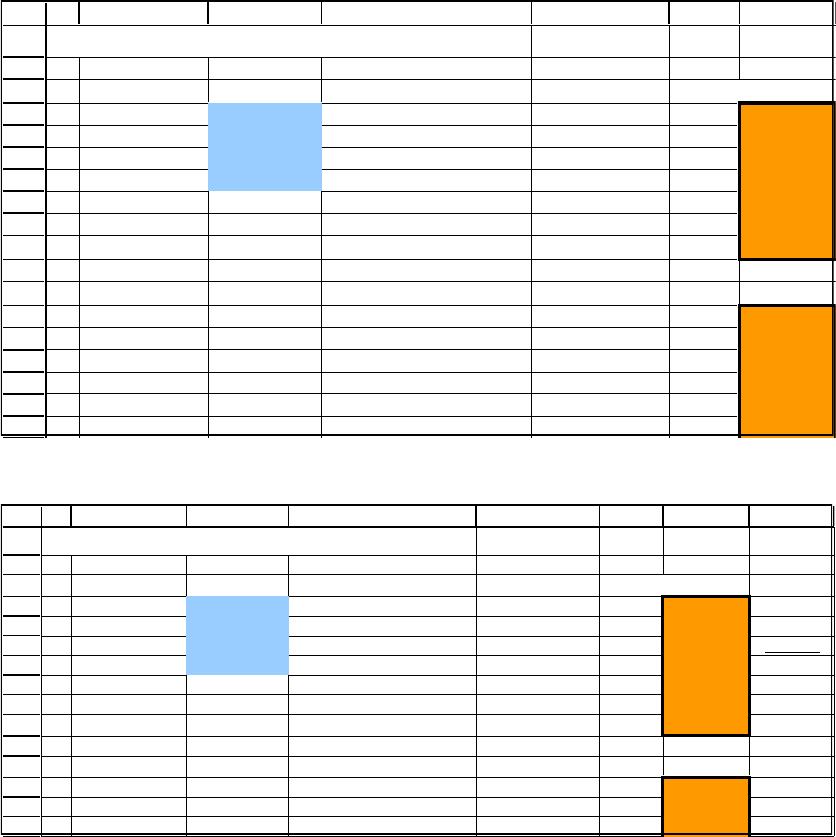
b) With 2 spaces, 15.4% of customers will be lost.
1
2
3
5
7
8
11
12
A B C D E F G
Template for M/M/s Finite Queue Model
Data Results
n
Pn
CD11s-3
c) With 4 spaces, 7.2% of customers will be lost.
1
2
3
6
11
12
13
15
16
A B C D E F G
Template for M/M/s Finite Queue Model
Data Results
n
Pn
0 0.3041283
minutes.
1
2
3
5
7
10
11
12
A B C D E F G H
Template for M/M/s Finite Queue Model
Data Results
n
Pn
CD11s-4
With space for 3 cars, 12.3% of customers will be lost, L = 1.02 cars, and W = 3.47
minutes.
1
2
3
5
7
8
11
12
A B C D E F G H
Template for M/M/s Finite Queue Model
Data Results
n
Pn
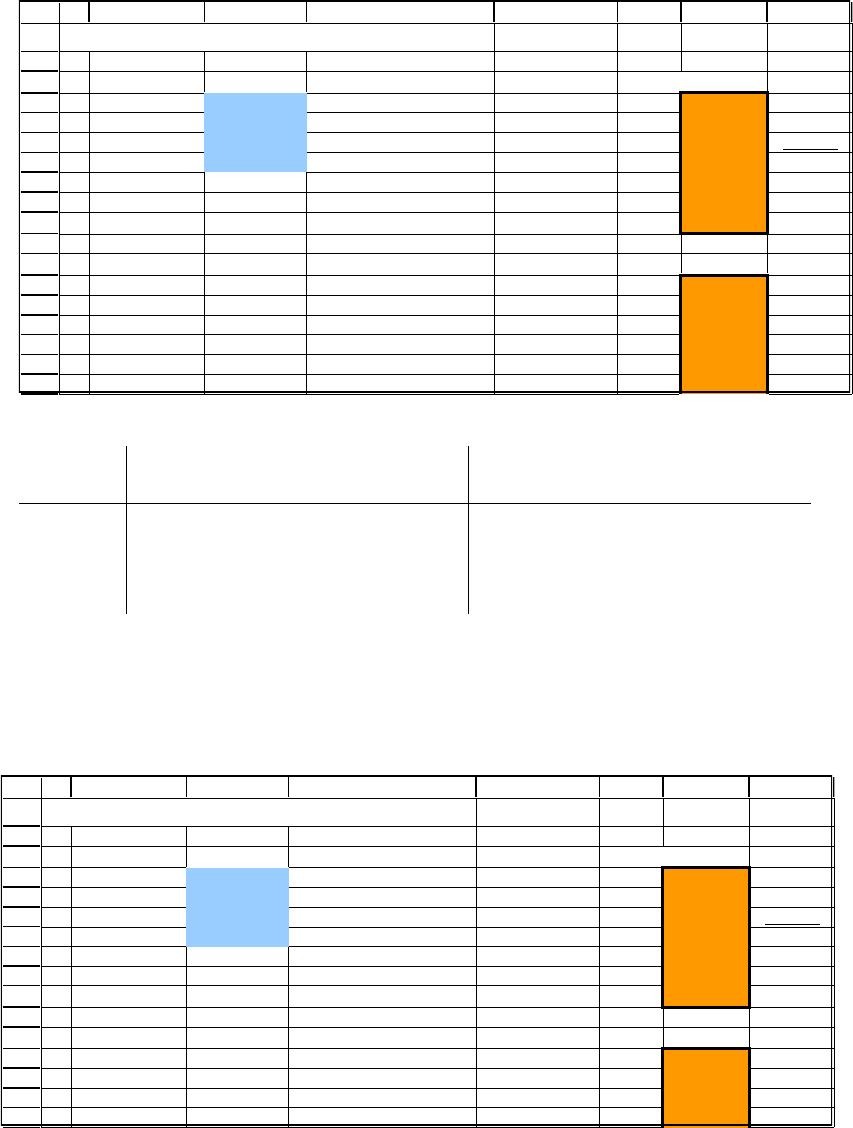
With space for 4 cars, 7.6% of customers will be lost, L = 1.24 cars, and W = 4.03
minutes.
1
2
3
4
9
10
11
12
13
14
15
A B C D E F G H
Template for M/M/s Finite Queue Model
Data Results
= 0.6666667
n
Pn
0 0.3838863
CD11s-5
With space for 5 cars, 4.8% of customers will be lost, L = 1.42 cars, and W = 4.48
minutes.
1
2
3
6
11
12
13
15
16
A B C D E F G H
Template for M/M/s Finite Queue Model
Data Results
n
Pn
0 0.3654135
c)
spaces
rate customers
are lost (Pk)
change in Pk
profit/hour
($4)()(1–Pk)
change in
profit/hour
2
0.21
$63.20
3
0.12
0.09
$70.40
4
0.08
0.04
$73.60
5
0.05
0.03
$76.00
d) Since it cost $200 per month per car length rented, each additional space must bring at
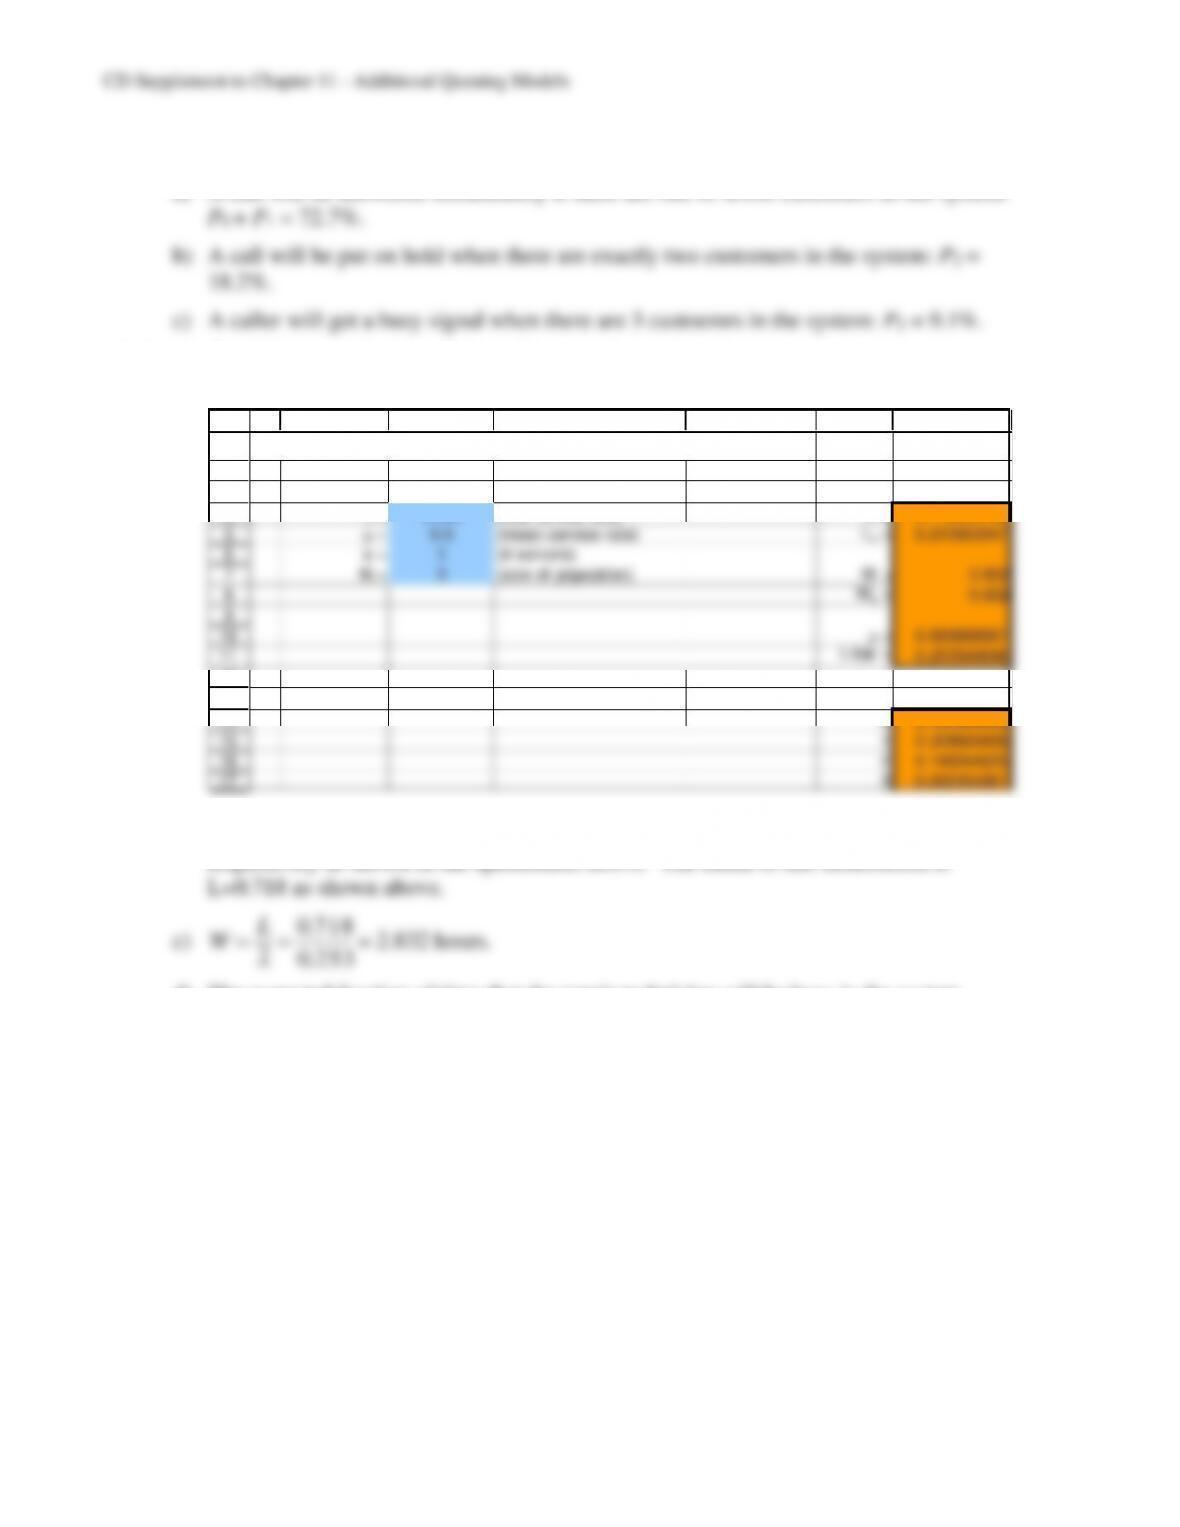
11s.3
1
2
3
4
5
6
7
8
11
12
A B C D E F G H
Template for M/M/s Finite Queue Model
Data Results
= 15 (mean arrival rate) L = 1
n
Pn
CD11s-6
a) A call will be answered immediately if there are one or fewer customers in the system:
11s.4 a) The M/M/s model with a finite calling population fits this queueing system.
b)
1
2
3
4
9
12
13
A B C D E F G
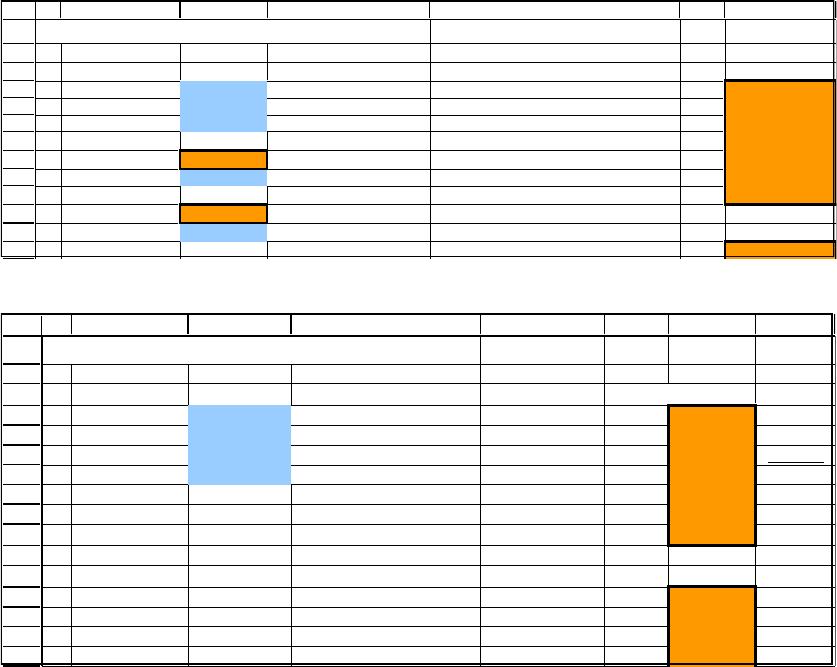
Template for M/M/s Finite Calling Population Model
Data Results
= 0.333 (max arrival rate) L = 0.718052738
0n
Pn
The probabilities that there are 0, 1, 2, or 3 machines not running are P0, P1, P2, and P3
respectively as shown in the spreadsheet above. The mean of this distribution is
d) The expected fraction of time that the repair technician will be busy is the system
utilization, which is 0.667.
CD11s-7
e) M/M/s model:
1
2
3
A B C D E G H
Template for the M/M/s Queueing Model
Data Results
Prob(Wq > t) = 0.56432115
Finite queue variation of the M/M/s model with K=3:
1
2
3
5
7
8
11
12
A B C D E F G H
Template for M/M/s Finite Queue Model
Data Results
n
Pn
CD11s-8
f)
1
2
3
4
9
12
13
A B C D E F G
Template for M/M/s Finite Calling Population Model
Data Results
0n
Pn
The probabilities that there are 0, 1, 2, or 3 machines not running are P0, P1, P2, and P3
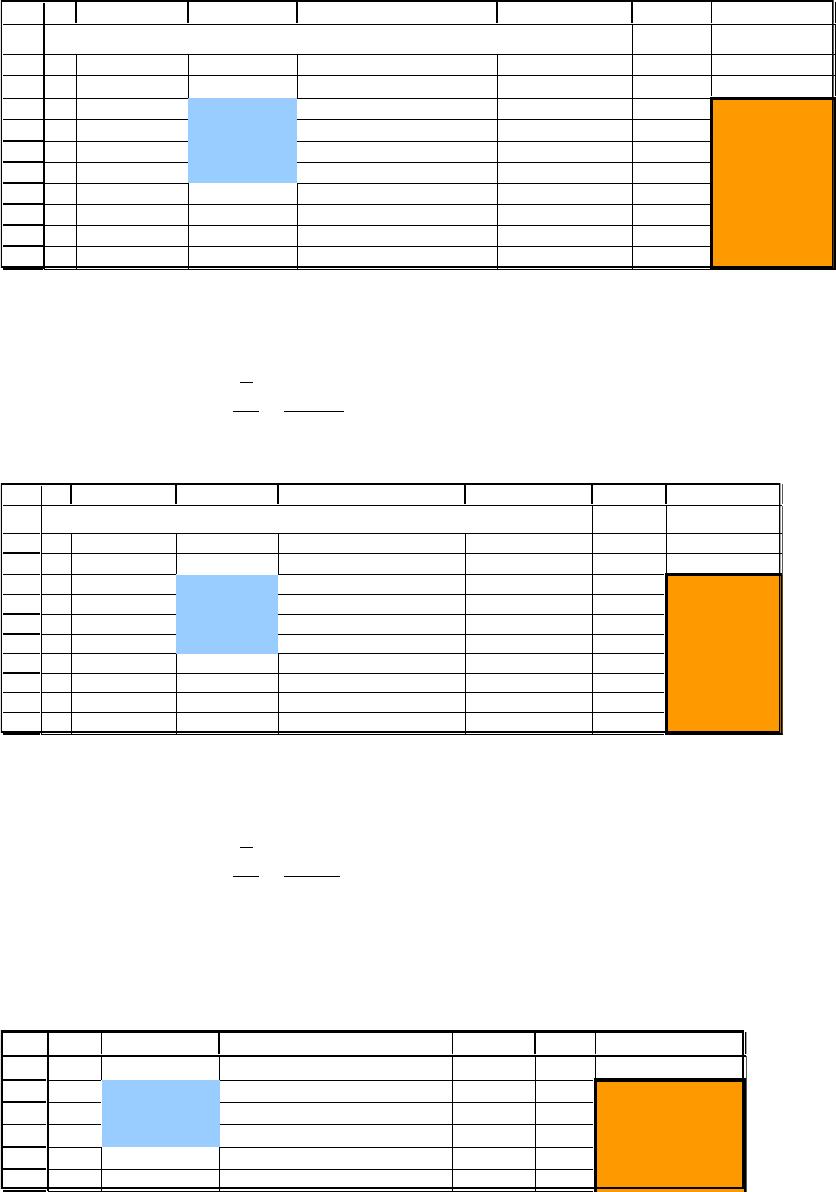
11s.5 a) Alternative 1:
1
2
3
4
9
12
13
A B C D E F G
Template for M/M/s Finite Calling Population Model
Data Results
0n
Pn
Three machines are the maximum that can be assigned to an operator while still
achieving the required production rate. The average number not running is L=0.32.
CD11s-9
b) Alternative 2:
1
2
3
9
10
A B C D E F G
Template for M/M/s Finite Calling Population Model
Data Results
= 0.4
Three operators are required to achieve the required production rate. The average
c) Alternative 3:
1
2
3
9
A B C D E F G
Template for M/M/s Finite Calling Population Model
Data Results
Two operators are required to achieve the required production rate. The average
number not running is L = 1.035. Thus, 1 – (1.035 / 12) = 91.4% of machines are
11s.6 a) L = Lq +
= [
2
2+
2]/[2(1–
)]+
= [(1)2(0.354)2 + (0.5)2]/[2(1–0.5)]+0.5 = 0.875.
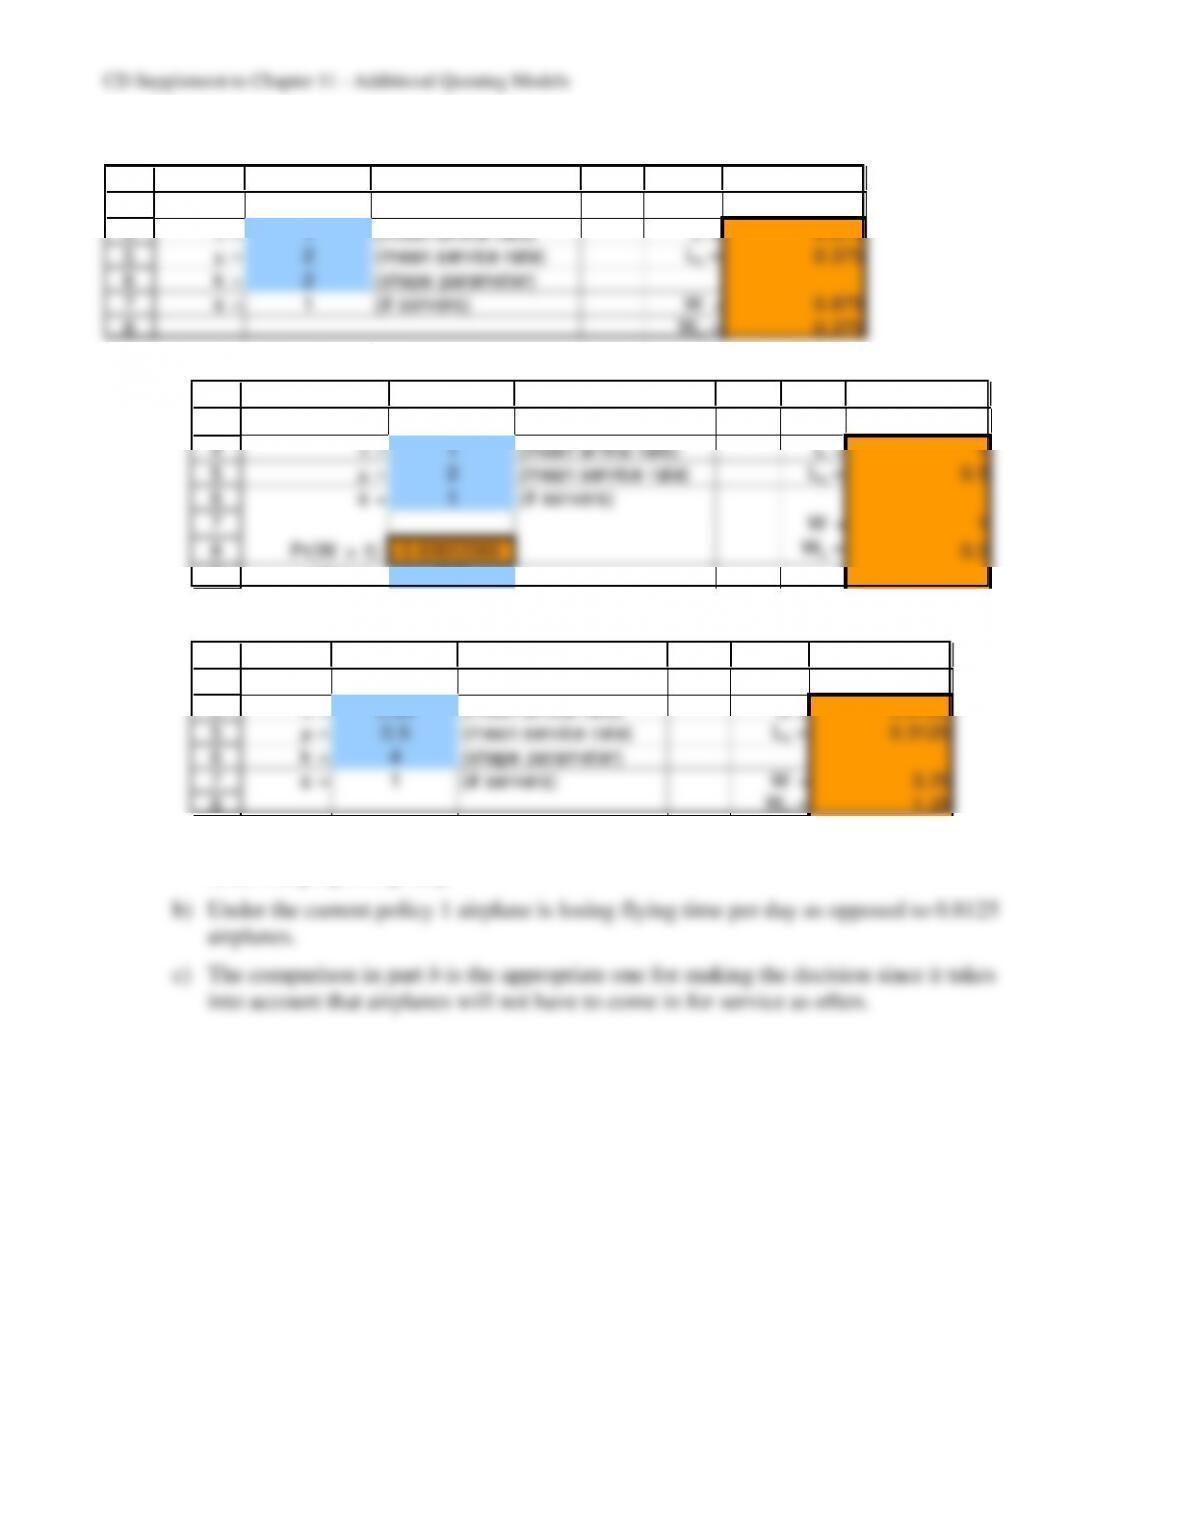
c) M/G/1 Model:
3
B C D E F G
Data Results
CD11s-10
d) M/Ek/1 Model:
3
4
B C D E F G
Data Results
= 1 (mean arrival rate) L = 0.875
11s.7 Current policy (M/M/1 model):
3
9
B C D E G H
Data Results
when t = 0.5
Proposal (M/Ek/1):
3
4
B C D E F G
Data Results
= 0.25 (mean arrival rate) L = 0.8125
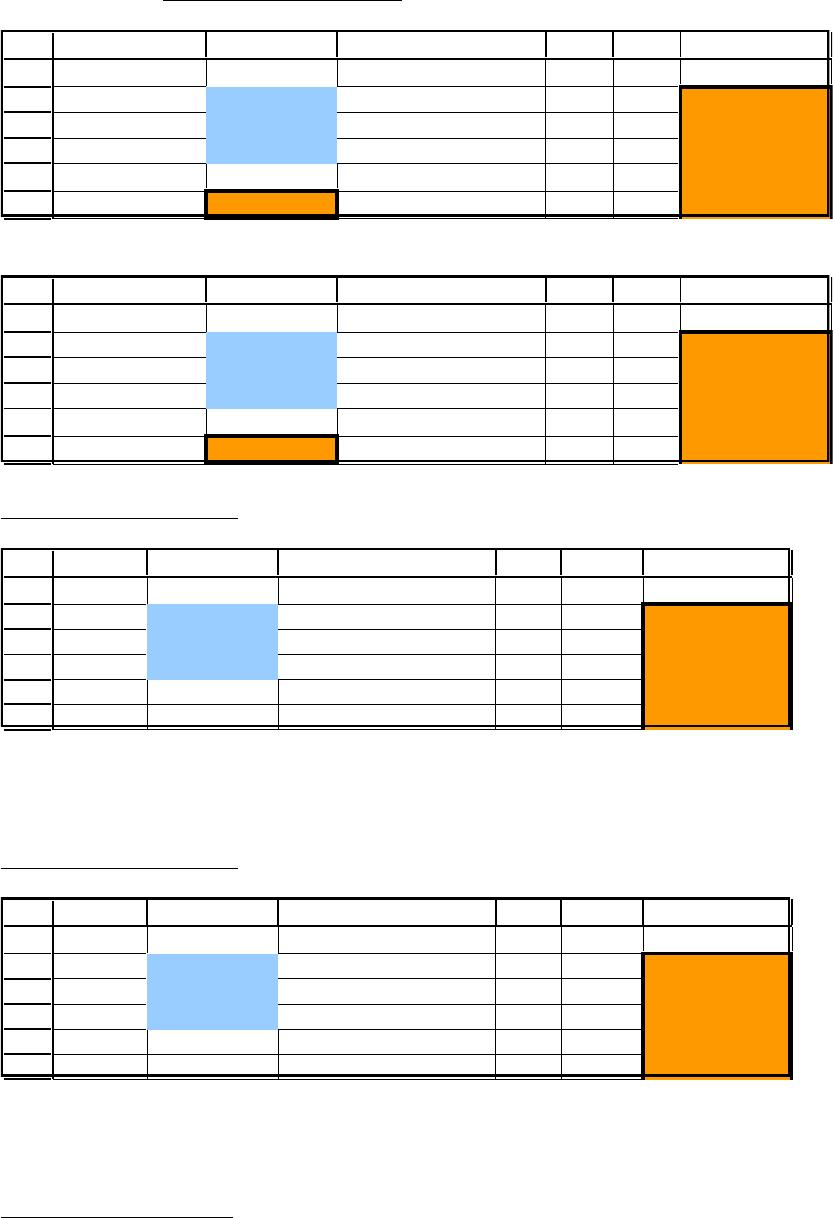
a) Under the current policy, an airplane loses 1 day of flying time as opposed to 3.25 days
under the proposed policy.
CD11s-11
11s.8 a) Exponential distribution:
Status quo:
3
4
6
7
B C D E G H
Data Results
= 24 (mean arrival rate) L = 4
Proposal:
3
4
6
7
B C D E G H
Data Results
= 48 (mean arrival rate) L = 4.444444444
Erlang distribution, k=2:
Status quo:
3
4
8
B C D E F G
Data Results
= 24 (mean arrival rate) L = 3.2
Wq = 0.1
Proposal:
L=3.5 and W=0.0729
Erlang distribution, k=8:
Status quo:
3
4
8
B C D E F G
Data Results
= 24 (mean arrival rate) L = 2.6
Wq = 0.075
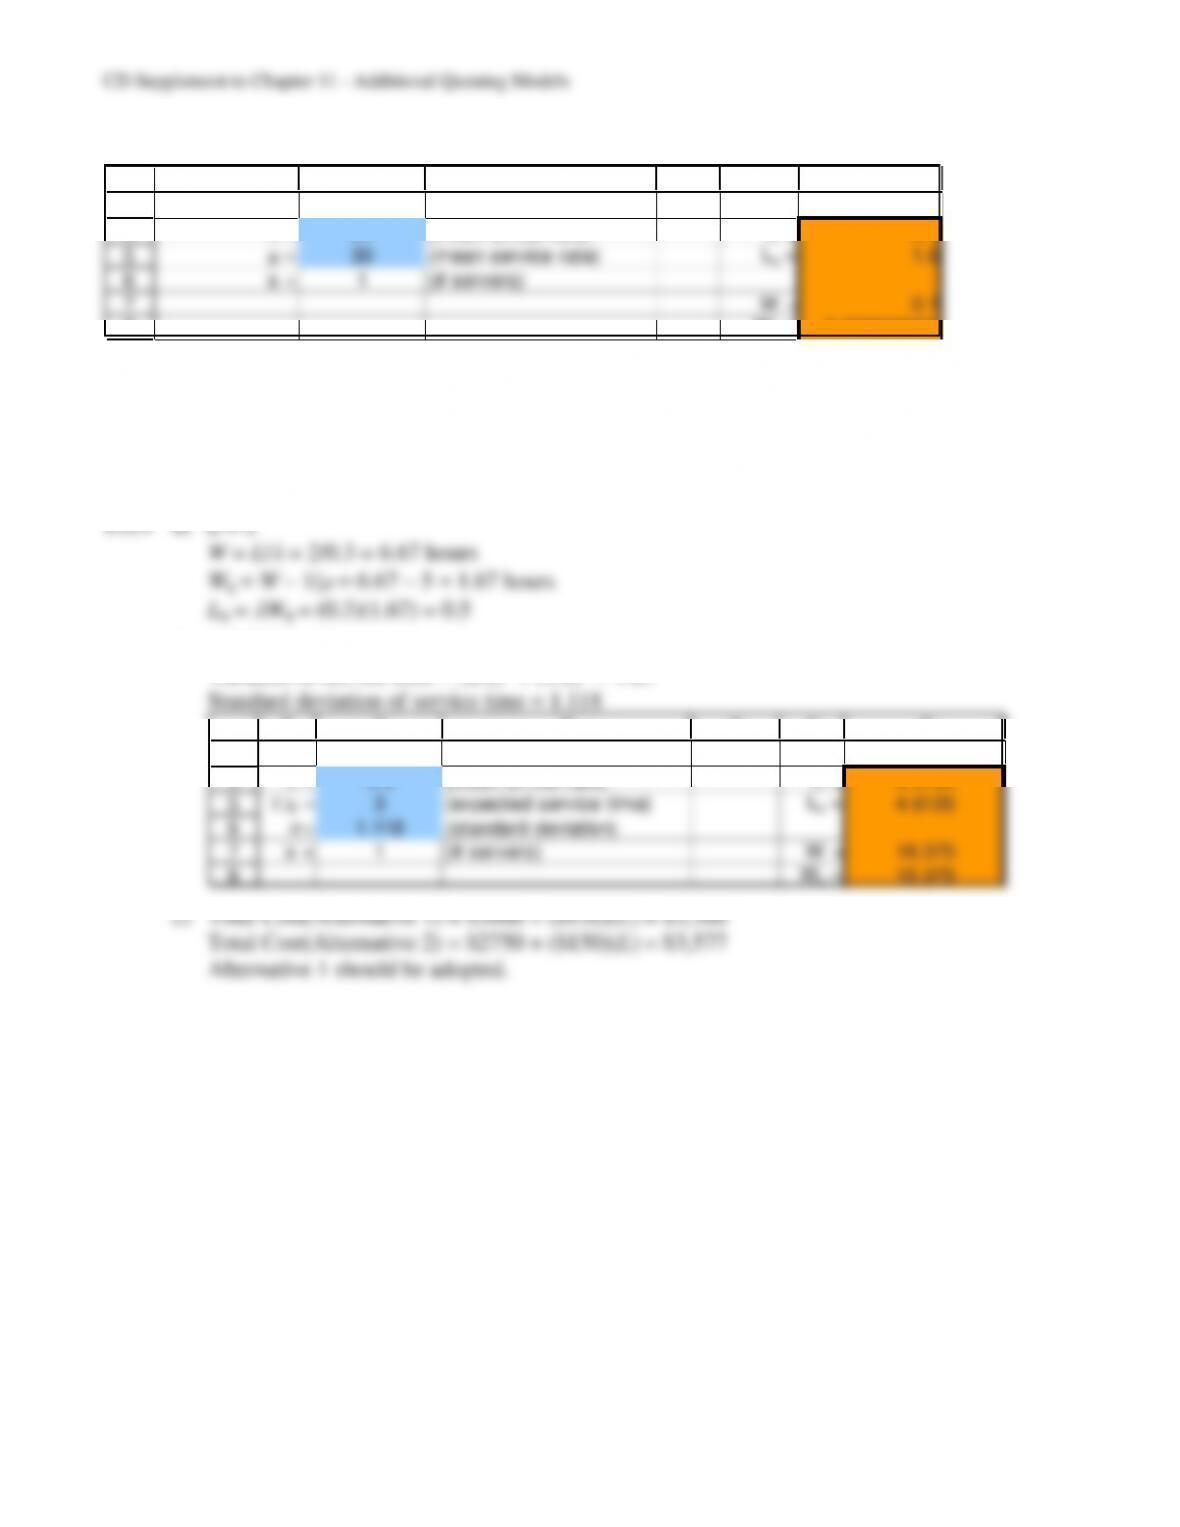
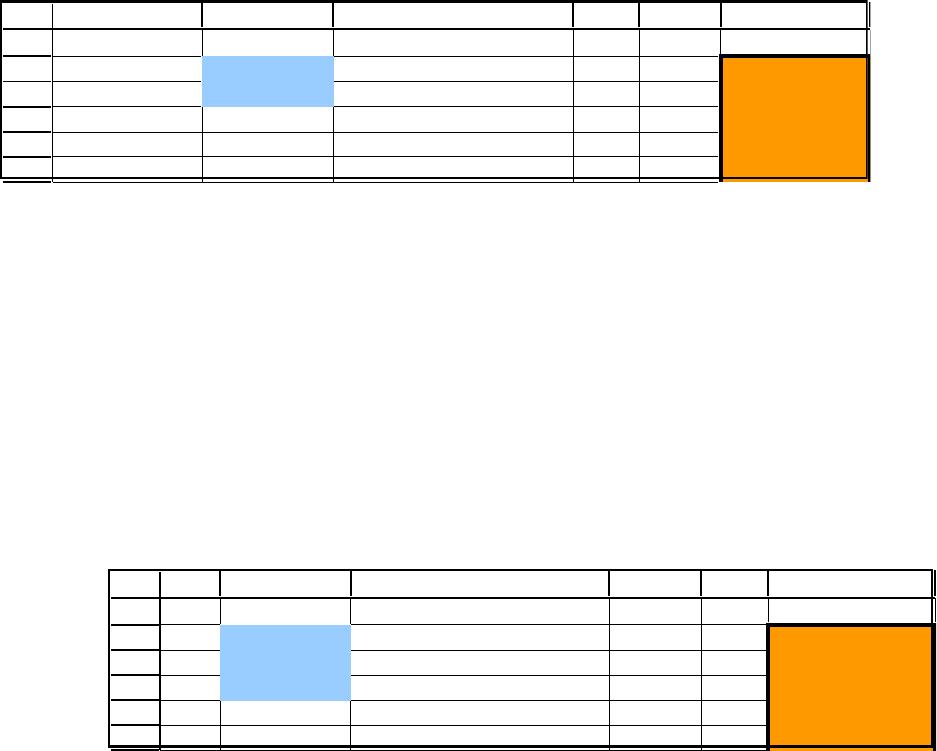
Degenerate distribution:
CD11s-12
Status quo:
3
4
8
B C D E F G
Data Results
= 24 (mean arrival rate) L = 2.4
Wq = 0.066666667
Proposal:
L=3.5 and W=0.0729
b) The proposal is better regardless of the distribution used. (Note that the L shown in the
spreadsheets for the status quo needs to be doubled since there are two tool cribs.)
c) Insight three is illustrated.
b) M/G/1 Model:
Variance of service time = (2/2)2 + (1/2)2 = 1.25
3
4
B C D E F G
Data Results
= 0.3 (mean arrival rate) L = 5.5125