CD Supplement to Chapter 10 Time-Series Forecasting with CB
Predictor
Review Questions
10s-1 CB Predictor uses the raw data to provide the best fit for all these inputs as well as the
forecasts.
Problems
10s.1 a) Best
= 0.1128. Forecast = 50.
1
2
3
4
5
6
7
8
9
10
11
12
13
A B C D
Time True
Period Value
151
248
352
449
553
649
748
Best
851 0.1128
950
10 49
11 50
1
2
3
4
5
6
7
8
9
10
11
12
13
A B C D
Time True
Period Value
152
250
353
451
552
648
752
Best
853 0.001
949
10 52
11 52
1
2
3
4
5
6
7
8
9
10
11
12
13
A B C D
Time True
Period Value
150
252
351
455
553
656
752
Best
855 0.5
954
10 53
11 54
10s.2 a) Best
= 0.667. Best
= 0.5. Forecast = 76.
1
2
3
4
5
6
7
8
9
10
11
12
13
14
15
A B C D
Time True
Period Value
152
255
355
458
559
663
764
866
Best
967 0.667
10 72
11 73
Best
12 74 0.5
13 76
CD10s-3
1
2
3
4
5
6
7
8
9
10
11
12
13
14
15
A B C D
Time True
Period Value
152
255
359
461
566
669
771
872
Best
973 0.7328
10 74
11 73
Best
12 74 0.999
13 74
c) Best
= 0.8516. Best
= 0.999. Forecast = 80.
1
2
3
4
5
6
7
8
9
10
11
12
13
14
15
A B C D
Time True
Period Value
152
253
351
450
548
647
749
852
Best
957 0.8516
10 62
11 69
Best
12 74 0.999
13 80
CD Supplement to Chapter 10 – Time-Series Forecasting with CB Predictor
1
2
3
4
5
6
7
8
9
10
11
12
13
A B C D
Time True
Period Value
1 382
2 405
3 398 Best Method
4 421 Exp. Smoothing
5 426 with Trend
6 415
7 443
Best
8 451 0.348
9 446
10 464
Best
11 468 0.999
29
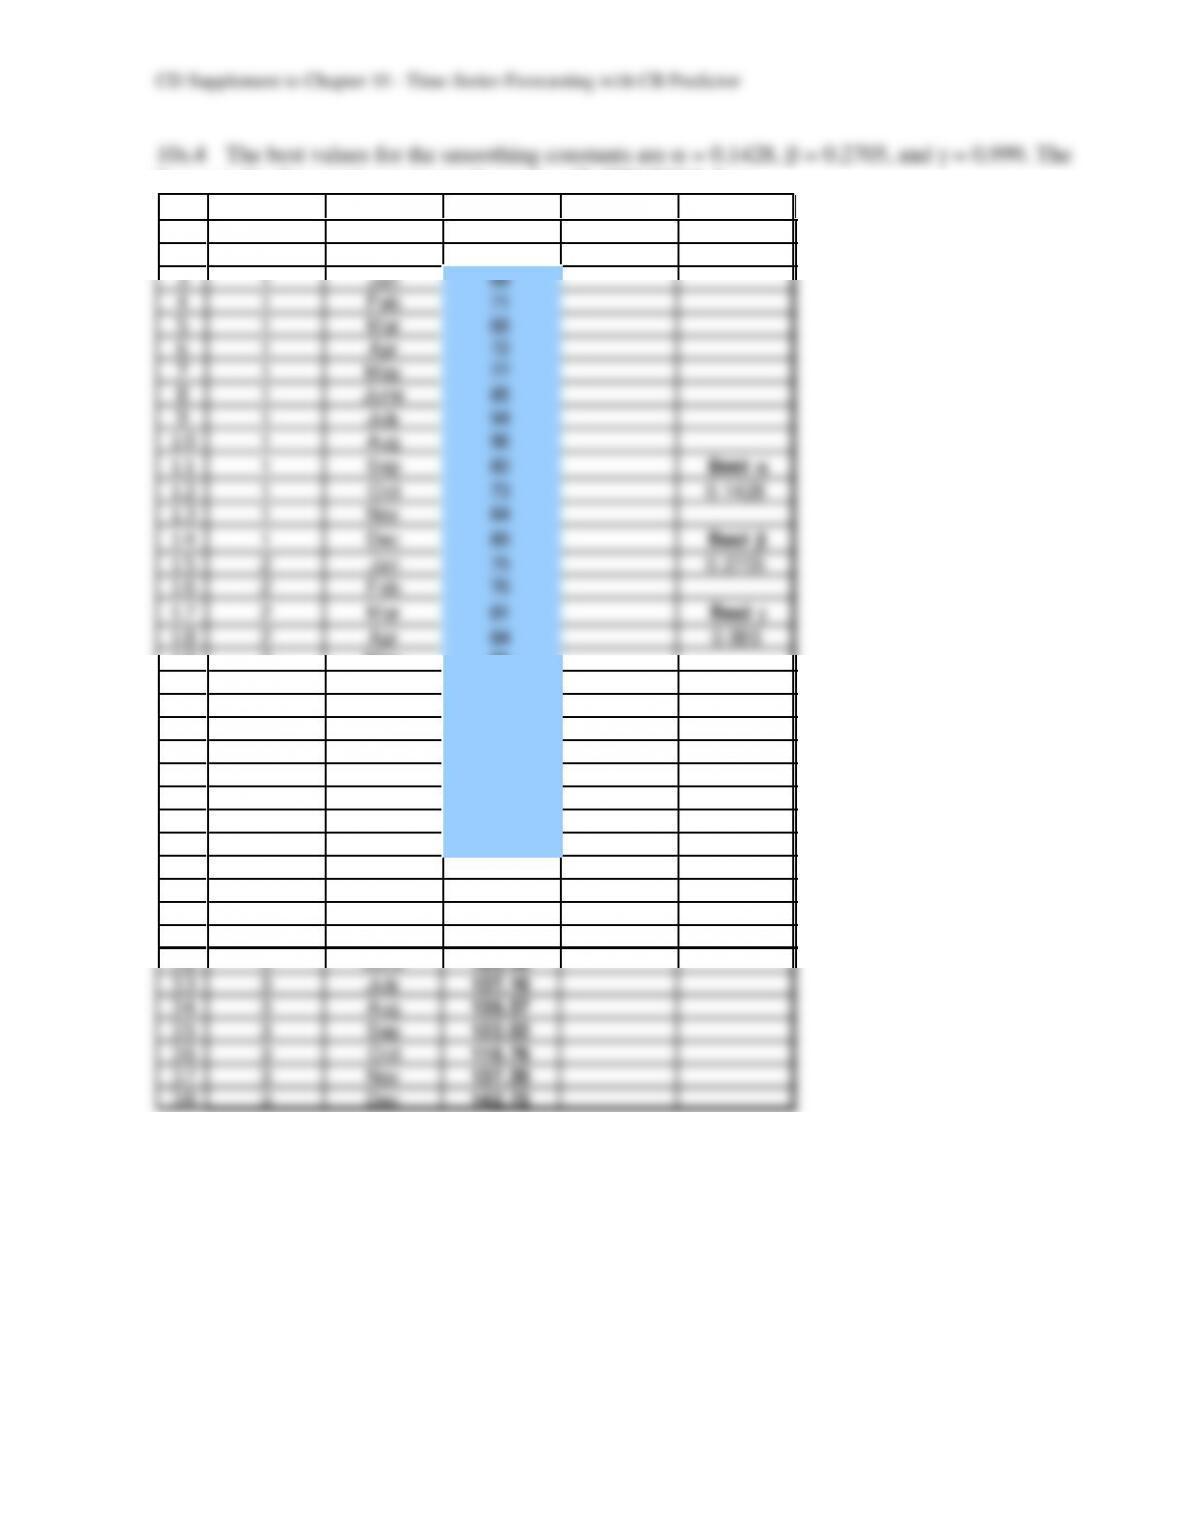
forecasts for the coming year are shown in cells C28:C38 below.
1
2
3
4
5
6
7
8
9
10
11
12
13
14
15
16
17
18
19
20
21
22
23
24
25
26
27
28
A B C D E
True
Year Month Value
1 Jan 68
1 Feb 71
1 Mar 66
1 Apr 72
1 May 77
1 June 85
1 July 94
1 Aug 96
1 Sep 80
Best
1 Oct 73 0.1428
1 Nov 84
1 Dec 89
Best
2 Jan 75 0.2705
2 Feb 76
2 Mar 81
Best
2 Apr 84 0.999
2 May 85
2 June 99
1
2
3
4
5
6
7
8
9
10
11
12
13
14
15
16
17
49
50
51
52
53
54
55
57
58
59
A B C D E
True
Year Month Value
1 Jan 352 Best Method
1 Feb 329 Exp. Smoothing
1 Mar 365 With Trend & Seasonality
1 Apr 358
1 May 412
Best
1 June 446 0.5673
1 July 420
1 Aug 471
Best
1 Sep 355 0.0572
1 Oct 312
1 Nov 567
Best
1 Dec 533 0.798
2 Jan 317
2 Feb 331
2 Mar 344
4 Nov 662
4 Dec 581
5 Jan 376.56
5 Feb 376.65
5 Mar 420.17
5 Apr 443.68
5 May 470.68
5 Jul 475.62
5 Aug 552.62
5 Sep 386.58