Chapter 02 – Financial Services: Depository Institutions
2-1
Education.
Solutions for End-of-Chapter Questions and Problems: Chapter Two
1. What are the differences between community banks, regional banks, and money-center
banks? Contrast the business activities, location, and markets of each of these bank groups.
Community banks typically have assets under $1 billion and serve consumer and small business
customers in local markets. In 2012, 91.5 percent of the banks in the United States were
center banks have headquarters in New York City.
2. Use the data in Table 2-5 for banks in the two asset size groups (a) $100 million-$1 billion
and (b) more than $10 billion to answer the following questions.
a. Why have the ratios for ROA and ROE tended to increase for both groups over the
1990-2006 period, decrease in 2007-2009, and increase in 2010-2012? Identify and
discuss the primary variables that affect ROA and ROE as they relate to these two size
groups.

Chapter 02 – Financial Services: Depository Institutions
2-2
Education.
In the late 2000s, the U.S. economy experienced its strongest recession since the Great
2009, while the smaller banks’ ROAs and ROEs remained negative until 2010.
b. Why is ROA for the smaller banks generally larger than ROA for the large banks?
c. Why is the ratio for ROE consistently larger for the large bank group?
d. Using the information on ROE decomposition in Appendix 2A, calculate the ratio of
equity to total assets for each of the two bank groups for the period 1990-2012. Why
has there been such dramatic change in the values over this time period, and why is
there a difference in the size of the ratio for the two groups?

Chapter 02 – Financial Services: Depository Institutions
2-3
ROE = ROA x (Total Assets/Equity)
Therefore, (Equity/Total Assets) = ROA/ROE
$100 million – $1 Billion
Over $10 Billion
Year
ROE
ROA
TA/Equity
Equity/TA
ROE
ROA
TA/Equity
Equity/TA
1990
9.95%
0.78%
12.76
7.84%
6.68%
0.38%
17.58
5.69%
1995
13.48%
1.25%
10.78
9.27%
15.60%
1.10%
14.18
7.05%
2000
13.56%
1.28%
10.59
9.44%
14.42%
1.16%
12.43
8.04%
2001
12.24%
1.20%
10.20
9.80%
13.43%
1.13%
11.88
8.41%
2003
12.80%
1.27%
10.08
9.92%
16.37%
1.42%
11.53
8.67%
2006
12.20%
1.24%
9.84
10.16%
13.40%
1.35%
9.93
10.07%
2007
10.34%
1.06%
9.75
10.25%
9.22%
0.92%
10.02
9.98%
2008
3.68%
0.38%
9.68
10.32%
1.70%
0.16%
10.62
9.41%
2009
–0.15%
–0.01%
15.00
6.67%
1.44%
0.15%
9.71
10.29%
2010
3.35%
0.36%
9.31
10.75%
6.78%
0.75%
9.60
10.42%
2012
8.36%
0.78%
10.72
9.33%
8.97%
1.01%
8.88
11.26%
The growth in the equity to total assets ratio has occurred primarily because of the increased
profitability of the entire banking industry and (particularly during the financial crisis) the
3. What factors caused the decrease in loan volume relative to other assets on the balance
sheets of commercial banks? How has each of these factors been related to the change and
development of the financial services industry during the 1990s and 2000s? What strategic
changes have banks implemented to deal with changes in the financial services

Chapter 02 – Financial Services: Depository Institutions
2-4
Education.
4. What are the major uses of funds for commercial banks in the United States? What are the
primary risks to a bank caused by each of these? Which of the risks is most critical to the
continuing operation of a bank?
5. What are the major sources of funds for commercial banks in the United States? How is the
landscape for these funds changing and why?
6. What are the three major segments of deposit funding? How are these segments changing
over time? Why? What strategic impact do these changes have on the profitable operation
of a bank?
7. How does the liability maturity structure of a bank’s balance sheet compare with the
maturity structure of the asset portfolio? What risks are created or intensified by these
differences?
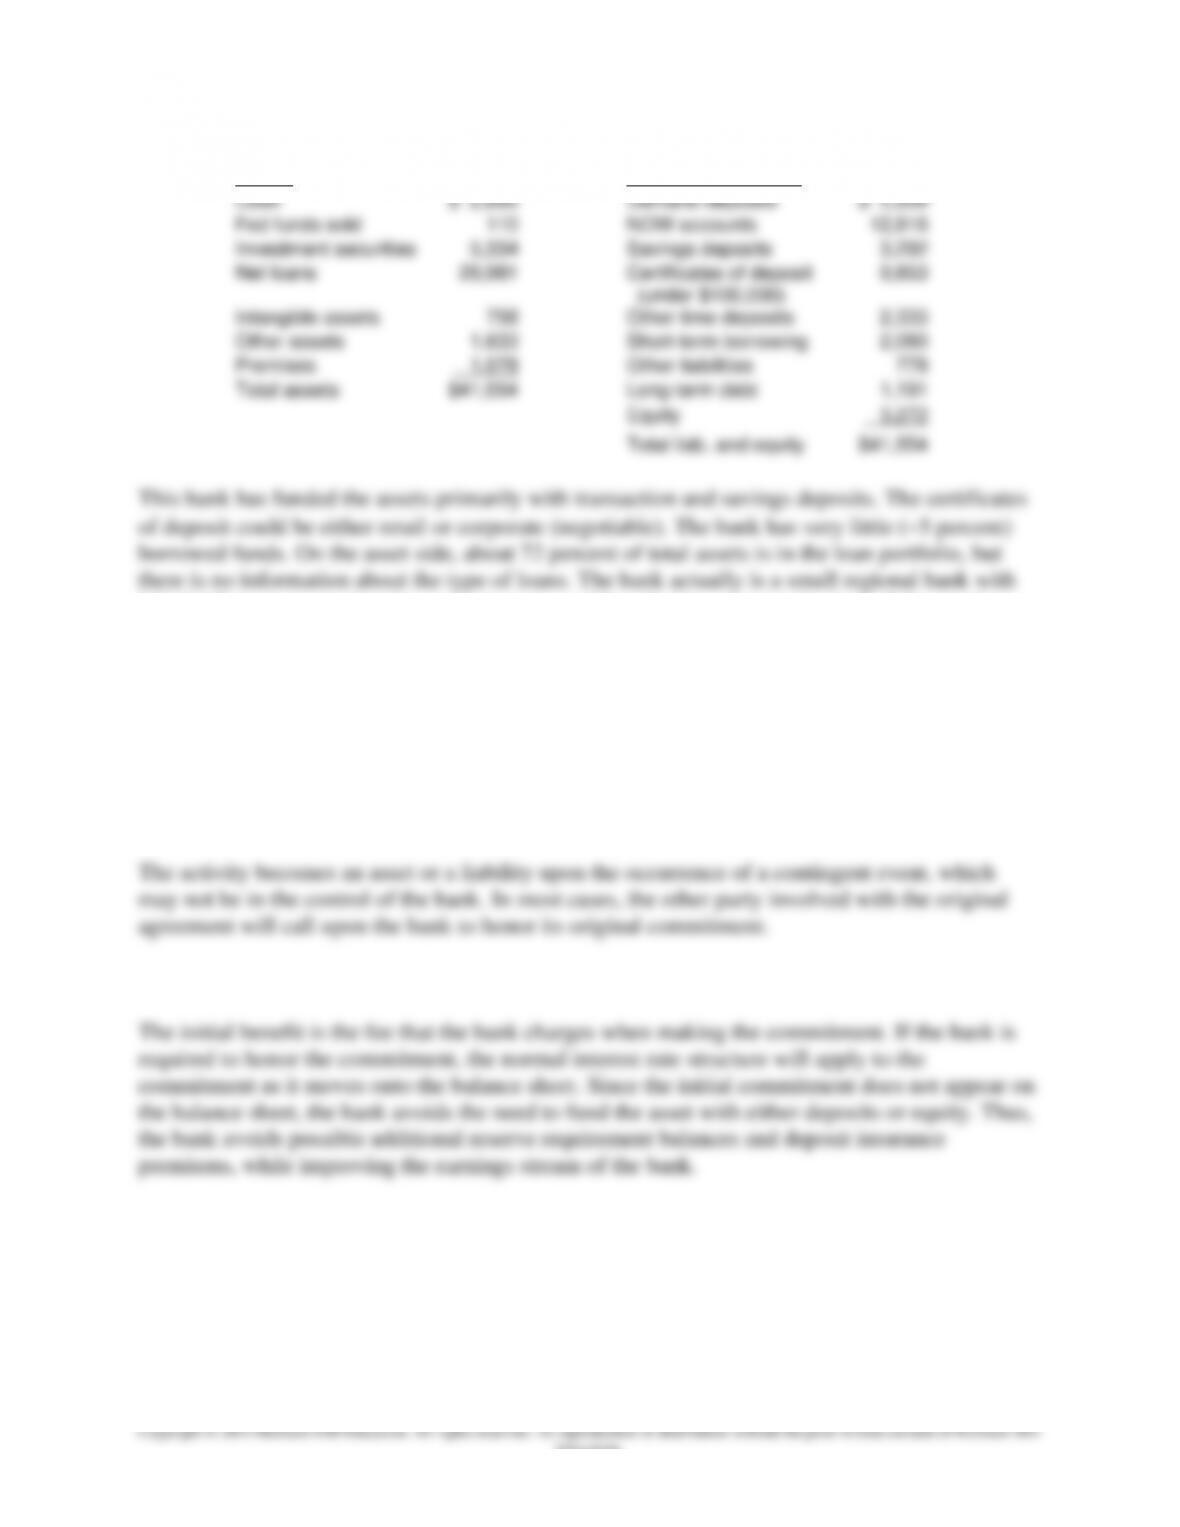
8. The following balance sheet accounts (in millions of dollars) have been taken from the
annual report for a U.S. bank. Arrange the accounts in balance sheet order and determine
the value of total assets. Based on the balance sheet structure, would you classify this bank
as a community bank, regional bank, or money center bank?
Chapter 02 – Financial Services: Depository Institutions
2-5
Education.
Assets
Liabilities and Equity
Cash
$ 2,660
Demand deposits
$ 5,939
Fed funds sold
110
NOW accounts
12,816
Investment securities
5,334
Savings deposits
3,292
Net loans
29,981
Certificates of deposit
(under $100,000)
9,853
Intangible assets
758
Other time deposits
2,333
Other assets
1,633
Short-term borrowing
2,080
Premises
1,078
Other liabilities
778
Total assets
$41,554
Long-term debt
1,191
Equity
3,272
Total liab. and equity
$41,554
This bank has funded the assets primarily with transaction and savings deposits. The certificates
of deposit could be either retail or corporate (negotiable). The bank has very little (5 percent)
borrowed funds. On the asset side, about 72 percent of total assets is in the loan portfolio, but
there is no information about the type of loans. The bank actually is a small regional bank with
$41.5 billion in assets, but the asset structure could easily be a community bank if the numbers
were denominated in millions, e.g., $41.5 million in assets.
9. What types of activities are normally classified as off-balance-sheet (OBS) activities?
Off-balance-sheet activities include the issuance of guarantees that may be called into play at a
future time, and the commitment to lend at a future time if the borrower desires.
a. How does an OBS activity move onto the balance sheet as an asset or liability?
b. What are the benefits of OBS activities to a bank?
c. What are the risks of OBS activities to a bank?
Chapter 02 – Financial Services: Depository Institutions
2-6
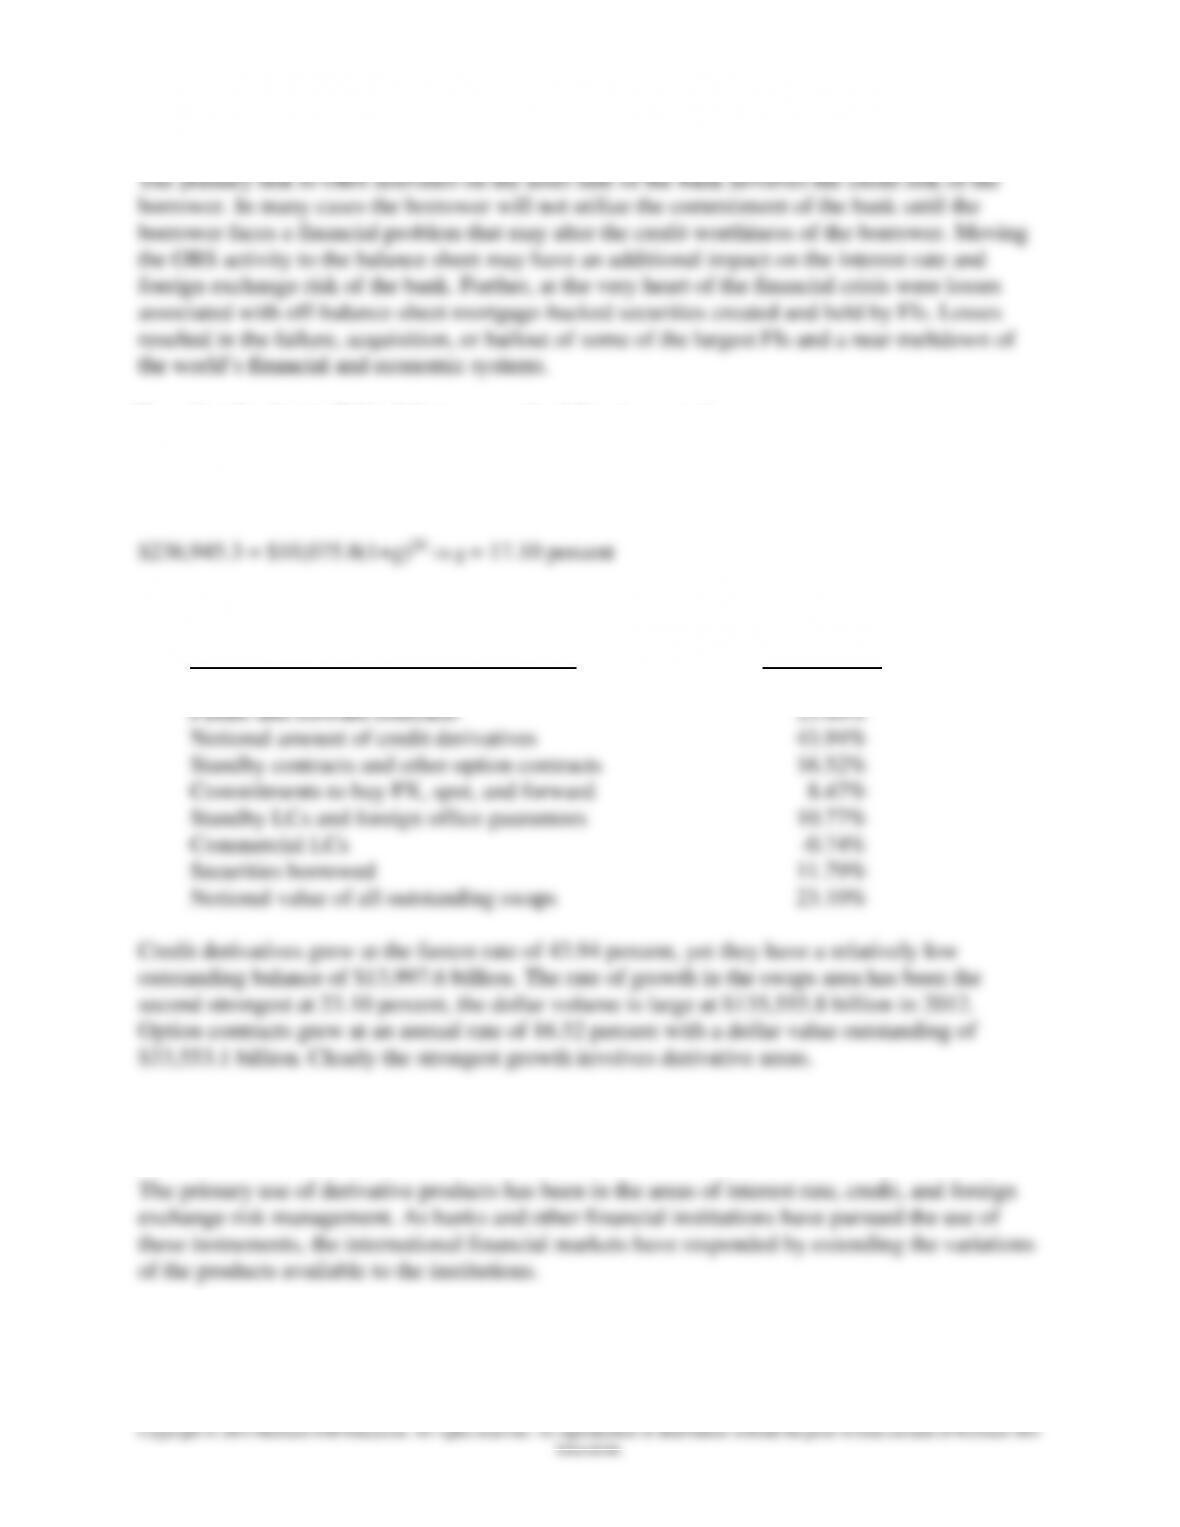
10. Use the data in Table 2-7 to answer the following questions.
a. What was the average annual growth rate in OBS total commitments over the period
from 1992-2012?
b. Which categories of contingencies have had the highest annual growth rates?
Category of Contingency or Commitment Growth Rate
Commitments to lend 7.33%
c. What factors are credited for the significant growth in derivative securities activities by
banks?

Chapter 02 – Financial Services: Depository Institutions
11. For each of the following banking organizations, identify which regulatory agencies (OCC,
FRB, FDIC, or state banking commission) may have some regulatory supervision
responsibility.
(a) State-chartered, nonmember, non-holding company bank.
Chapter 02 – Financial Services: Depository Institutions
2-8
14. What factors are given credit for the strong performance of commercial banks in the early
and mid-2000s?
The lowest interest rates in many decades helped bank performance on both sides of the balance
15. What factors are given credit for the weak performance of commercial banks in the late
2000s?
In the late 2000s, the U.S. economy experienced its strongest recession since the Great Depression.
2007. Total noninterest income was $25.6 billion (11 percent), lower as a result of the industry’s
first ever full-year trading loss ($1.8 billion), a $5.8 billion (27.4 percent) decline in securitization
income, and a $6.6 billion drop in proceeds from sales of loans, foreclosed properties, and other
assets. Net loan and lease charge-offs totaled $38.0 billion in the fourth quarter, an increase of
11th consecutive quarter.

Chapter 02 – Financial Services: Depository Institutions
2-9
Education.
16. How do the asset and liability structures of a savings institution compare with the asset and
liability structures of a commercial bank? How do these structural differences affect the
risks and operating performance of a savings institution? What is the QTL test?
The savings institution industry relies on mortgage loans and mortgage-backed securities as the
17. How do savings banks differ from savings associations? Differentiate in terms of risk,
operating performance, balance sheet structure, and regulatory responsibility.
18. What happened in 1979 to cause the failure of many savings institutions during the early
1980s? What was the effect of this change on the operating statements of savings
associations?
The Federal Reserve changed its reserve management policy to combat the effects of inflation, a
19. How did the two pieces of regulatory legislation─the DIDMCA in 1980 and the DIA in
1982─change the operating profitability of savings institutions in the early 1980s? What
Chapter 02 – Financial Services: Depository Institutions
2-10
The two pieces of legislation allowed savings institutions to offer new deposit accounts, such as
20. How did the Financial Institutions Reform, Recovery, and Enforcement Act (FIRREA) of
1989 and the Federal Deposit Insurance Corporation Improvement Act of 1991 reverse
some of the key features of earlier legislation?
FIRREA rescinded some of the expanded thrift lending powers of the DIDMCA of 1980 and the
Garn-St Germain Act of 1982 by instituting the qualified thrift lender (QTL) test that requires
21. What is the “common bond” membership qualification under which credit unions have
been formed and operated? How does this qualification affect the operational objective of a
credit union?

2-11
Education.
22. What are the operating advantages of credit unions that have caused concern among
commercial bankers? What has been the response of the Credit Union National Association
23. How does the asset structure of credit unions compare with the asset structure of
commercial banks and savings institutions? Refer to Tables 2-6, 2-10, and 2-13 to
formulate your answer.
24. Compare and contrast the performance of the worldwide depository institutions with those
of major foreign countries during the financial crisis.
Quickly after it hit the U.S., the financial crisis spread worldwide. As the crisis started, banks
worldwide saw losses driven by their portfolios of structured finance products and securitized

Chapter 02 – Financial Services: Depository Institutions
2-12
Education.
A number of European banks averted outright bankruptcy thanks to direct support from the
guaranteed deposits and debt of its six major financial institutions. Iceland rescued its third
largest bank with a $860 million purchase of 75 percent of the banks stock and a few days later
seized the country’s entire banking system. The Netherlands, Belgium, and Luxembourg central
governments together agreed to inject $16.37 billion into Fortis NV (Europe’s first ever cross–
border financial services company) to keep it afloat. However, five days later this deal fell apart,

Chapter 02 – Financial Services: Depository Institutions
2-13
the debt ridden country. Specifically, in March 2010 a plan led by Germany and France to bail
Moody’s Investors Service downgraded Greece’s debt rating and warned that additional cuts
could be on the way. Greece’s debt created heavy losses across the Greek banking sector. A run
on Greek banks ensued. Initially, between €100 and €500 million per day was being withdrawn
from Greek banks. At its peak, the run on Greek banks produced deposit withdrawals of as high
as €750 billion a day, nearly 0.5 percent of the entire €170 billion deposit base in the Greek
write downs on Greek loans. In 2011, Crédit Agricole reported a record quarterly net loss of
€3.07 billion ($4.06 billion U.S.) after a €220 million charge on its Greek debt. Great Britain’s
Royal Bank of Scotland revalued its Greek bonds at a 79 percent loss—or £1.1 billion ($1.7
billion U.S.)—for 2011. Germany’s Commerzbank’s fourth quarter 2011 earnings decreased by a
€700 million due to losses on Greek sovereign debt. The bank needed to find €5.3 billion euros
totaled $113.9 billion, to Portugal totaled $47.1 billion, and to Spain $187.5 billion. Worldwide,
bank exposure to these four countries totaled $2,512.3 billion. Default by small country like
Greece cascaded into something that threatened the world’s financial system.
Worried about the affect a Greek debt crisis might have on the European Union, other
European countries tried to step in and assist Greece. On May 9, 2010, in return for huge budget
the extent of these reforms and budget cuts led to worker strikes and protests (some of which
turned violent), as well as changes in Greek political leadership. In December 2011, the leaders
of France and Germany agreed on a new fiscal pact that they said would help prevent another
debt crisis. Then French President Nicolas Sarkozy outlined the basic elements of the plan to
increase budget discipline after meeting with German Chancellor Angela Merkel in Paris. The

2-14
Copyright © 2014 McGraw-Hill Education. All rights reserved. No reproduction or distribution without the prior written consent of McGraw-Hill
Education.
minus from selective default Tuesday. S&P cited a strong and clear commitment from members
of the euro zone to keep Greece in the common currency bloc as the main reason for the upgrade.
The questions and problems that follow refer to Appendix 2B.
25. The financial statements for First National Bank (FNB) are shown below:
Balance Sheet – First National Bank
Assets Liabilities and Equity
Cash $ 450 Demand deposits $ 5,510
Demand deposits from other FIs 1,350 Small time deposits 10,800
Investments 4,050 Jumbo CDs 3,200
Federal funds sold 2,025 Federal funds purchased 2,250
Loans 15,525 Equity 2,200
Reserve for loan losses (1,125)
Premises 1,685
Total assets $23,960 Total liabilities/equity $23,960
Income Statement – First National Bank
Interest Income $2,600
Interest expense 1,650
Provision for loan losses 180
Noninterest income 140
Noninterest expense 420
Taxes 90
a. Calculate the dollar value of FNB’s earning assets.
b. Calculate FNB’s ROA.
c. Calculate FNB’s asset utilization ratio.
d. Calculate FNB’s spread.

Chapter 02 – Financial Services: Depository Institutions
2-15
Education.
26. Megalopolis Bank has the following balance sheet and income statement.
Balance Sheet (in millions)
Assets Liabilities and Equity
Cash and due from banks $9,000 Demand deposits $19,000
Investment securities 23,000 NOW accounts 89,000
Repurchase agreements 42,000 Retail CDs 28,000
Loans 90,000 Debentures 19,000
Fixed Assets 15,000 Total liabilities $155,000
Other assets 4,000 Common stock 12,000
Total assets $183,000 Paid in capital 4,000
Retained earnings 12,000
Total liabilities and equity $183,000
Income Statement
Interest on fees and loans $9,000
Interest on investment securities 4,000
Interest on repurchase agreements 6,000
Interest on deposits in banks 1,000
Total interest income $20,000
Interest on deposits 9,000
Interest on debentures 2,000
Total interest expense $11,000
Operating income $9,000
Provision for loan losses 2,000
Other income 2,000
Other expenses 1,000
Income before taxes $8,000
Taxes 3,000
Net income $5,000
For Megalopolis, calculate:
a. Return on equity
b. Return on assets

Chapter 02 – Financial Services: Depository Institutions
2-16
c. Asset utilization
d. Equity multiplier
e. Profit margin
f. Interest expense ratio
g. Provision for loan loss ratio
h. Noninterest expense ratio
i. Tax ratio