
Chapter 11 – Credit Risk: Loan Portfolio and Concentration Risk
11-1
Solution for End-of-Chapter Questions and Problems: Chapter Eleven
1. How do loan portfolio risks differ from individual loan risks?
2. What is migration analysis? How do FIs use it to measure credit risk concentration? What
are its shortcomings?
3. What does loan concentration risk mean?
4. A manager decides not to lend to any firm in sectors that generate losses in excess of 5
percent of capital.
a. If the average historical losses in the automobile sector total 8 percent, what is the
maximum loan a manager can lend to firms in this sector as a percentage of total
capital?
b. If the average historical losses in the mining sector total 15 percent, what is the
maximum loan a manager can lend to firms in this sector as a percentage of total
capital?

Chapter 11 – Credit Risk: Loan Portfolio and Concentration Risk
11-2
5. An FI has set a maximum loss of 2 percent of total capital as a basis for setting
concentration limits on loans to individual firms. If it has set a concentration limit of 25
percent to a firm, what is the expected loss rate for that firm?
6. Explain how modern portfolio theory can be applied to lower the credit risk of an FI’s
portfolio.
The fundamental lesson of modern portfolio theory is that, to the extent that an FI manager holds
widely traded loans and bonds as assets, or can calculate loan or bond returns, portfolio
7. Suppose that an FI holds two loans with the following characteristics:
Loan i Xi Ri σi σi2 .
1 0.55 8% 8.55% 73.1025% ρ12 = 0.24
2 0.45 10 9.15 83.7225 σ12 = 18.7758
Calculate the return and risk of the portfolio.
The return on the loan portfolio is:
The risk of the portfolio is:

Chapter 11 – Credit Risk: Loan Portfolio and Concentration Risk
11-3
8. The Bank of Tinytown has two $20,000 loans that have the following characteristics. Loan
A has an expected return of 10 percent and a standard deviation of returns of 10 percent.
The expected return and standard deviation of returns for loan B are 12 percent and 20
percent, respectively.
a. If the correlation coefficient between loans A and B is 0.15, what are the expected
return and standard deviation of this portfolio?
b. What is the standard deviation of the portfolio if the correlation is -0.15?
c. What role does the covariance, or correlation, play in the risk reduction attributes of
modern portfolio theory?

Chapter 11 – Credit Risk: Loan Portfolio and Concentration Risk
11-4
9. Why is it difficult for small banks and thrifts to measure credit risk using modern portfolio
theory?
10. What is the minimum risk portfolio? Why is this portfolio usually not the portfolio chosen
by FIs to optimize the return-risk tradeoff?
11. The obvious benefit to holding a diversified portfolio of loans is to spread risk exposures so
that a single event does not result in a great loss to an FI. Are there any benefits to not
being diversified?
12. A bank vice president is attempting to rank, in terms of the risk-reward trade-off, the loan
portfolios of three loan officers. Information on the portfolios is noted below. How would
you rank the three portfolios?
Expected Standard
Portfolio Return Deviation
A 10% 8%
B 12% 9%
C 11% 10%
Portfolio B dominates portfolio C because B has a higher expected return and a lower standard
deviation. Thus, C is clearly inferior. A comparison of portfolios A and B represents a risk-return
trade-off in that B has a higher expected return, but B also has higher risk. A crude comparison
may use the coefficient of variation or the Sharpe measure, but a judgment regarding which
portfolio is “better” would be based on the risk preference of the vice president.

Chapter 11 – Credit Risk: Loan Portfolio and Concentration Risk
11-5
13. Suppose that an FI holds two loans with the following characteristics.
Annual
Spread between Loss to FI Expected
Loan Rate and FI’s Annual Given Default
Loan Xi Cost of Funds Fees Default Frequency
1 0.45 5.5% 2.25% 30% 3.5% ρ12 = -0.15
2 0.55 3.5 1.75 20 1.0
Calculate of the return and risk on the two-asset portfolio using Moody’s Analytics
Portfolio Manager.
The return and risk on loan 1 are:
14. CountrySide Bank uses the Moody’s Analytics Portfolio Manager model to evaluate the
risk-return characteristics of the loans in its portfolio. A specific $10 million loan earns 2
percent per year in fees and the loan is priced at a 4 percent spread over the cost of funds
for the bank. Because of collateral considerations, the loss to the bank if the borrower
defaults will be 20 percent of the loan’s face value. The expected probability of default is 3
percent. What is the anticipated return on this loan? What is the risk of the loan?

Chapter 11 – Credit Risk: Loan Portfolio and Concentration Risk
11-6
15. Suppose that an FI holds two loans with the following characteristics.
Annual
Spread between Loss to FI Expected
Loan Rate and FI’s Annual Given Default
Loan Xi Cost of Funds Fees Default Frequency
1 ? 4.0% 1.50% ?% 4.0% ρ12 = -0.10
2 ? 2.5 1.15 ? 1.5
The return on loan 1 is R1 = 6.25%, the risk on loan 2 is σ2 = 1.8233%, and the return of the
portfolio is Rp = 4.555%. Calculate of the loss given default on loans 1 and 2, the
proportions of loans 1 and 2 in the portfolio, and the risk of the portfolio, σp, using
Moody’s Analytics Portfolio Manager.
16. What databases are available that contain loan information at national and regional levels?
How can they be used to analyze credit concentration risk?

Chapter 11 – Credit Risk: Loan Portfolio and Concentration Risk
11-7
17. Information concerning the allocation of loan portfolios to different market sectors is given
below:
Allocation of Loan Portfolios in Different Sectors (%)
Sectors National Bank A Bank B
Commercial 30% 50% 10%
Consumer 40 30 40
Real Estate 30 20 50
Bank A and Bank B would like to estimate how much their portfolios deviate from the
national average.
a. Which bank is further away from the national average?
Using Xs to represent portfolio holdings:
Bank A Bank B
b. Is a large standard deviation necessarily bad for an FI using this model?
Chapter 11 – Credit Risk: Loan Portfolio and Concentration Risk
11-8
Education.
18. Assume that, on average, national banks engaged primarily in mortgage lending have their
assets diversified in the following proportions: 60 percent residential, 15 percent
commercial, 5 percent international, and 20 percent mortgage-backed securities. A local
bank has the following distribution of mortgage loans: 50 percent residential, 30 percent
commercial, and 20 percent international. How does the local bank differ from national
banks?
Using Xs to represent portfolio holdings:
19. Over the past 10 years, a bank has experienced the following loan losses on its C&I loans,
consumer loans, and total loan portfolio.
Year C&I Loans Consumer Loans Total Loans
2015 0.0080 0.0165 0.0075
2014 0.0088 0.0183 0.0085

Chapter 11 – Credit Risk: Loan Portfolio and Concentration Risk
11-9
Using regression analysis on these historical loan losses, the bank has estimated the
following:
XC = 0.002 + 0.8XL and Xh = 0.003 + 1.8XL
where XC = loss rate in the commercial sector, Xh = loss rate in the consumer (household)
sector, XL = loss rate for its total loan portfolio.
a. If the bank’s total loan loss rates increase by 10 percent, what are the expected loss rate
increases in the commercial and consumer sectors?
b. In which sector should the bank limit its loans and why?
20. What reasons did the Federal Reserve Board offer for recommending the use of subjective
evaluations of credit concentration risk instead of quantitative models? How did this
change in 2006?

Chapter 11 – Credit Risk: Loan Portfolio and Concentration Risk
11–10
Education.
21. What rules on credit concentrations has the National Association of Insurance
Commissioners enacted? How are they related to modern portfolio theory?
The NAIC set a maximum limit of 3% that life insurers can hold in securities belonging to a
22. An FI is limited to holding no more than 8 percent of its assets in securities of a single
issuer. What is the minimum number of securities it should hold to meet this requirement?
What if the requirements are 2 percent, 4 percent, and 7 percent?
23. From Table 11A-1, what is the probability of a loan upgrade? A loan downgrade?
The probability of an upgrade is 5.95% + 0.33% + 0.02% = 6.30%. The probability of a
downgrade is 5.30% + 1.17% + 0.12% = 6.59%.
a. What is the impact of a rating upgrade or downgrade?
b. How is the discount rate determined after a credit event has occurred?

Chapter 11 – Credit Risk: Loan Portfolio and Concentration Risk
11–11
c. Why does the probability distribution of possible loan values have a negative skew?
d. How do the capital requirements of the CreditMetrics approach differ from those of the
BIS and Federal Reserve System?
24 A five-year fixed-rate loan of $100 million carries a 7 percent annual interest rate. The
borrower is rated BB. Based on hypothetical historical data, the probability distribution
given below has been determined for various ratings upgrades, downgrades, status quo, and
default possibilities over the next year. Information also is presented reflecting the forward
rates of the current Treasury yield curve and the annual credit spreads of the various
maturities of BBB bonds over Treasuries.
New Loan
Probability Value plus Forward Rate Spreads at Time t
Rating Distribution Coupon $ t rt% ϕt% .
AAA 0.01% $114.82m 1 3.00% 0.72%
AA 0.31 114.60m 2 3.40 0.96
A 1.45 114.03m 3 3.75 1.16
BBB 6.05 4 4.00 1.30
BB 85.48 108.55m
B 5.60 98.43m
CCC 0.90 86.82m
Default 0.20 54.12m
a. What is the present value of the loan at the end of the one-year risk horizon for the case
where the borrower has been upgraded from BB to BBB?
)0530.1(
)0491.1(
)0436.1(
0372.1
b. What is the mean (expected) value of the loan at the end of year 1?
c. What is the volatility of the loan value at the end of year 1?
Chapter 11 – Credit Risk: Loan Portfolio and Concentration Risk
11–12
Copyright © 2014 McGraw-Hill Education. All rights reserved. No reproduction or distribution without the prior written consent of McGraw-Hill
Education.
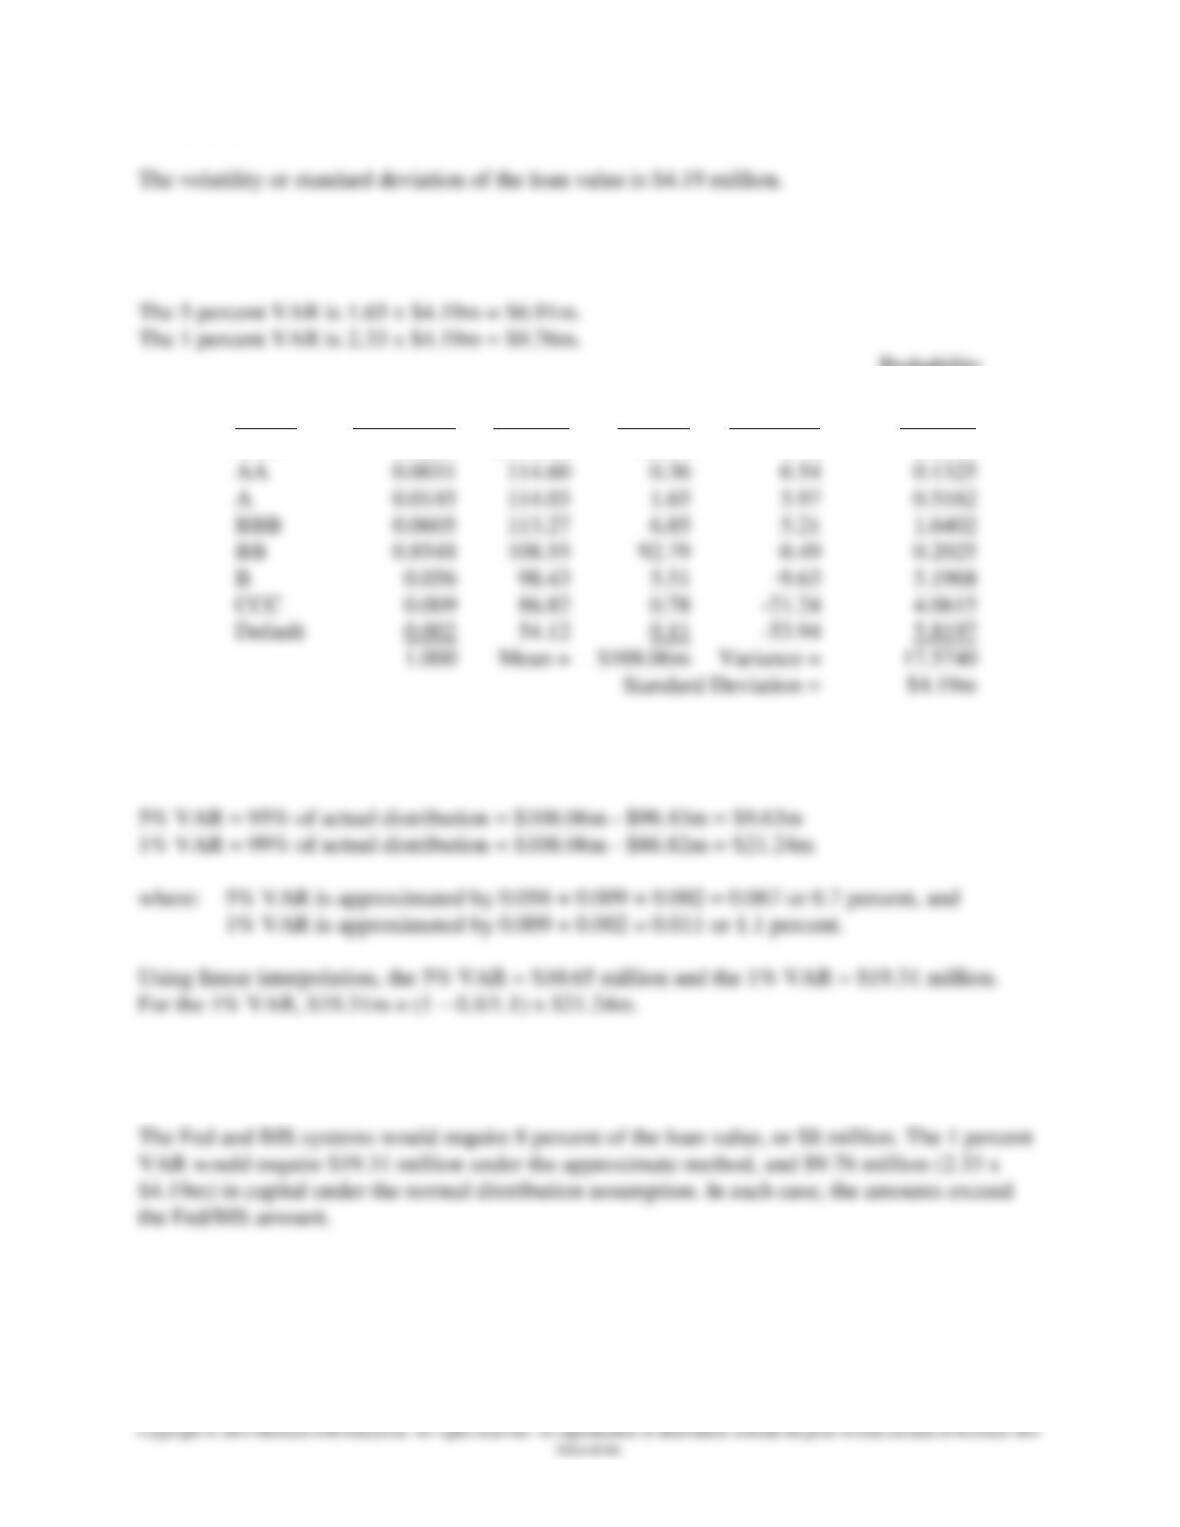
The volatility or standard deviation of the loan value is $4.19 million.
d. Calculate the 5 percent and 1 percent VARs for this loan assuming a normal
distribution of values.
Probability
Year-end
Value
Probability
x Deviation
Rating
Probability
(m of $)
x Value
Deviation
Squared
AAA
0.0001
$114.82
$0.01
6.76
0.0046
AA
0.0031
114.60
0.36
6.54
0.1325
A
0.0145
114.03
1.65
5.97
0.5162
BBB
0.0605
113.27
6.85
5.21
1.6402
BB
0.8548
108.55
92.79
0.49
0.2025
B
0.056
98.43
5.51
-9.63
5.1968
CCC
0.009
86.82
0.78
-21.24
4.0615
Default
0.002
54.12
0.11
-53.94
5.8197
1.000
Mean =
$108.06m
Variance =
17.5740
Standard Deviation =
$4.19m
e. Estimate the approximate 5 percent and 1 percent VARs using the actual distribution of
loan values and probabilities.
f. How do the capital requirements of the 1 percent VARs calculated in parts (d) and (e)
above compare with the capital requirements of the BIS and Federal Reserve System?

Chapter 11 – Credit Risk: Loan Portfolio and Concentration Risk
11–13
Education.
25. How does the Credit Risk+ model of Credit Suisse Financial Products differ from the
CreditMetrics model of J.P. Morgan Chase?
26. An FI has a loan portfolio of 10,000 loans of $10,000 each. The loans have a historical
average default rate of 4 percent and the severity of loss is 40 cents per dollar.
a. Over the next year, what are the probabilities of having default rates of 2, 3, 4, 5, and 8
b. What would be the dollar loss on the portfolios with default rates of 4 and 8 percent?
c. How much capital would need to be reserved to meet the 1 percent worst-case loss
scenario? What proportion of the portfolio’s value would this capital reserve be?

Chapter 11 – Credit Risk: Loan Portfolio and Concentration Risk
11–14
Integrated Mini Case: Loan Portfolio Analysis
As a senior loan officer at MC Financial Corp, you have a loan application from a firm in the
biotech industry. While the loan has been approved on the basis of an individual loan, you must
evaluate the loan based on its impact on the risk of the overall loan portfolio. The FI uses the
following three methods to assess its loan portfolio risk.
1. Concentration Limits – The FI currently has lent an amount equal to 40 percent of its capital
to the biotech industry and does not lend to a firm in any sector that generates losses in excess
of 2 percent of capital. The average historical losses in the biotech industry total 5 percent.
2. Loan Volume-based Model – National and MC Financial’s loan portfolio allocations are as
follows.
Allocation of Loan Portfolios in Different Sectors (%)
Sectors National MC Financial
Commercial 30% 40%
Real Estate 50% 45%
Consumer 20% 15%
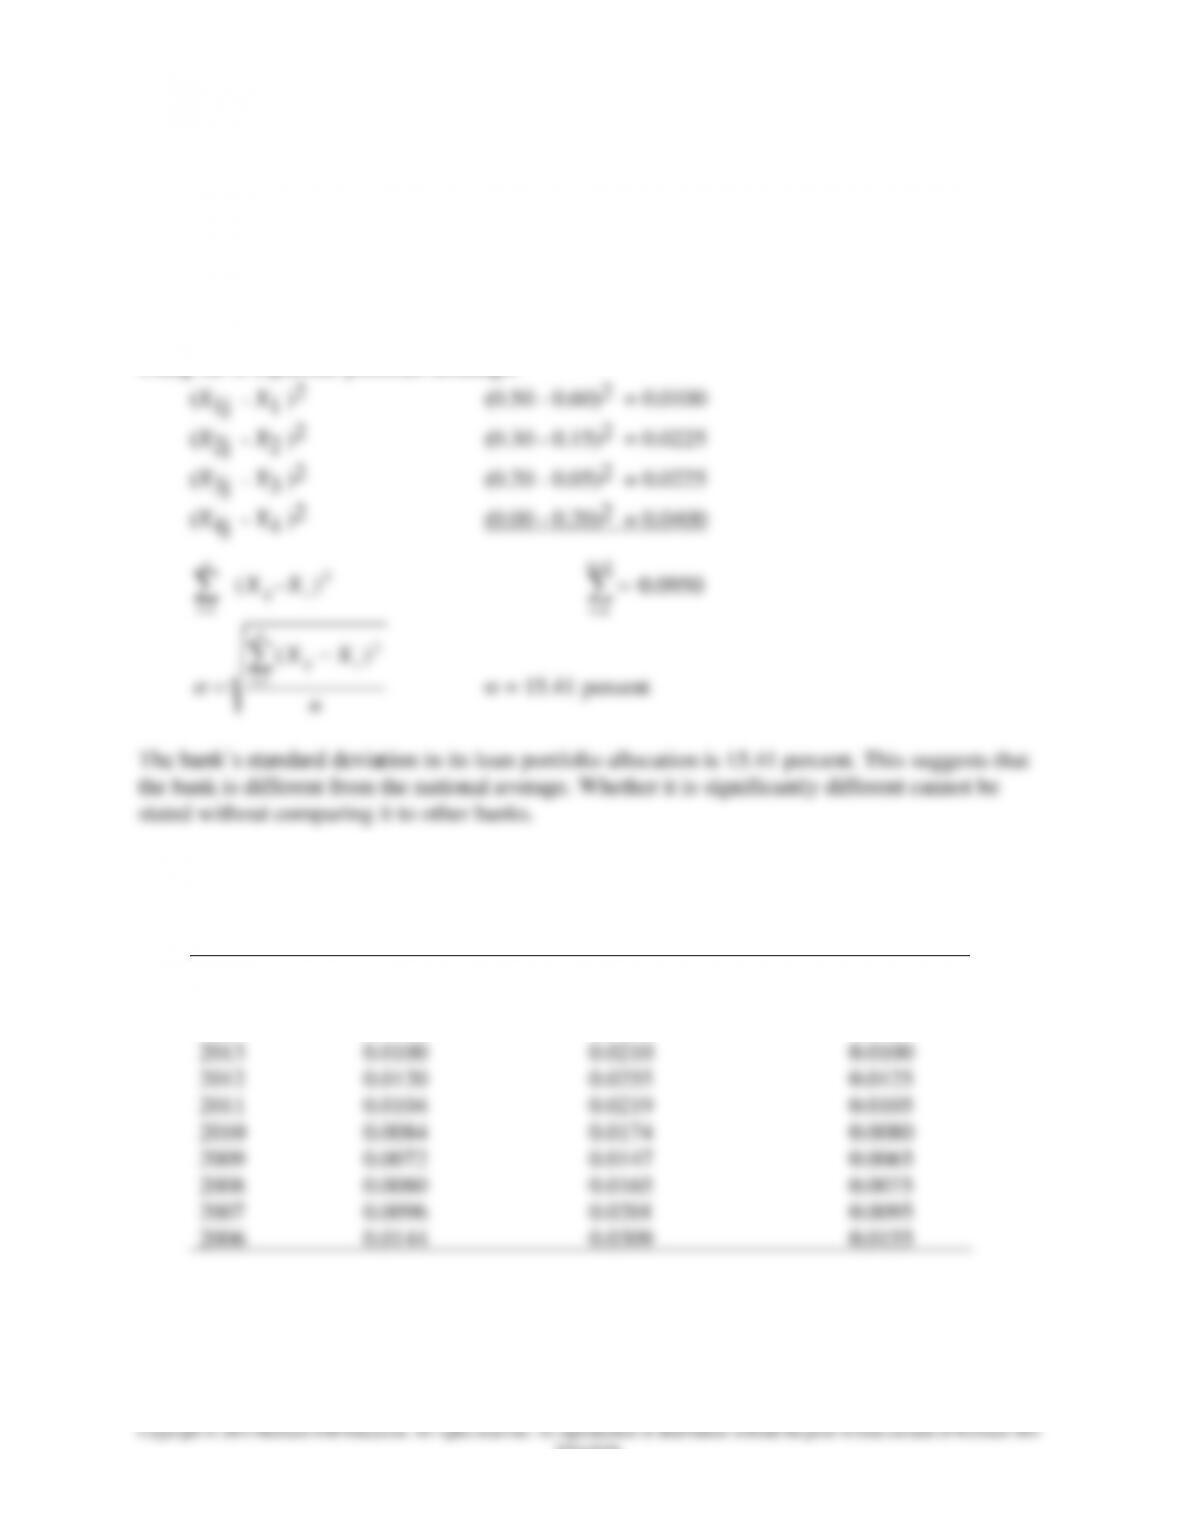
MC Financial does not want to deviate from the national average by more than 12.25 percent.
Using Xs to represent portfolio holdings:
(X1j – X1 )2 (0.40 – 0.30)2 = 0.0100

Chapter 11 – Credit Risk: Loan Portfolio and Concentration Risk
11–15
Education.
3. Loan Loss Ratio-based Model – Based on regression analysis on historical loan losses, the FI
estimates the following loan loss ratio models:
XC&I = 0.001 + 0.85XL and Xcon = 0.003 + 0.65XL
where XC&I = loss rate in the commercial sector, Xcon = loss rate in the consumer
(household) sector, XL = loss rate for its total loan portfolio.
MC Financial’s total increase in the loan loss ratio is expected to be 12 percent next year.
Should MC Financial Corp. grant this loan?

Chapter 11 – Credit Risk: Loan Portfolio and Concentration Risk
11–16
Additional Example for Chapter 12
Allocation of Loan Portfolios in Different Sectors (%)
Sectors National Bank A Bank B
Commercial 20% 50% 30%
Consumer 40% 20% 40%
Real Estate 40% 30% 30%
How different are Banks A and B from the national benchmark? When using this example, note
that there is an implied assumption that Bank A and B belong to a certain size class or have some
common denominator linking them to the national benchmark. If that is the case, then the
solution is to estimate the standard deviation.
We use Xs to represent the portfolio concentrations. X1, X2 and X3 are the national benchmark
percentages
Bank A Bank B
(X1j – X1 )2 (50 – 20)2 = 900 (30 – 20)2 = 100