Chapter 06 – Efficient Diversification
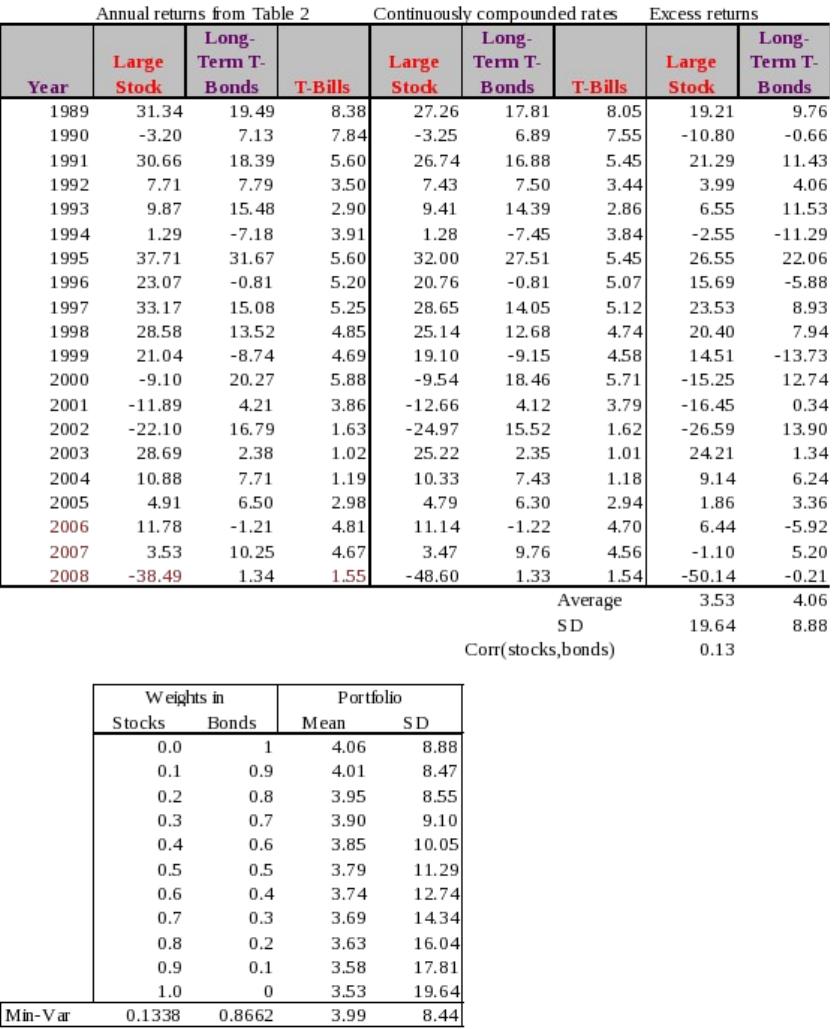
The bond portfolio is less risky as represented by its lower standard deviation. Yet, as the
portfolio table shows, mixing .87% of bonds with 13% stocks would have produced a portfolio
less risky than bonds. In this sample of these 20 years, the average return on the less risky
portfolio of bonds was higher than that of the riskier portfolio of stocks. This is exactly what is
meant by “risk.” Expectation will not always be realized.
6-1
© 2013 by McGraw-Hill Education. This is proprietary material solely for authorized instructor use. Not authorized for sale or
distribution in any manner. This document may not be copied, scanned, duplicated, forwarded, distributed, or posted on a website, in
whole or part.
Chapter 06 – Efficient Diversification
1. If the lending and borrowing rates are equal and there are no other constraints on portfolio
choice, then the optimal risky portfolios of all investors will be identical. However, if the
2. No, it is not possible to get such a diagram. Even if the correlation between A and B were 1.0,
3. In the special case that all assets are perfectly positively correlated, the portfolio standard
deviation is equal to the weighted average of the component-asset standard deviations.
4. The probability distribution is:
Probability Rate of Return
.7 100%
.3 -50%
= 0.6874 or 68.74%
5. The expected rate of return on the stock will change by beta times the unanticipated change in
the market return: 1.2 ( .08 – .10) = –2.4%
6.
a. The risk of the diversified portfolio consists primarily of systematic risk. Beta measures
systematic risk, which is the slope of the security characteristic line (SCL). The two figures
b. The undiversified investor is exposed primarily to firm-specific risk. Stock A has
higher firm-specific risk because the deviations of the observations from the SCL are
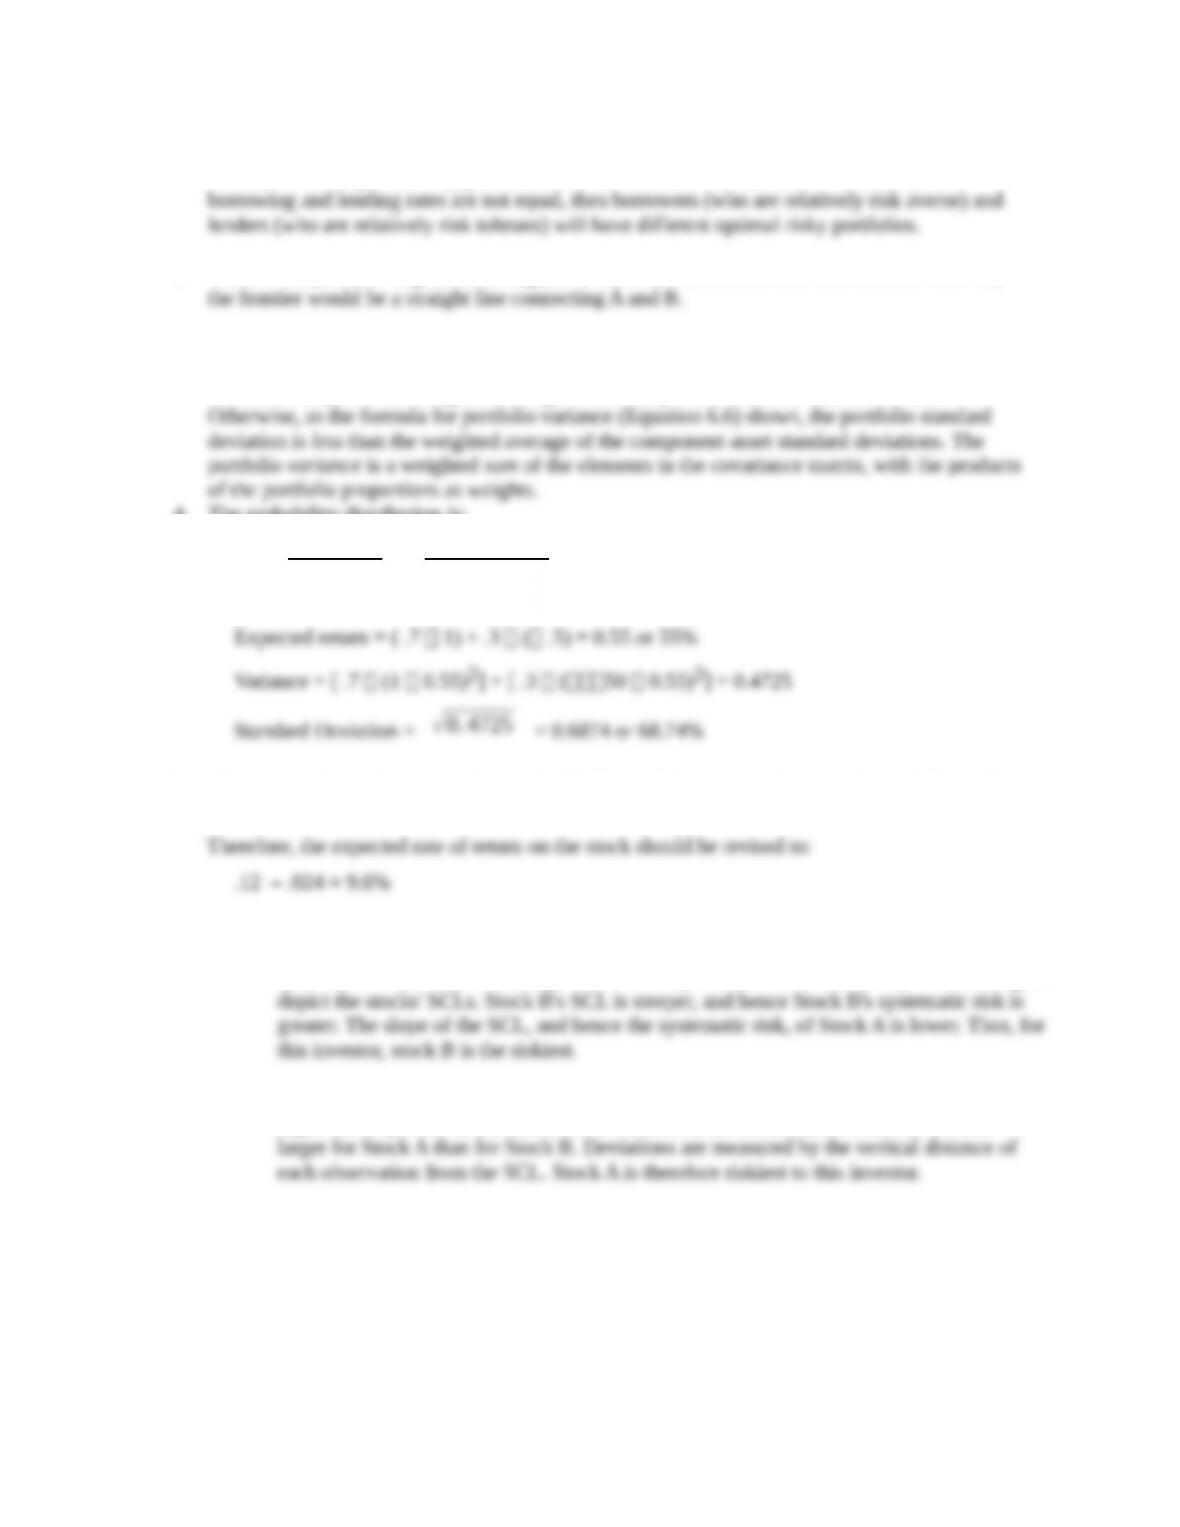
7.Using “Regression” command from Excel’s Data Analysis menu, we can run a regression of
GM’s excess returns against those of S&P 500, and obtain the following data. The Beta of GM
is .87.
6-2
© 2013 by McGraw-Hill Education. This is proprietary material solely for authorized instructor use. Not authorized for sale or
distribution in any manner. This document may not be copied, scanned, duplicated, forwarded, distributed, or posted on a website, in
whole or part.
Chapter 06 – Efficient Diversification
8. A scatter plot results in the following diagram. The slope of the regression line is 2.0 and
intercept is 1.0.
y = 1.0 + 2.0 x
-2
-1
0
1
2
3
4
-1 -0.5 0 0.5 1
Market Return, Percent
Generic
Return,
Percent
9.
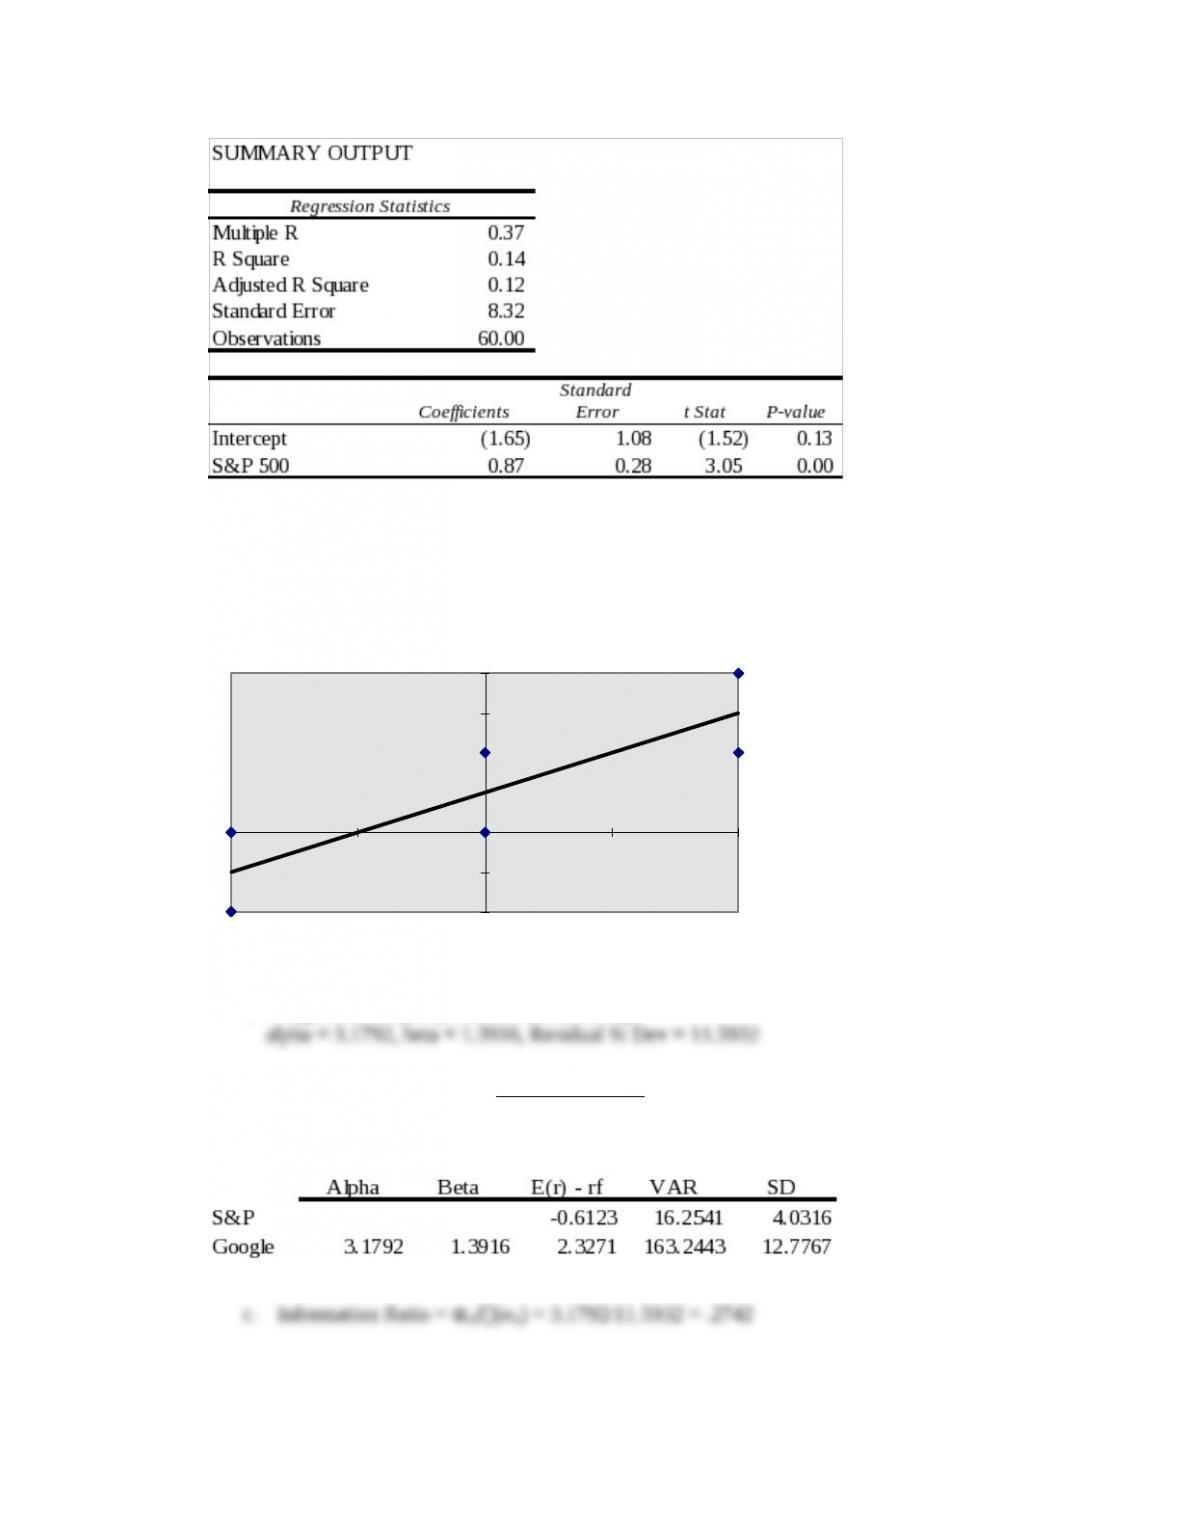
a. Regression output produces the following:
b. Sharpe Ratio of S&P =
E( rS&P) - r f
S &P
= – .6123/4.0316 = – .1519
6-3
© 2013 by McGraw-Hill Education. This is proprietary material solely for authorized instructor use. Not authorized for sale or
distribution in any manner. This document may not be copied, scanned, duplicated, forwarded, distributed, or posted on a website, in
whole or part.
Chapter 06 – Efficient Diversification
d. We use Equation 6.16 to compute
wG
O
wG
O
=
α G / 2 (e G )
R S&P / 2 S&P
=
3.1792/ (11 .59 32 2)
– .6123/(4.0316 2 )
= –62.79%
wG
O
e. SO =
√
(
αG
(e G )
)
2
+ ( SM )2
=
√
(
3.1 792
1 1. 5932
)
2
+ (– .1519 )2
= .3135
CFA 1
Answer:
CFA 2
Answer:
Fund D represents the single best addition to complement Stephenson’s current portfolio, given
his selection criteria. First, Fund D’s expected return (14.0 percent) has the potential to increase
6-4
© 2013 by McGraw-Hill Education. This is proprietary material solely for authorized instructor use. Not authorized for sale or
distribution in any manner. This document may not be copied, scanned, duplicated, forwarded, distributed, or posted on a website, in
whole or part.
Chapter 06 – Efficient Diversification
The other three funds have shortcomings in terms of either expected return enhancement or
volatility reduction through diversification benefits. Fund A offers the potential for increasing
the portfolio’s return, but is too highly correlated to provide substantial volatility reduction
CFA 3
Answer:
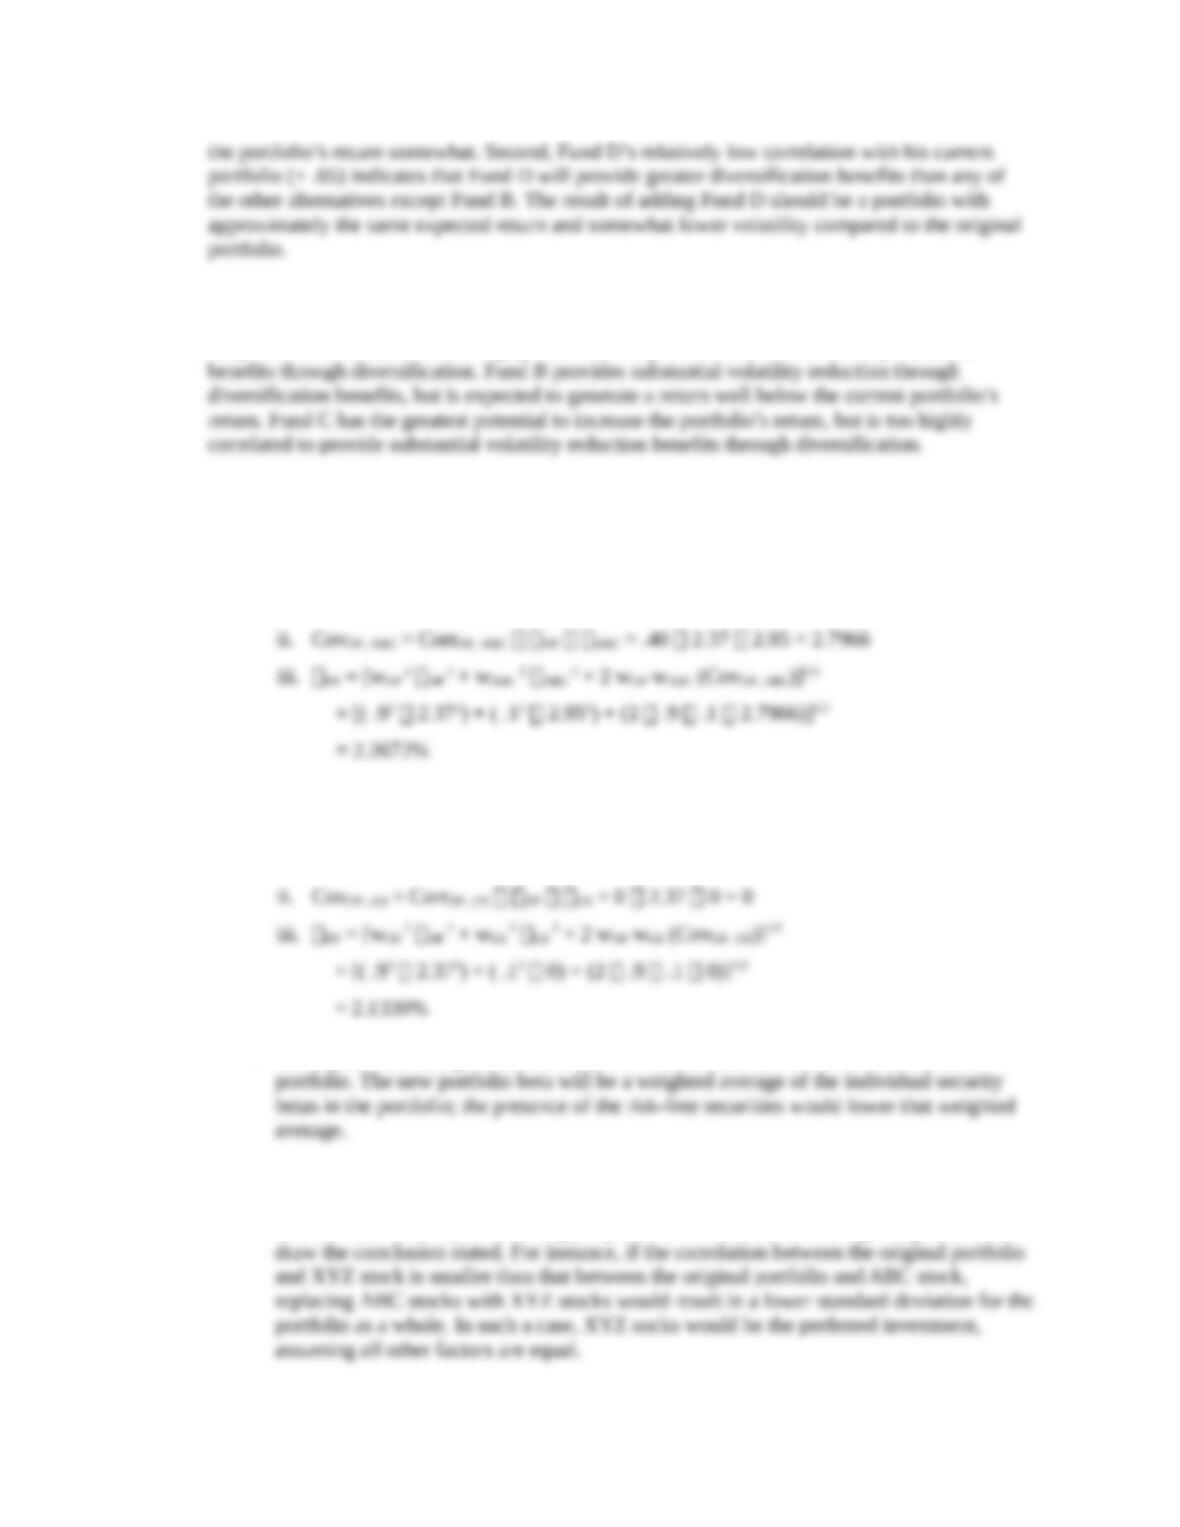
a. Subscript OP refers to the original portfolio, ABC to the new stock, and NP to the
new portfolio.
i. E(rNP) = wOP E(rOP ) + wABC E(rABC ) = ( .9 .67) + ( .1 1.25) = .7280%
b. Subscript OP refers to the original portfolio, GS to government securities, and NP to the
new portfolio.
i. E(rNP) = wOP E(rOP ) + wGS E(rGS ) = ( .9 .67) + ( .1 .42) = .6450%
c. Adding the risk-free government securities would result in a lower beta for the new
d. The comment is not correct. Although the respective standard deviations and expected
returns for the two securities under consideration are identical, the identical coefficients
between each security and the original portfolio are unknown, making it impossible to
6-5
© 2013 by McGraw-Hill Education. This is proprietary material solely for authorized instructor use. Not authorized for sale or
distribution in any manner. This document may not be copied, scanned, duplicated, forwarded, distributed, or posted on a website, in
whole or part.
Chapter 06 – Efficient Diversification
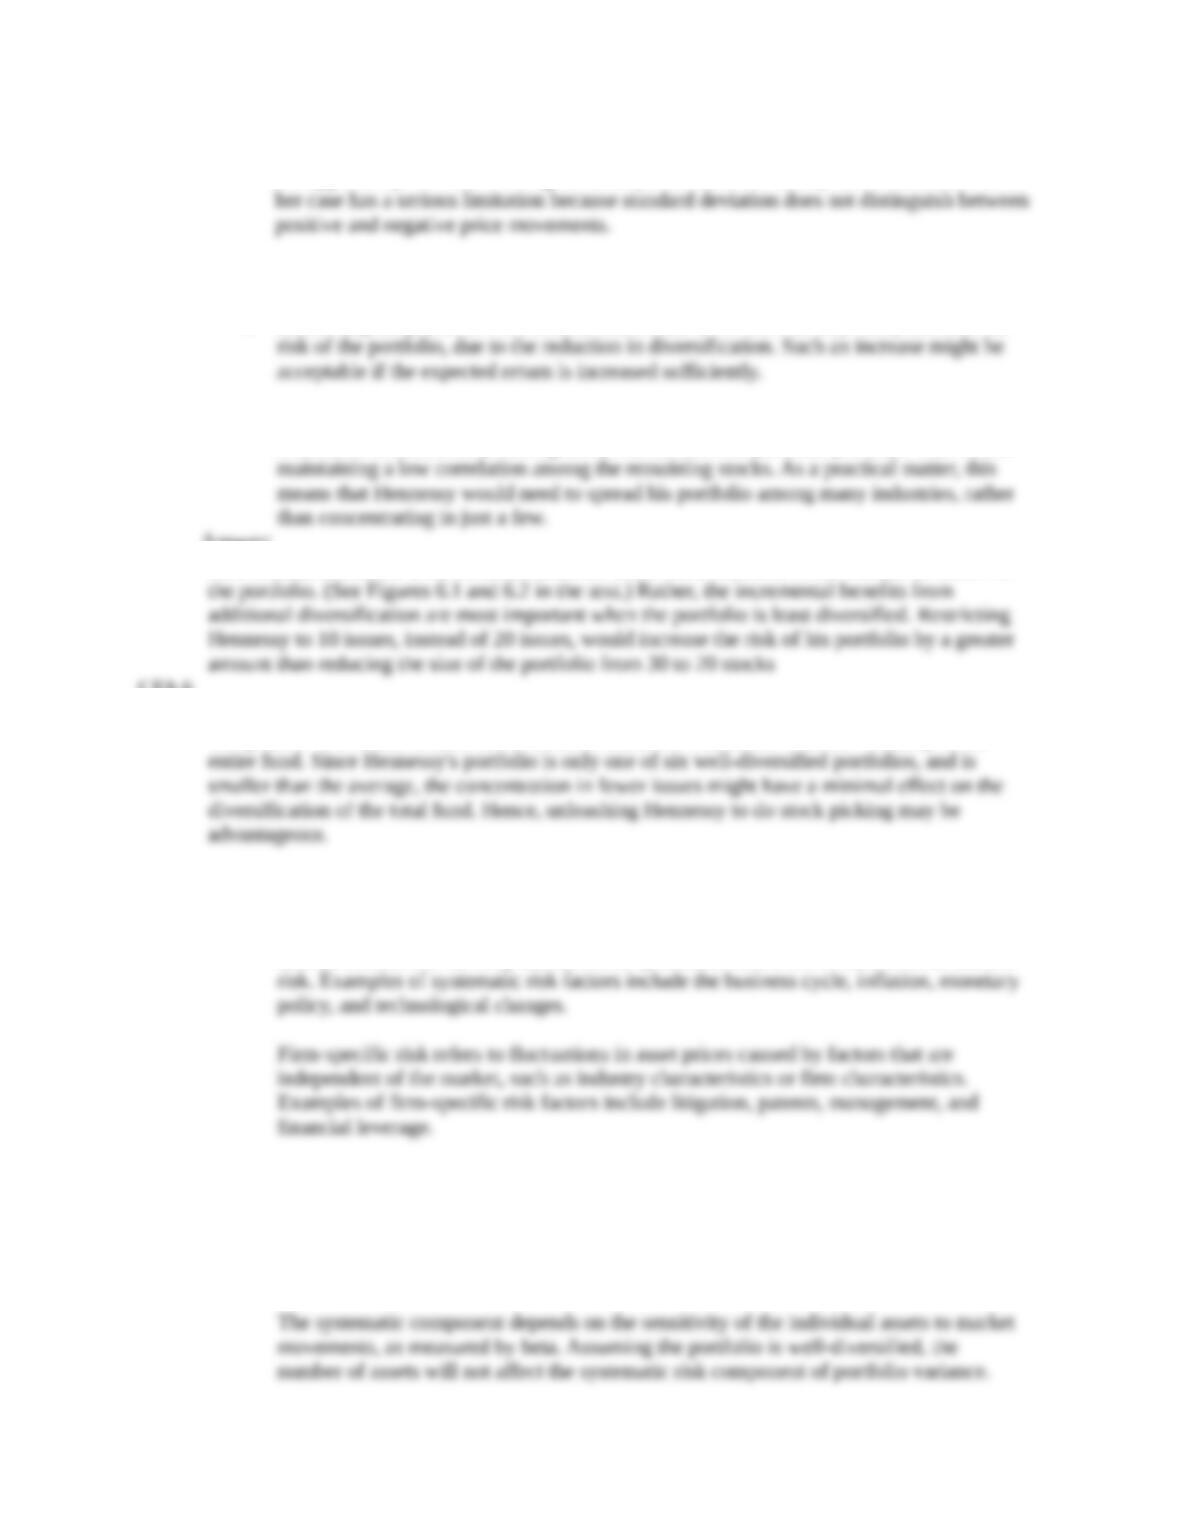
e. Grace clearly expressed the sentiment that the risk of loss was more important to her than
the opportunity for return. Using variance (or standard deviation) as a measure of risk in
CFA 4
Answer:
a. Restricting the portfolio to 20 stocks, rather than 40 to 50, will very likely increase the
b. Hennessy could contain the increase in risk by making sure that he maintains
reasonable diversification among the 20 stocks that remain in his portfolio. This entails
Answer:
Risk reduction benefits from diversification are not a linear function of the number of issues in
CFA 6
Answer:
The point is well taken because the committee should be concerned with the volatility of the
CFA 7
Answer:
a. Systematic risk refers to fluctuations in asset prices caused by macroeconomic factors
that are common to all risky assets; hence systematic risk is often referred to as market
b. Trudy should explain to the client that picking only the five best ideas would most
likely result in the client holding a much more risky portfolio. The total risk of a
portfolio, or portfolio variance, is the combination of systematic risk and firm-specific
risk.
6-6
© 2013 by McGraw-Hill Education. This is proprietary material solely for authorized instructor use. Not authorized for sale or
distribution in any manner. This document may not be copied, scanned, duplicated, forwarded, distributed, or posted on a website, in
whole or part.
Chapter 06 – Efficient Diversification
6-7
© 2013 by McGraw-Hill Education. This is proprietary material solely for authorized instructor use. Not authorized for sale or
distribution in any manner. This document may not be copied, scanned, duplicated, forwarded, distributed, or posted on a website, in
whole or part.