Chapter 05 – Risk and Return: Past and Prologue
CHAPTER 05
RISK AND RETURN: PAST AND PROLOGUE
1. The 1% VaR will be less than –30%. As percentile or probability of a return declines so does
2. The geometric return represents a compounding growth number and will artificially inflate the
3. No. Since all items are presented in nominal figures, the input should also use nominal data.
4. Decrease. Typically, standard deviation exceeds return. Thus, an underestimation of 4% in each
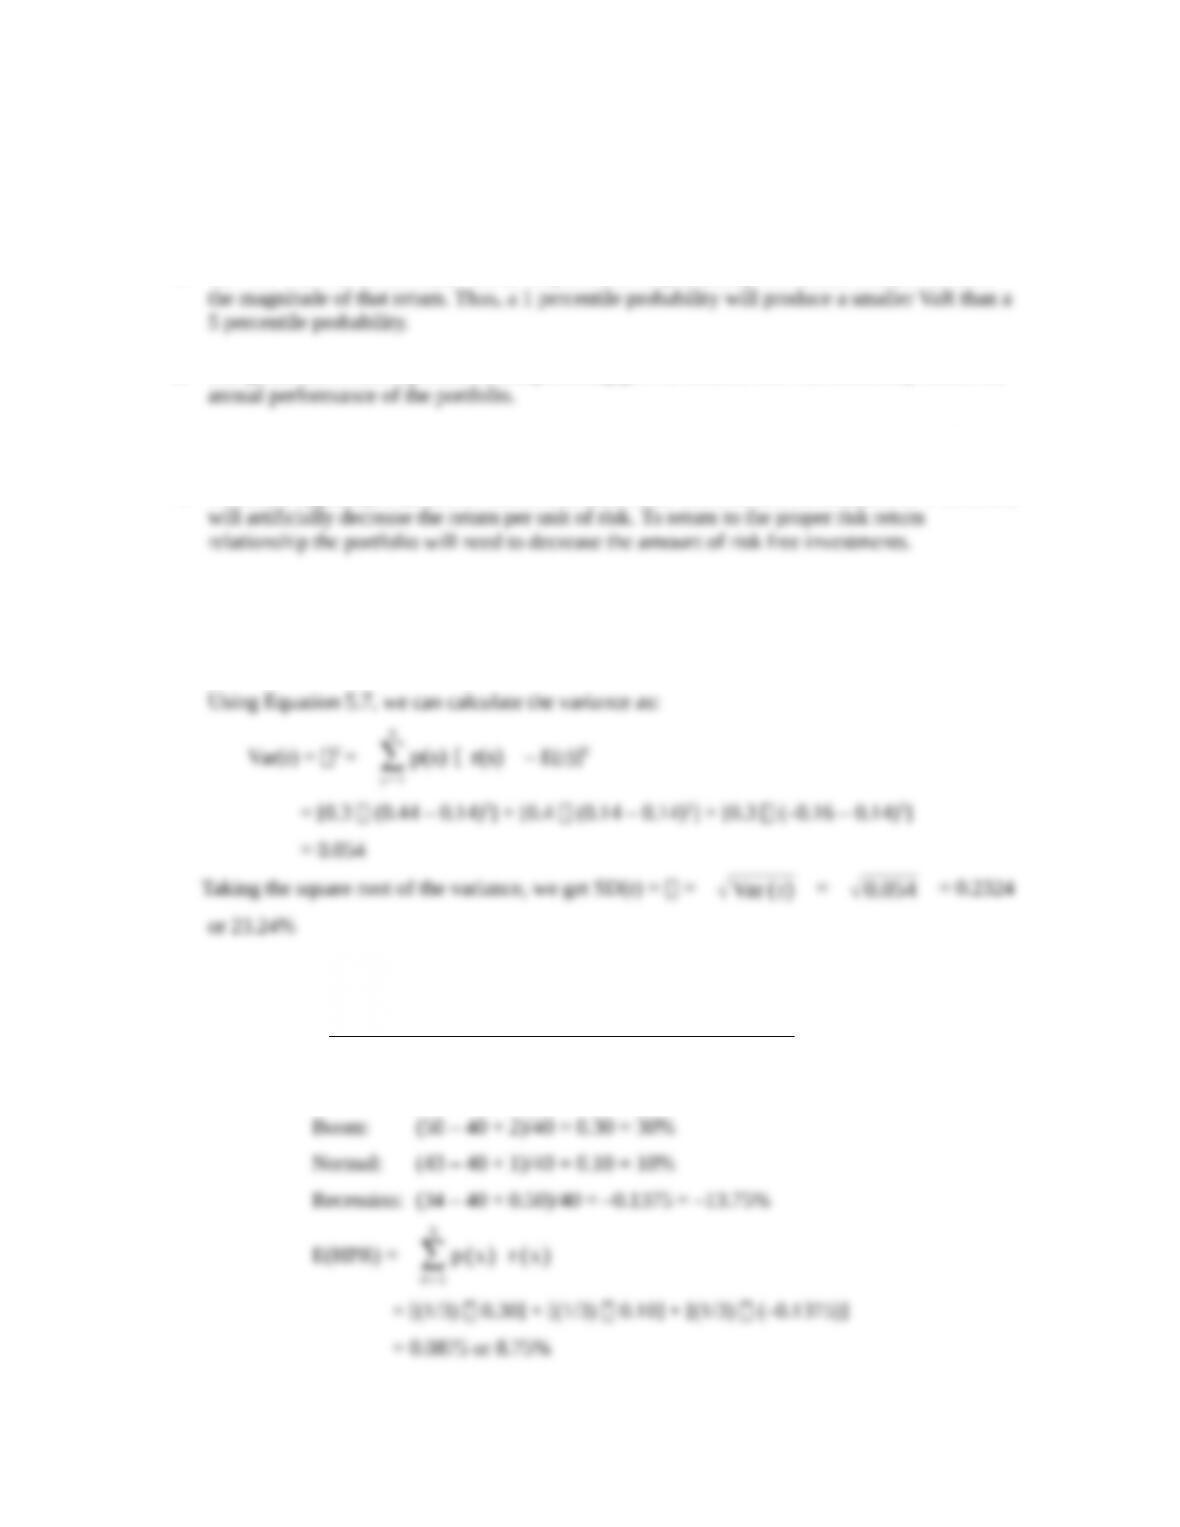
5. Using Equation 5.6, we can calculate the mean of the HPR as:
E(r) =
∑
s=1
S
p (s) r ( s)
= (0.3 0.44) + (0.4 0.14) + [0.3 (–0.16)] = 0.14 or 14%
6. We use the below equation to calculate the holding period return of each scenario:
HPR =
Ending Price - Beginning Price + Cash Dividend
Be ginning Price
a. The holding period returns for the three scenarios are:
5-1
© 2013 by McGraw-Hill Education. This is proprietary material solely for authorized instructor use. Not authorized for sale or
distribution in any manner. This document may not be copied, scanned, duplicated, forwarded, distributed, or posted on a website, in
whole or part.
Chapter 05 – Risk and Return: Past and Prologue
S
√
Var ( r)
79.319
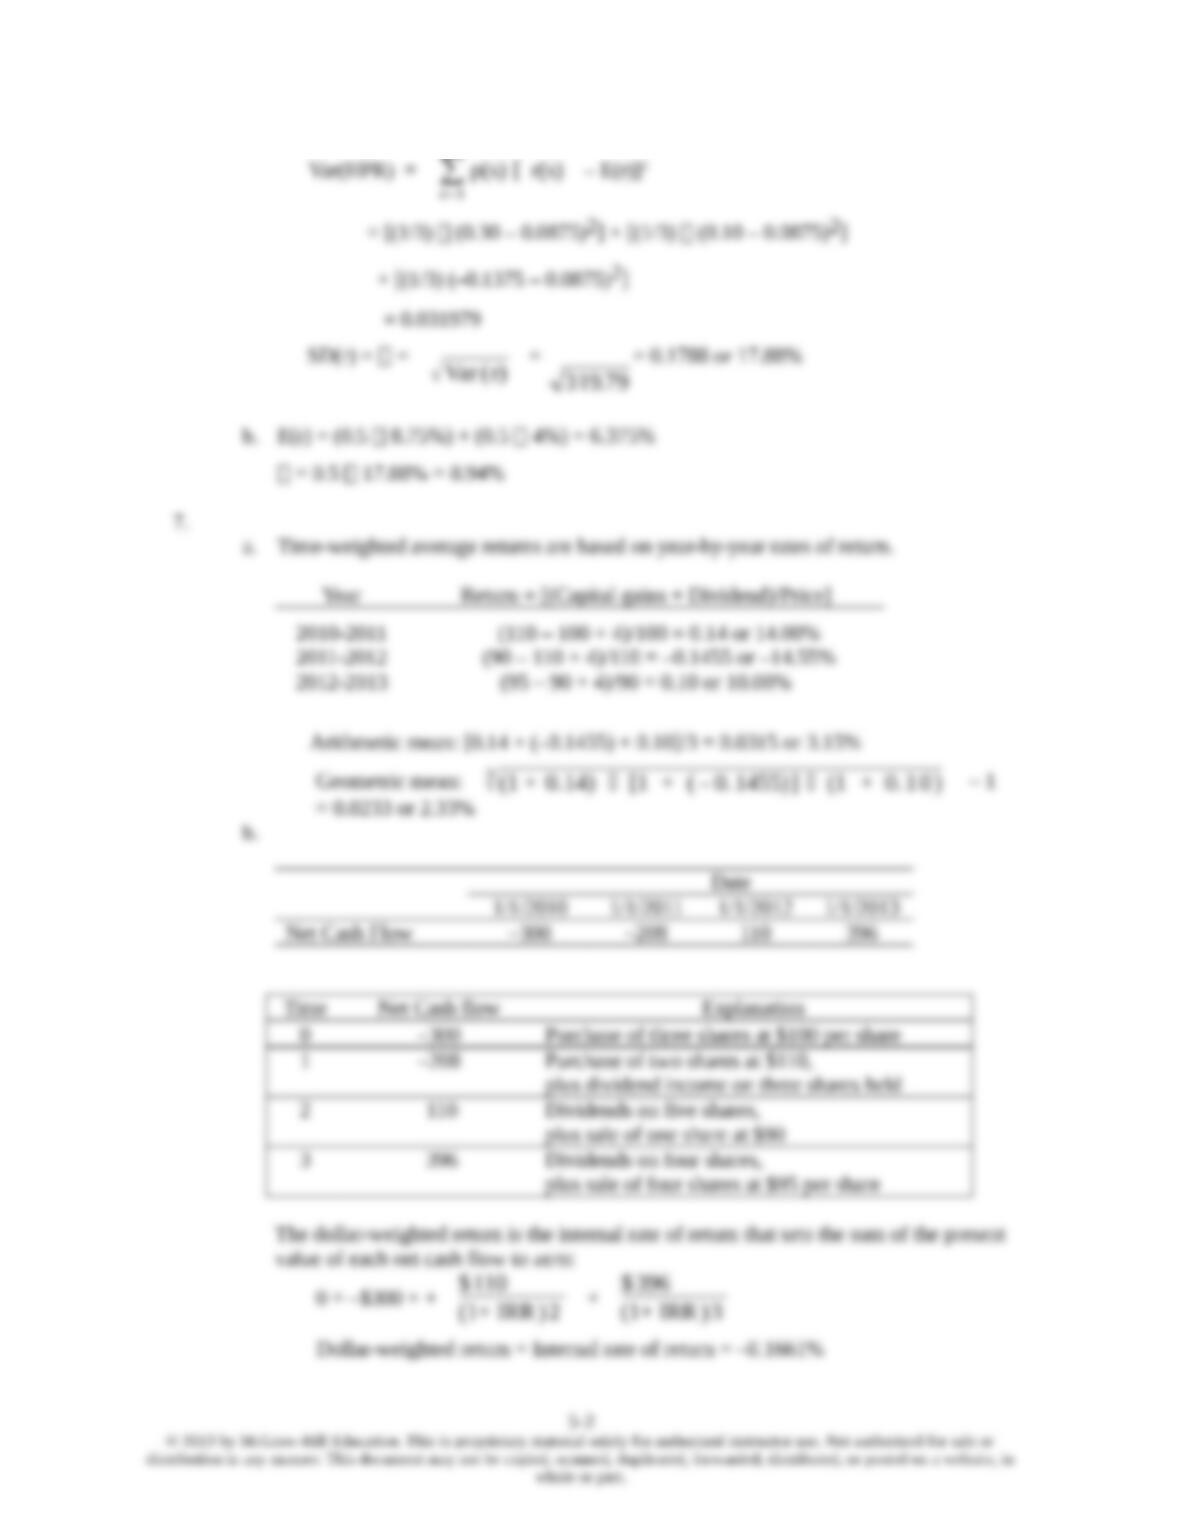
b. E(r) = (0.5 8.75%) + (0.5 4%) = 6.375%
7.
a. Time-weighted average returns are based on year-by-year rates of return.
Year Return = [(Capital gains + Dividend)/Price]
2010-2011 (110 – 100 + 4)/100 = 0.14 or 14.00%
b.
Date
1/1/2010 1/1/2011 1/1/2012 1/1/2013
Net Cash Flow –300 –208 110 396
Time Net Cash flow Explanation
0 –300 Purchase of three shares at $100 per share
1 –208 Purchase of two shares at $110,
plus dividend income on three shares held
2 110 Dividends on five shares,
plus sale of one share at $90
3 396 Dividends on four shares,
plus sale of four shares at $95 per share
5-2
© 2013 by McGraw-Hill Education. This is proprietary material solely for authorized instructor use. Not authorized for sale or
distribution in any manner. This document may not be copied, scanned, duplicated, forwarded, distributed, or posted on a website, in
whole or part.
Chapter 05 – Risk and Return: Past and Prologue
8.
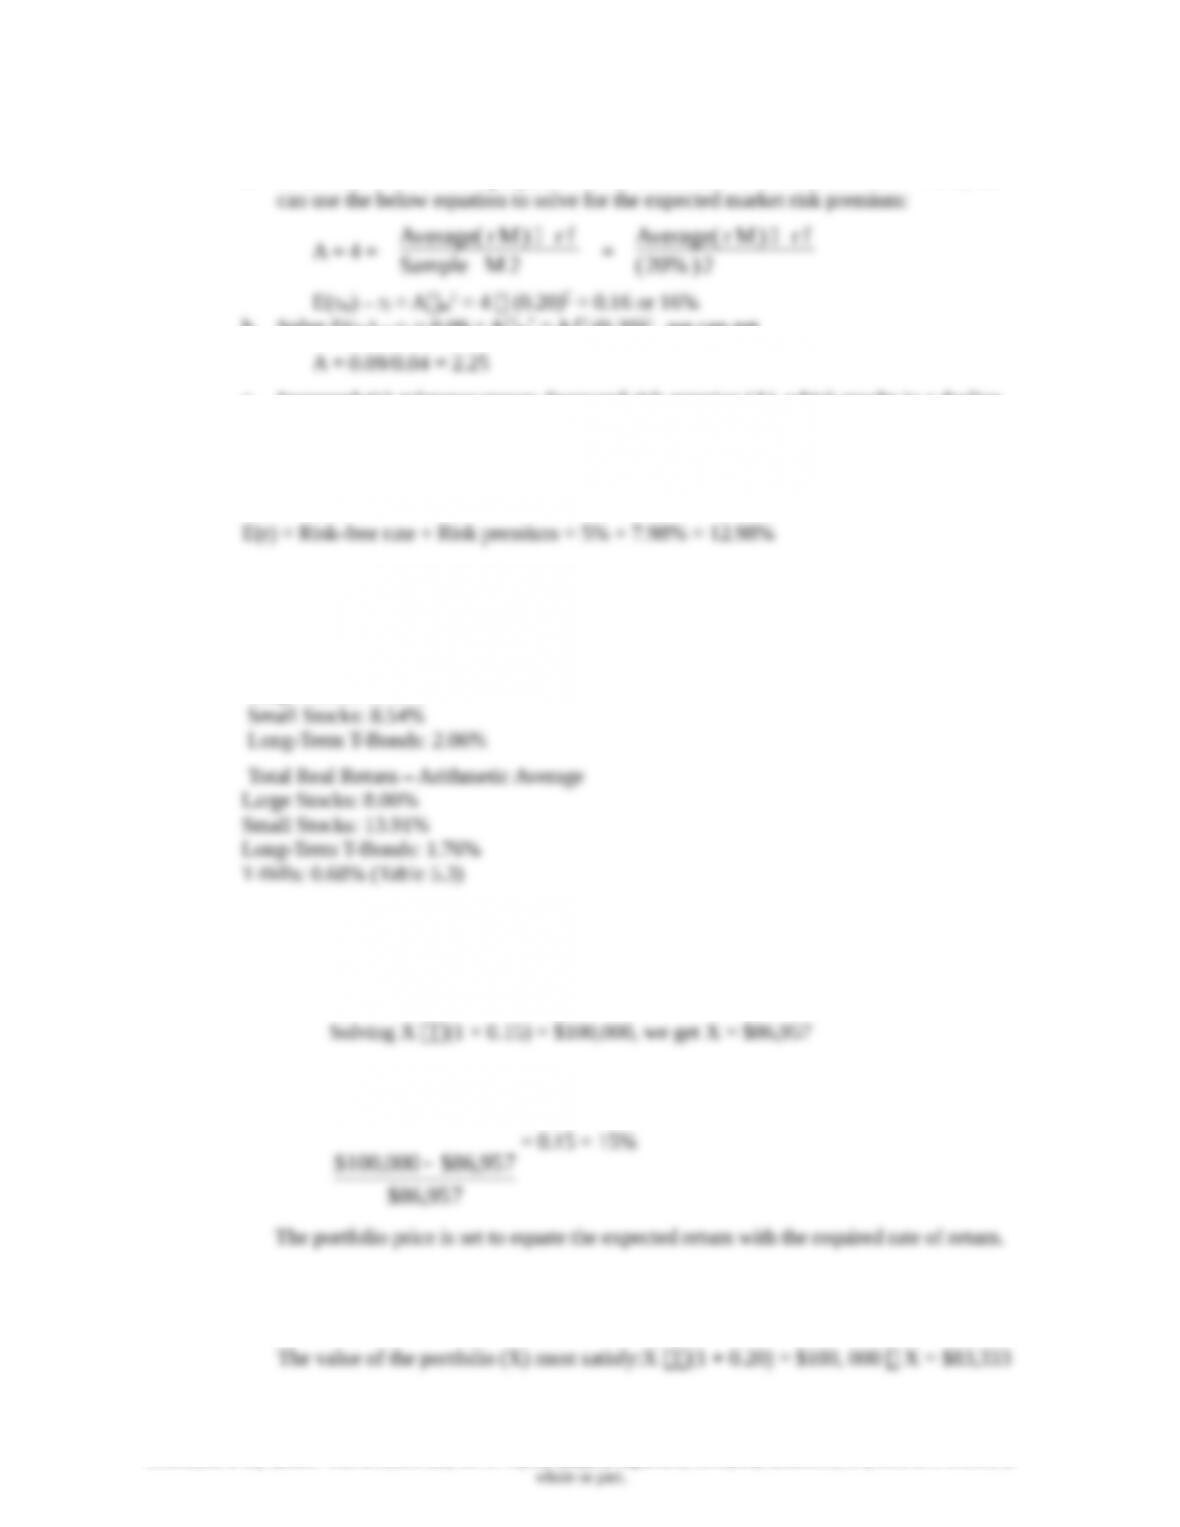
a. Given that A = 4 and the projected standard deviation of the market return = 20%, we
b. Solve E(rM) – rf = 0.09 = AM2 = A (0.20) , we can get
c. Increased risk tolerance means decreased risk aversion (A), which results in a decline
in risk premiums.
9. From Table 5.4, we find that for the period 1926 – 2010, the mean excess return for S&P 500
over T-bills is 7.98%.
10. To answer this question with the data provided in the textbook, we look up the real returns of
the large stocks, small stocks, and Treasury Bonds for 1926-2010 from Table 5.2, and the real
rate of return of T-Bills in the same period from Table 5.3:
Total Real Return – Geometric Average
Large Stocks: 6.43%
11.
a. The expected cash flow is: (0.5 $50,000) + (0.5 $150,000) = $100,000
With a risk premium of 10%, the required rate of return is 15%. Therefore, if the value
of the portfolio is X, then, in order to earn a 15% expected return:
b. If the portfolio is purchased at $86,957, and the expected payoff is $100,000, then the
expected rate of return, E(r), is:
957,86$
957,86$000,100$
= 0.15 = 15%
The portfolio price is set to equate the expected return with the required rate of return.
c. If the risk premium over T-bills is now 15%, then the required return is:
5% + 15% = 20%
5-3
© 2013 by McGraw-Hill Education. This is proprietary material solely for authorized instructor use. Not authorized for sale or
distribution in any manner. This document may not be copied, scanned, duplicated, forwarded, distributed, or posted on a website, in
whole or part.
Chapter 05 – Risk and Return: Past and Prologue
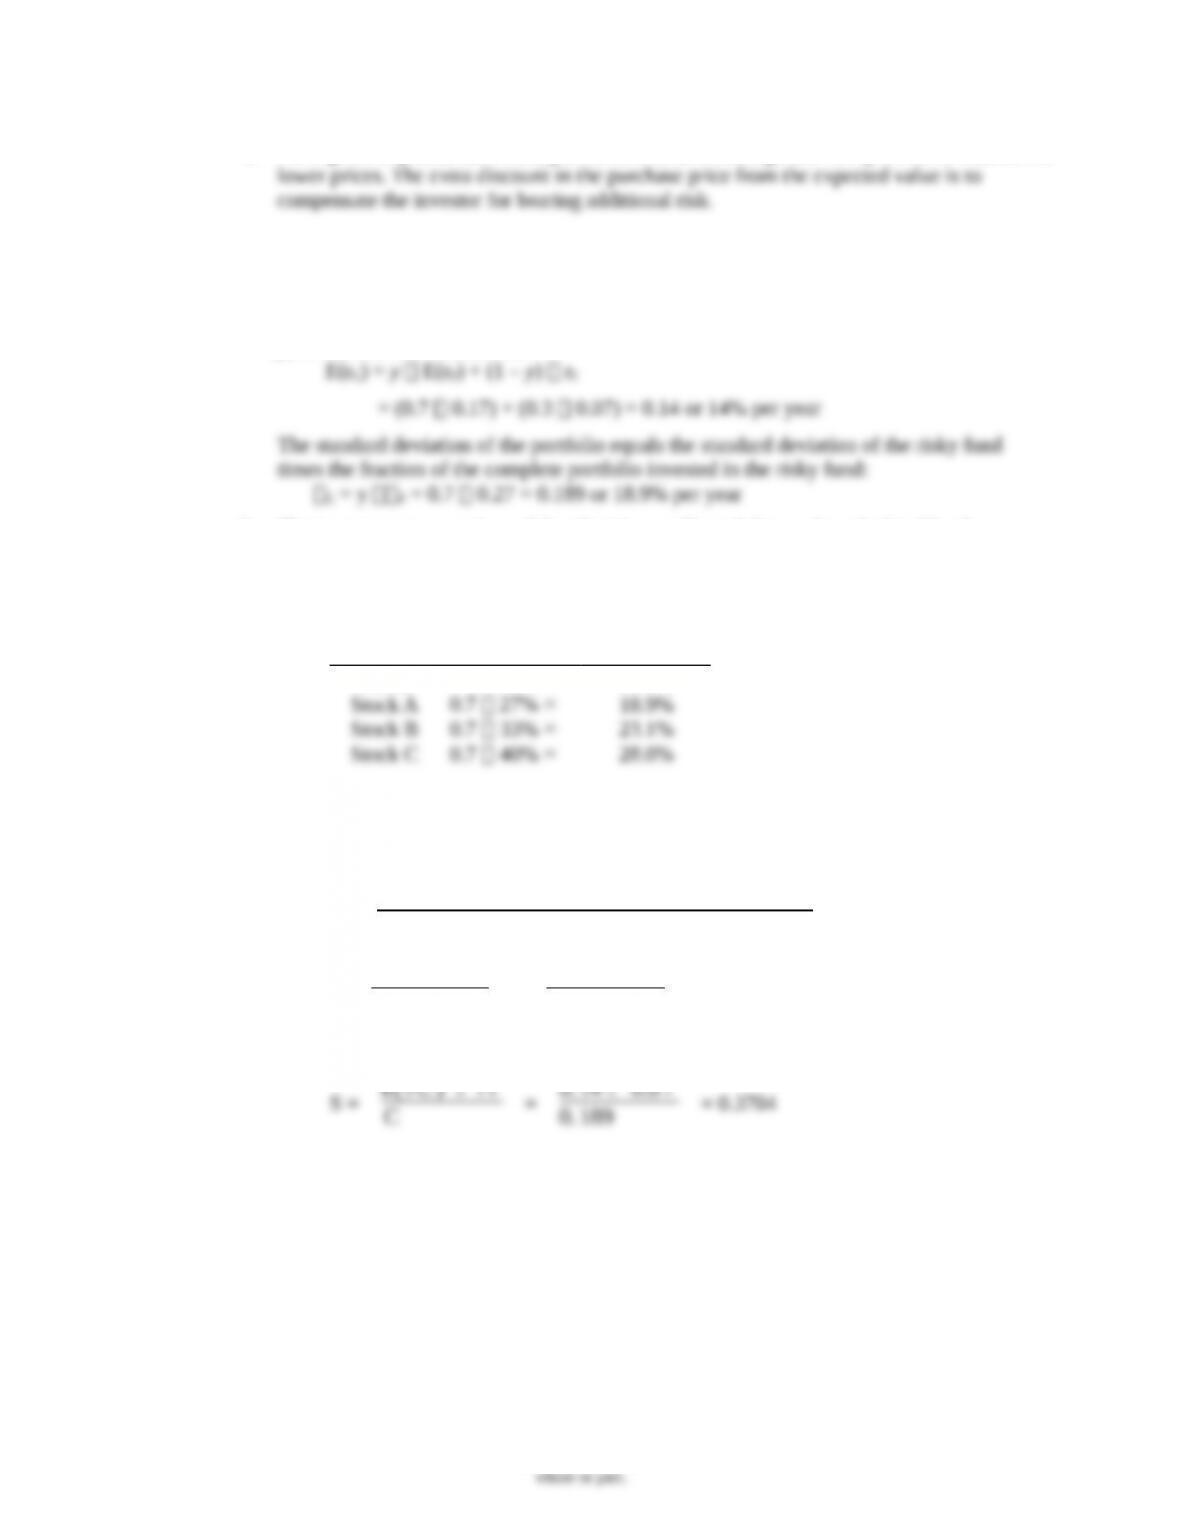
d. For a given expected cash flow, portfolios that command greater risk premiums must sell at
12.
a. Allocating 70% of the capital in the risky portfolio P, and 30% in risk-free asset, the
client has an expected return on the complete portfolio calculated by adding up the
expected return of the risky proportion (y) and the expected return of the proportion (1 –
y) of the risk-free investment:
b. The investment proportions of the client’s overall portfolio can be calculated by the
proportion of risky portfolio in the complete portfolio times the proportion allocated in
each stock.
Security
Investment
Proportions
T-Bills 30.0%
c. We calculate the reward-to-variability ratio (Sharpe ratio) using Equation 5.14.
For the risky portfolio:
S =
Portfolio Risk Premium
S tandard Deviation of Portfolio Excess Return
=
E( rP ) - r f
P
=
0. 17 - 0.0 7
0. 27
“” /”
For the client’s overall portfolio:
S =
E( rC ) - r f
C
=
0. 14 - 0.0 7
0. 189
= 0.3704
5-4
© 2013 by McGraw-Hill Education. This is proprietary material solely for authorized instructor use. Not authorized for sale or
distribution in any manner. This document may not be copied, scanned, duplicated, forwarded, distributed, or posted on a website, in
whole or part.
Chapter 05 – Risk and Return: Past and Prologue
E(r)
s
7
27
14
17
P
CAL ( slope=.3704)
%
%
18.9
client
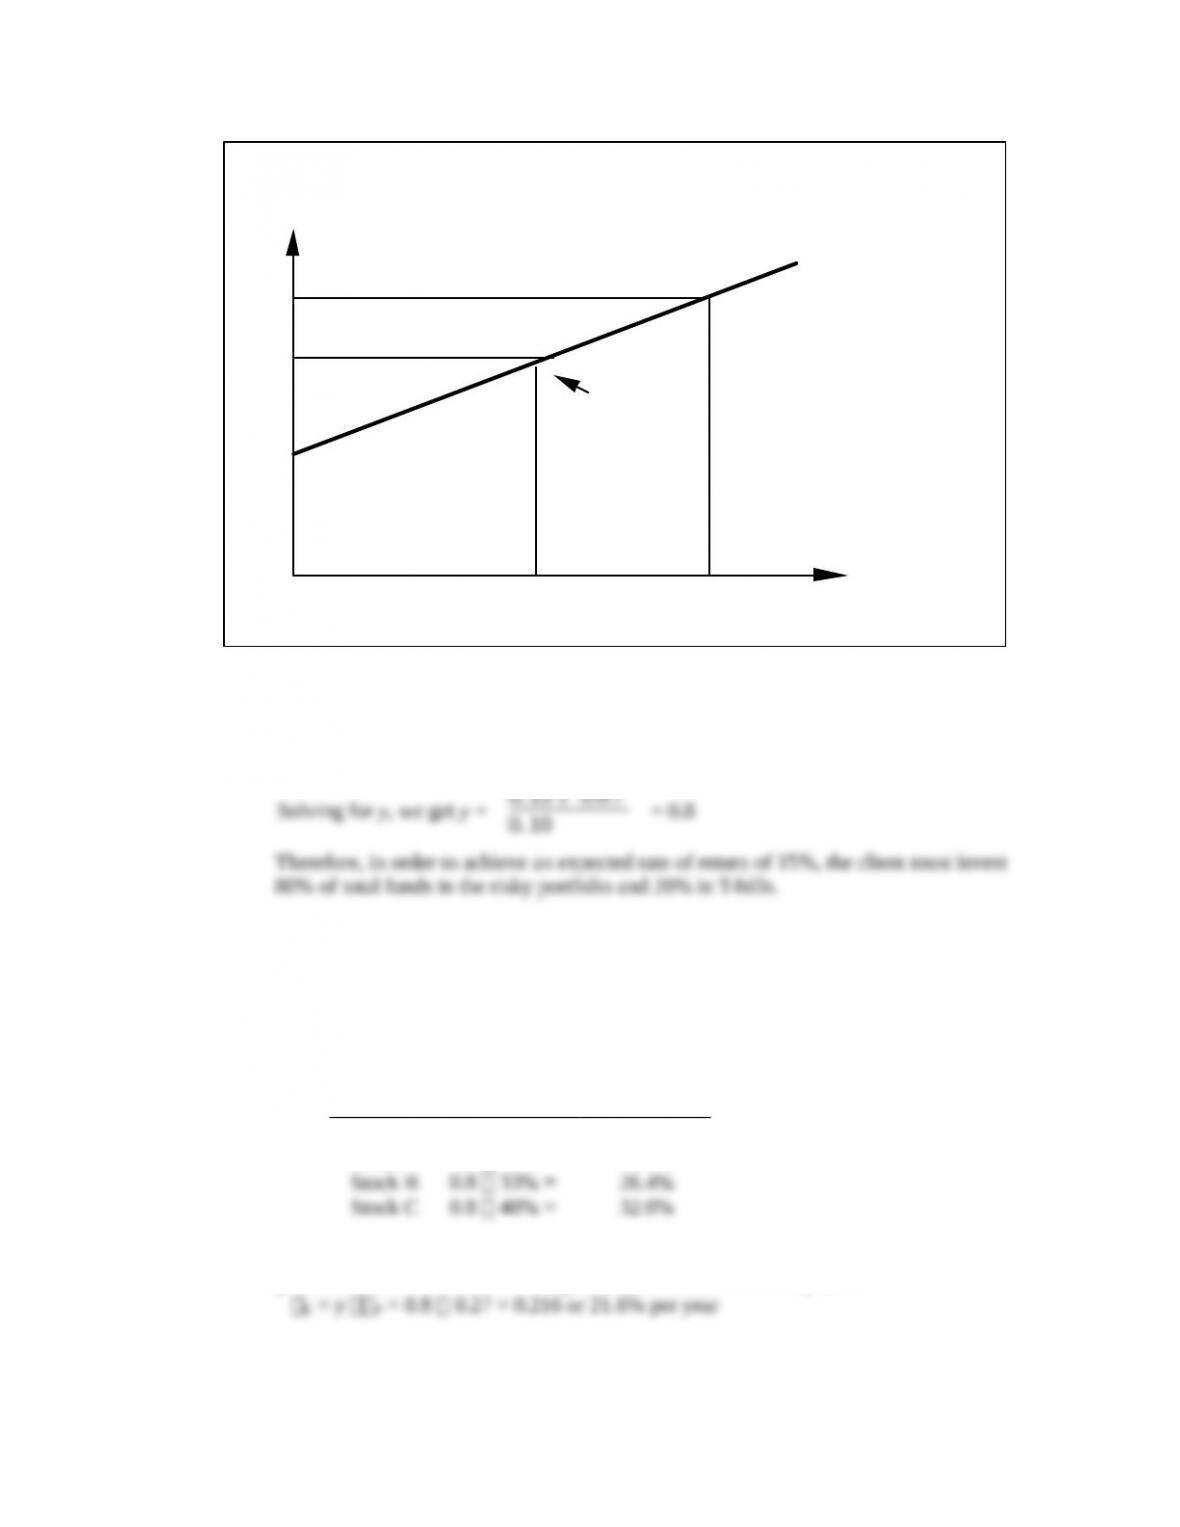
13.
a. E(rC) = y E(rP) + (1 – y) rf
= y 0.17 + (1 – y) 0.07 = 0.15 or 15% per year
0. 15 - 0.0 7
b. The investment proportions of the client’s overall portfolio can be calculated by the
proportion of risky asset in the whole portfolio times the proportion allocated in each
stock.
c.
Security
Investment
Proportions
T-Bills 20.0%
Stock A 0.8 27% = 21.6%
d. The standard deviation of the complete portfolio is the standard deviation of the risky
portfolio times the fraction of the portfolio invested in the risky asset:
14.
5-5
© 2013 by McGraw-Hill Education. This is proprietary material solely for authorized instructor use. Not authorized for sale or
distribution in any manner. This document may not be copied, scanned, duplicated, forwarded, distributed, or posted on a website, in
whole or part.
Chapter 05 – Risk and Return: Past and Prologue
a. Standard deviation of the complete portfolio= C = y 0.27
If the client wants the standard deviation to be equal or less than 20%, then:
b. E(rC) = rf + y [E(rP) – rf] = 0.07 + 0.7407 0.10 = 0.1441 or 14.41%
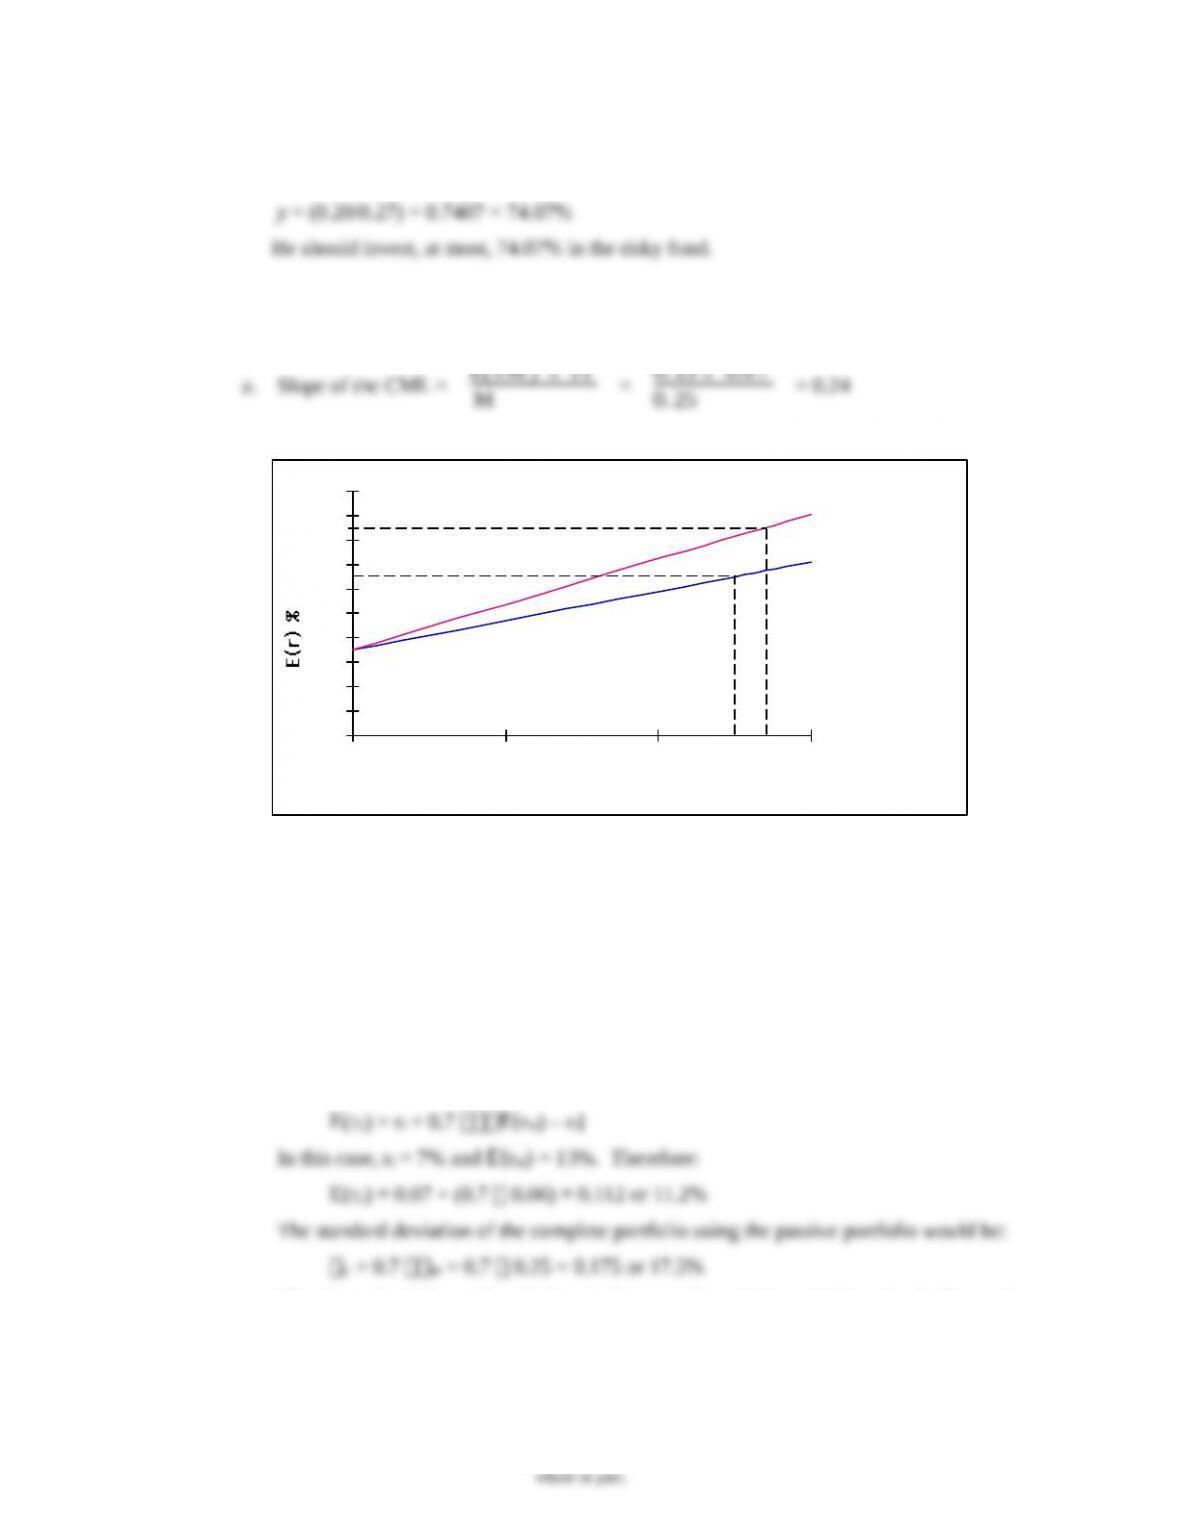
15.
a. Slope of the CML =
E( rM ) - r f
M
=
0. 13 - 0.0 7
0. 25
= 0.24
See the diagram below:
0
2
4
6
8
10
12
14
16
18
20
0 10 20 30
s (%)
CAL (slope=.3704)
CML (slope=.24)
b. Your fund allows an investor to achieve a higher expected rate of return for any given
standard deviation than would a passive strategy, i.e., a higher expected return for any
given level of risk.
16.
a. With 70% of his money in your fund’s portfolio, the client has an expected rate of
return of 14% per year and a standard deviation of 18.9% per year. If he shifts that
money to the passive portfolio (which has an expected rate of return of 13% and
standard deviation of 25%), his overall expected return and standard deviation would
become:
Therefore, the shift entails a decline in the mean from 14% to 11.2% and a decline in the
standard deviation from 18.9% to 17.5%. Since both mean return and standard deviation
fall, it is not yet clear whether the move is beneficial. The disadvantage of the shift is
apparent from the fact that, if your client is willing to accept an expected return on his
5-6
© 2013 by McGraw-Hill Education. This is proprietary material solely for authorized instructor use. Not authorized for sale or
distribution in any manner. This document may not be copied, scanned, duplicated, forwarded, distributed, or posted on a website, in
whole or part.
Chapter 05 – Risk and Return: Past and Prologue
total portfolio of 11.2%, he can achieve that return with a lower standard deviation using
your fund portfolio rather than the passive portfolio. To achieve a target mean of 11.2%,
we first write the mean of the complete portfolio as a function of the proportions invested
in your fund portfolio, y:
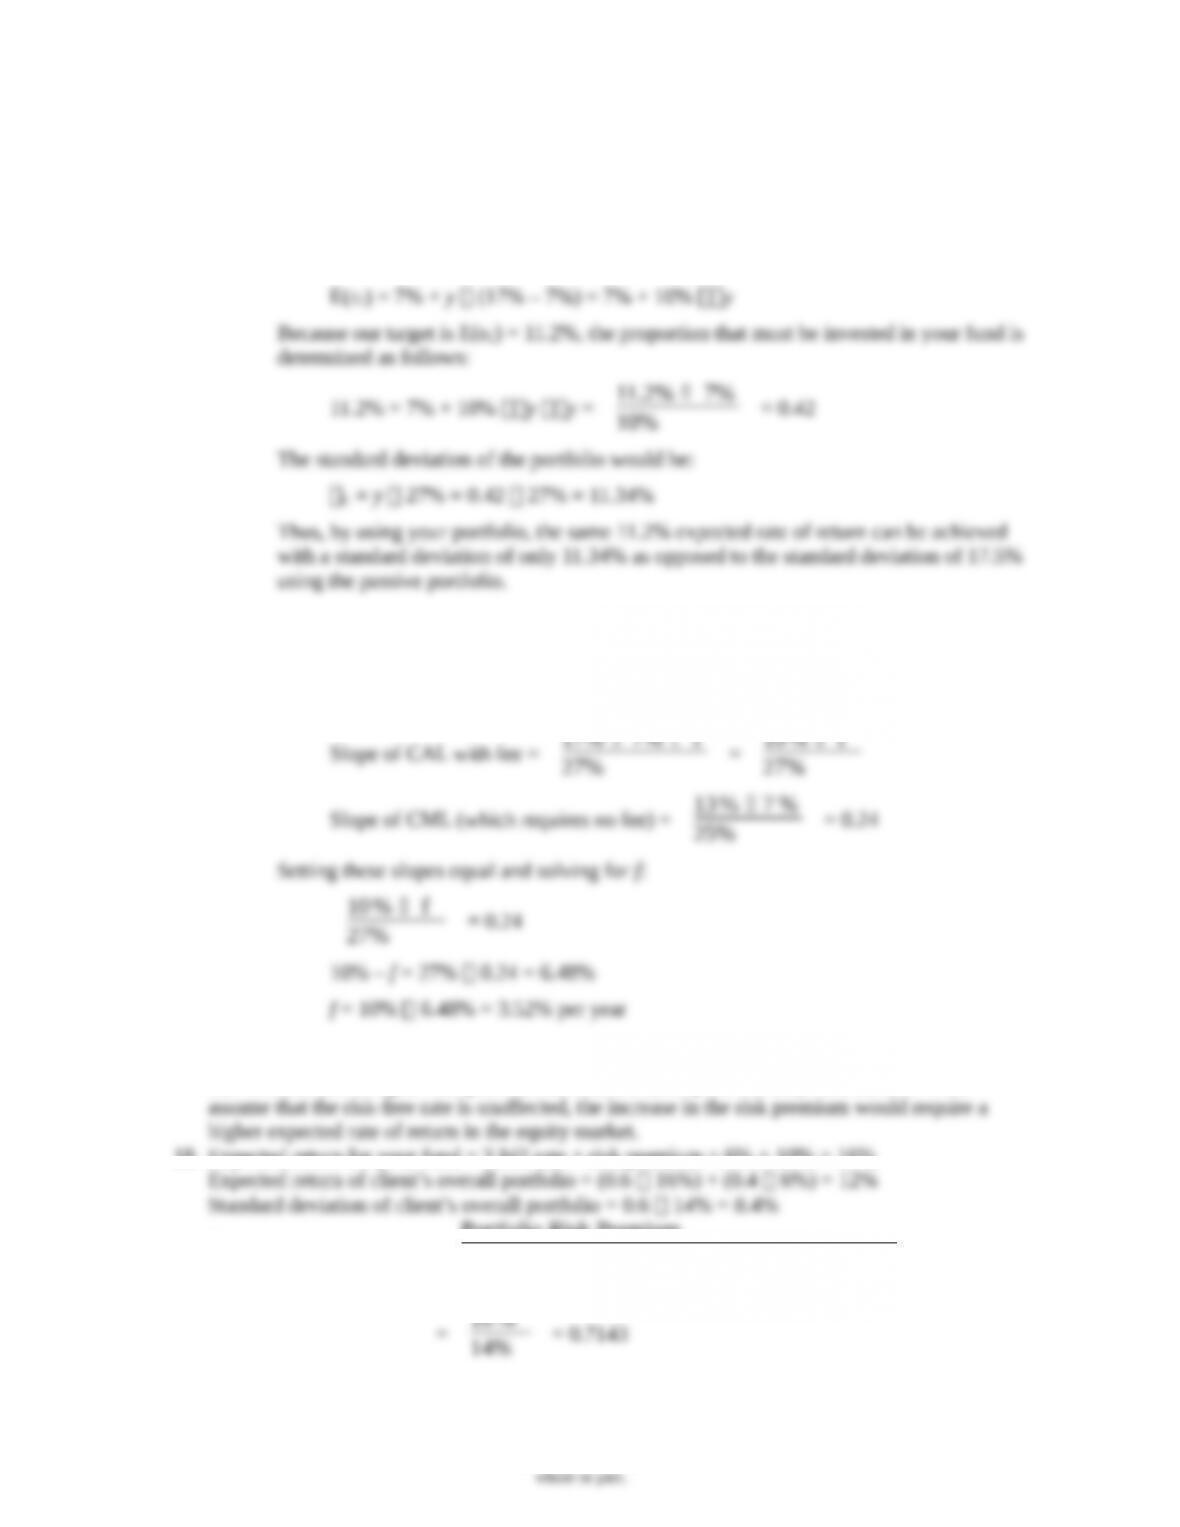
b. The fee would reduce the reward-to-variability ratio, i.e., the slope of the CAL. Clients
will be indifferent between your fund and the passive portfolio if the slope of the
after-fee CAL and the CML are equal. Let f denote the fee:
13 % - 7 %
17% - 7% - f
10 % - f
10 % - f
27%
= 0.24
10% – f = 27% 0.24 = 6.48%
f = 10% 6.48% = 3.52% per year
17. Assuming no change in tastes, that is, an unchanged risk aversion, investors perceiving higher
risk will demand a higher risk premium to hold the same portfolio they held before. If we
18. Expected return for your fund = T-bill rate + risk premium = 6% + 10% = 16%
19. Reward to volatility ratio =
Portfolio Risk Premium
S tandard Deviation of Portfolio Excess Return
=
10 %
14%
= 0.7143
5-7
© 2013 by McGraw-Hill Education. This is proprietary material solely for authorized instructor use. Not authorized for sale or
distribution in any manner. This document may not be copied, scanned, duplicated, forwarded, distributed, or posted on a website, in
whole or part.
Chapter 05 – Risk and Return: Past and Prologue
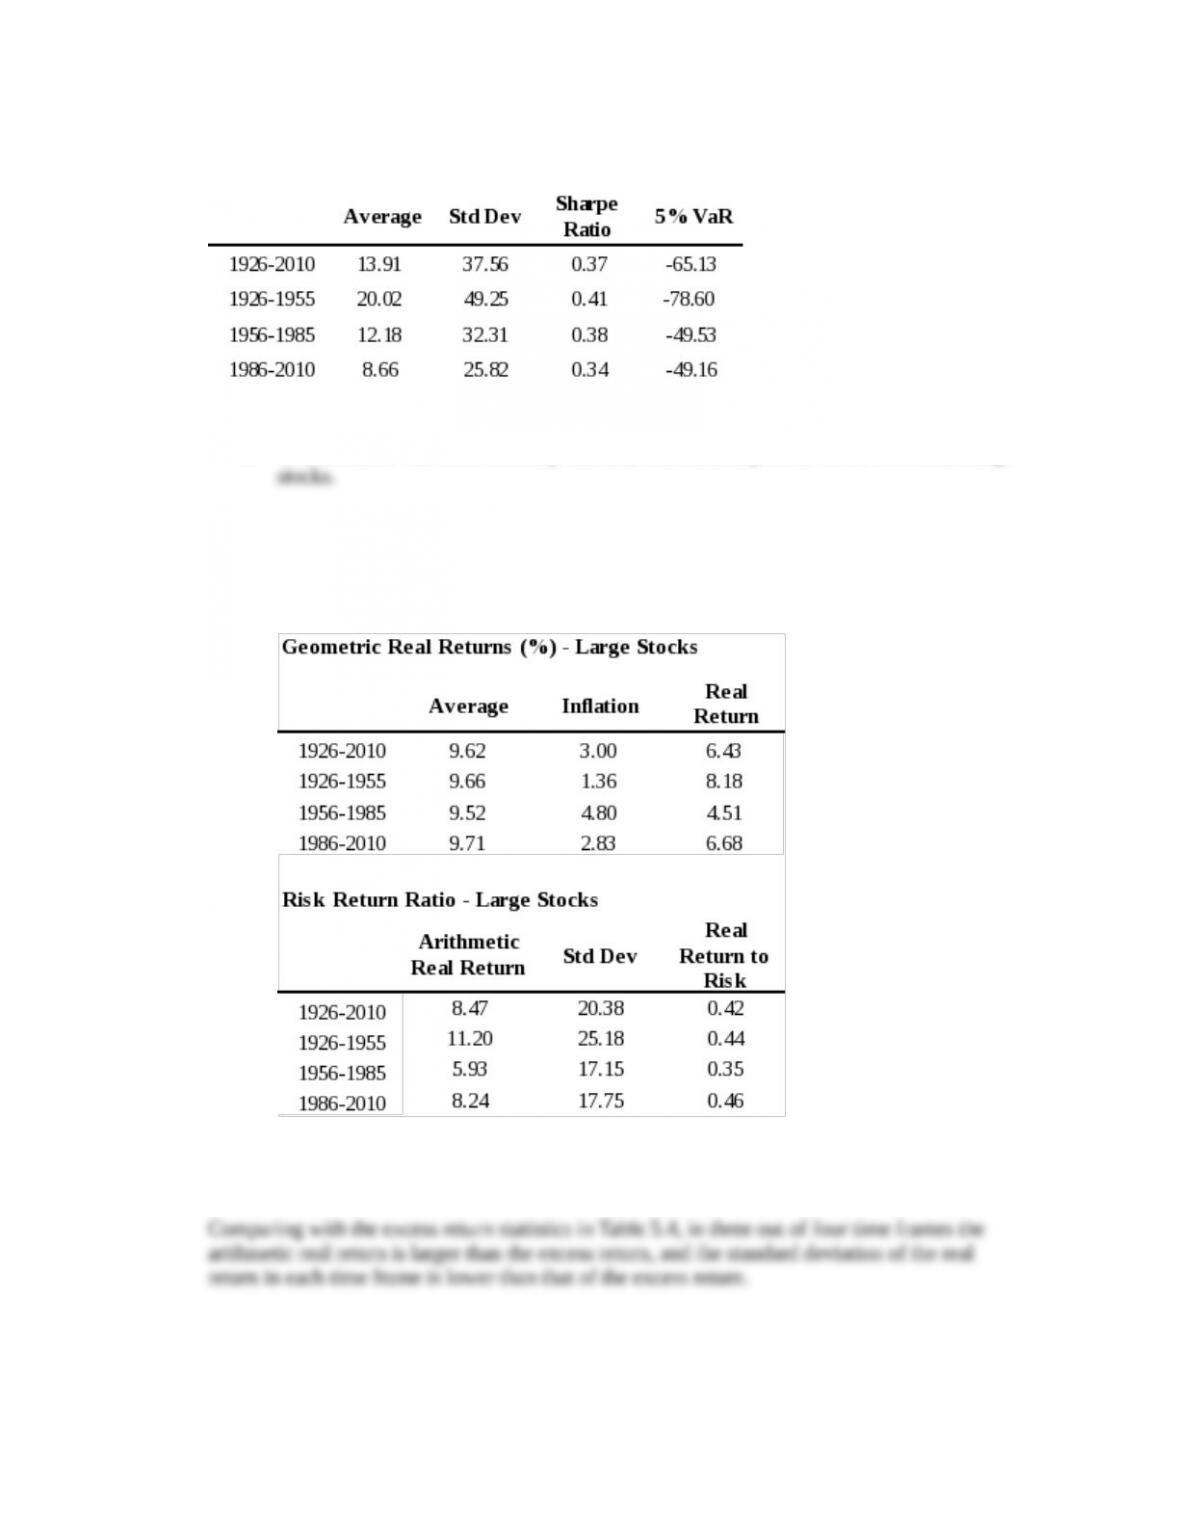
20.
Excess Return (%)
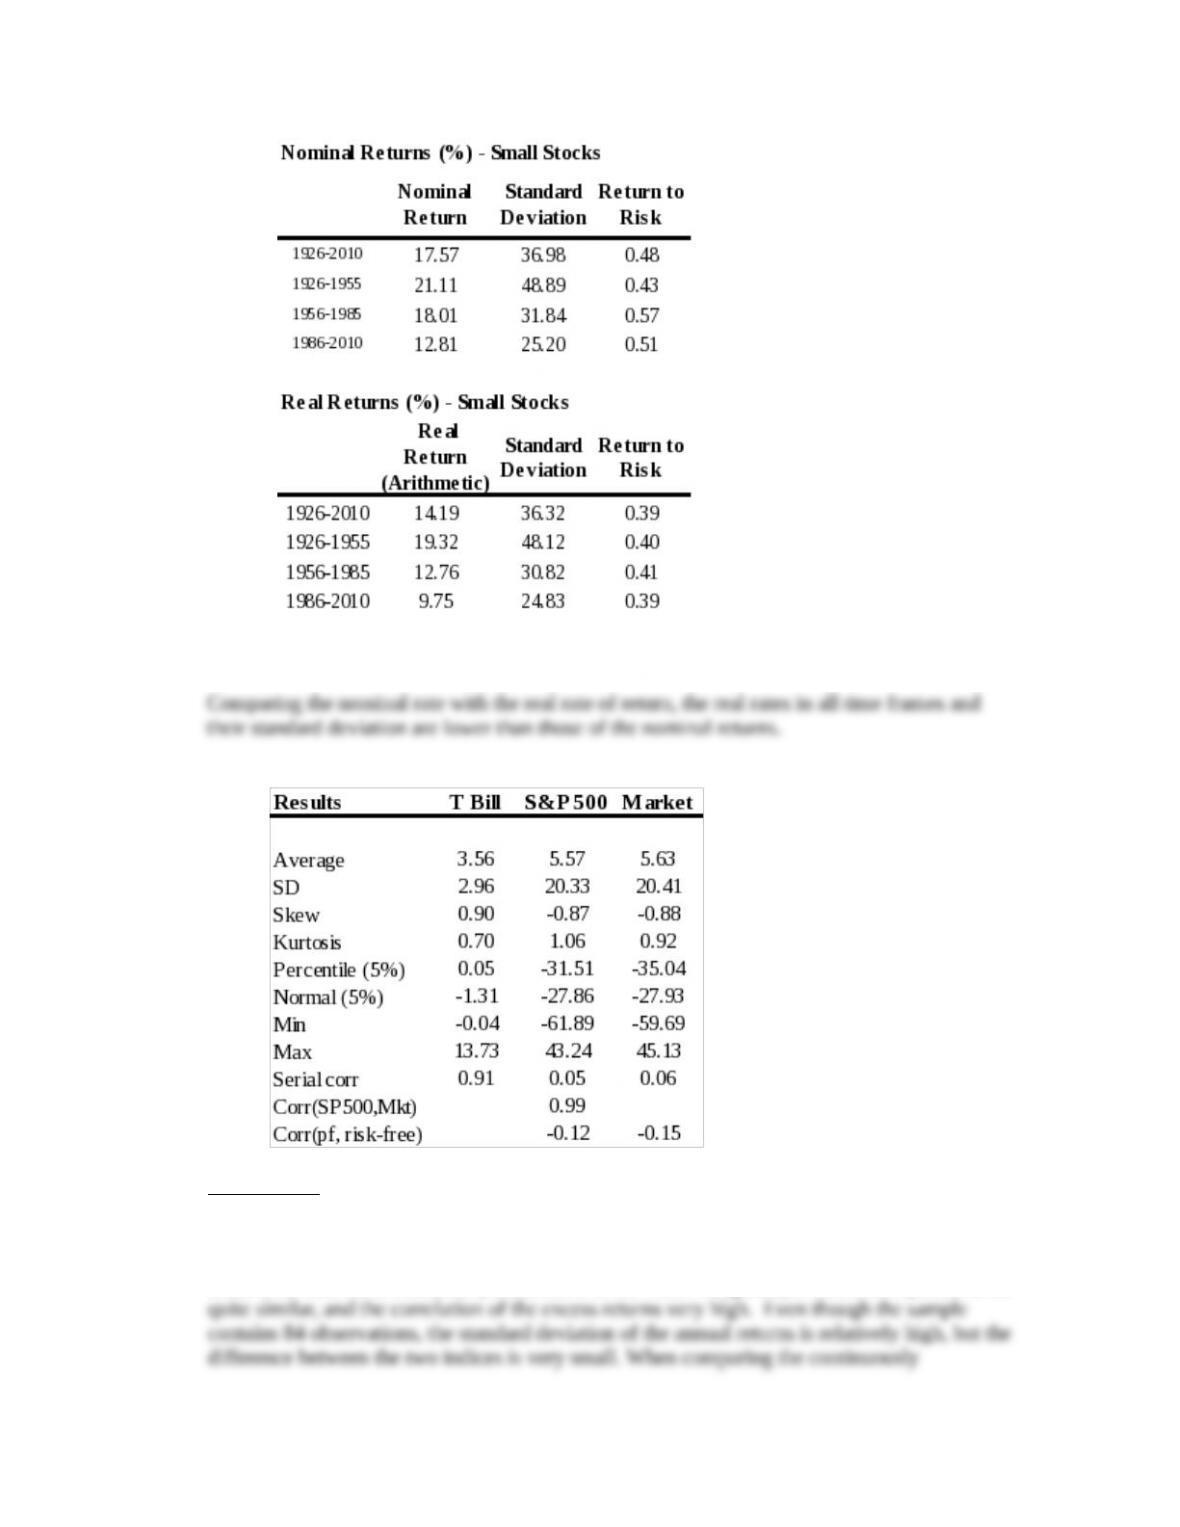
a. In three out of four time frames presented, small stocks provide worse ratios than large
b. Small stocks show a declining trend in risk, but the decline is not stable.
21. For geometric real returns, we take the geometric average return and the real geometric return
data from Table 5.2 and then calculate the inflation in each time frame using the equation:
Inflation rate = (1 + Nominal rate)/(1 + Real rate) – 1.
The VaR is not calculated, since the values used to determine the VaR in Table 5.4 are not
provided.
5-8
© 2013 by McGraw-Hill Education. This is proprietary material solely for authorized instructor use. Not authorized for sale or
distribution in any manner. This document may not be copied, scanned, duplicated, forwarded, distributed, or posted on a website, in
whole or part.
Chapter 05 – Risk and Return: Past and Prologue
The VaR is not calculated, since the values used to determine the VaR in Table 5.4 are not
provided.
22.
Comparison
The combined market index represents the Fama-French market factor (Mkt). It is better
diversified than the S&P 500 index since it contains approximately ten times as many stocks.
The total market capitalization of the additional stocks, however, is relatively small compared
to the S&P 500. As a result, the performance of the value-weighted portfolios is expected to be
5-9
© 2013 by McGraw-Hill Education. This is proprietary material solely for authorized instructor use. Not authorized for sale or
distribution in any manner. This document may not be copied, scanned, duplicated, forwarded, distributed, or posted on a website, in
whole or part.
Chapter 05 – Risk and Return: Past and Prologue
CFA 1
Answer: V(12/31/2011) = V(1/1/2005) (1 + g)7 = $100,000 (1.05)7 = $140,710.04
CFA 2
CFA 3
CFA 4
For each portfolio: Utility = E(r) – (0.5 4 2)
Investment E(r) Utility
1 0.12 0.30 -0.0600
2 0.15 0.50 -0.3500
3 0.21 0.16 0.1588
4 0.24 0.21 0.1518
We choose the portfolio with the highest utility value.
CFA 5
Answer: Investment 4.
CFA 6
Answer: b. Investor’s aversion to risk.
CFA 7
Answer:
CFA 8
Answer:
5-10
© 2013 by McGraw-Hill Education. This is proprietary material solely for authorized instructor use. Not authorized for sale or
distribution in any manner. This document may not be copied, scanned, duplicated, forwarded, distributed, or posted on a website, in
whole or part.
Chapter 05 – Risk and Return: Past and Prologue
CFA 9
Answer:
CFA 10
Answer:
CFA 11
Answer:
E(r) = (0.1 0.15) + (0.6 0.13) + (0.3 0.07) = 0.114 or 11.4%
5-11
© 2013 by McGraw-Hill Education. This is proprietary material solely for authorized instructor use. Not authorized for sale or
distribution in any manner. This document may not be copied, scanned, duplicated, forwarded, distributed, or posted on a website, in
whole or part.