Chapter 14 – Financial Statement Analysis
CHAPTER 14
14-1
© 2013 by McGraw-Hill Education. This is proprietary material solely for authorized instructor use. Not authorized for sale or
distribution in any manner. This document may not be copied, scanned, duplicated, forwarded, distributed, or posted on a website, in
whole or part.
Chapter 14 – Financial Statement Analysis
FINANCIAL STATEMENT ANALYSIS
1.
a. Inventory turnover ratio in 2012
=
Cost of Good s Sold
Average Inventor ies
=
$ 2,850
($ 490 + $ 480)/2
= 5.876
b. Debtto equity ratio in 2012
=
Debt
Equity
=
$ 3 ,34 0
$ 960
= 3.479
c. Cash flow from operating activities in 2012
Net income $ 410,000
Adjustments to Net Income
+ Depreciation 280,000
d. Average collection period
=
Average Accounts Receivables
Annual Sales
365 =
($ 660 + $ 690)/2
$ 5,500
365 =
44.795
e. Asset turnover ratio
=
Sales
Average Total Assets
=
$ 5,500
($ 4,300 + $ 4,010)/2
= 1.324
f. Interest coverage ratio
=
EBIT
Interest Expense
=
$ 87 0
$ 130
= 6.692
g. Operating profit margin
=
EBIT
Sales
=
$ 870
$ 5,500
=.158 =15.8%
h. Return on equity
14-2
© 2013 by McGraw-Hill Education. This is proprietary material solely for authorized instructor use. Not authorized for sale or
distribution in any manner. This document may not be copied, scanned, duplicated, forwarded, distributed, or posted on a website, in
whole or part.
Chapter 14 – Financial Statement Analysis
=
Net Income
Average Shareholder’s Equity
=
$ 410
($ 960 + $ 810)/2
= .463 = 46.3%
i. P/E ratio
Unable to calculate as market price is not provided.
j. Compound leverage ratio
=
Pretax Profit
EBIT
Average Assets
Average Equity
=
$ 740
$ 870
($4,300 + $4,010)/2
($960 + $810)/2
2.
a.
b.
c.
3. ROA = (EBIT/Sales) (Sales/Average Total Assets)= Return on SalesATO
4. ABC’s asset turnover must be above the industry average.
14-3
© 2013 by McGraw-Hill Education. This is proprietary material solely for authorized instructor use. Not authorized for sale or
distribution in any manner. This document may not be copied, scanned, duplicated, forwarded, distributed, or posted on a website, in
whole or part.
Chapter 14 – Financial Statement Analysis
5. This transaction would increase the current ratio. The transaction reduces both current
assets and current liabilities by the same amount, but the reduction has a larger
6. c. Inventory increases due to a new (internally developed) product line.
7. c. Interest paid to bondholders.
8.
a. Lower bad debt expense will result in higher operating income.
b. Lower bad debt expense will have no effect on operating cash flow until Galaxy
9. a. Certain GAAP rules can be exploited by companies in order to achieve specific
10. a.Off balance-sheet financing through the use of operating leases is acceptable when
11. a.A warning sign of accounting manipulation is abnormal inventory growth as
compared to sales growth. By overstating inventory, the cost of goods sold is lower,
leading to higher profitability.
12. ROE = Net Profit Margin Total Asset Turnover Leverage Ratio
=
Net Profit
Sales
Sales
Average Asset s
Average Assets
Average Equity
= .055 2.0 2.2 = .
242 = 24.2%
13. Use Equation 14.1 to solve for operating ROA:
14. ROE = Tax Burden Interest Burden Margin Turnover Leverage
15.
Value of Common Stock 20,000 $20 = $ 400,000
Retained Earnings 5,000,000
Addition to Retained Earnings 70,000
Book Value $5,470,000
16.
a. Economic Value Added = (ROC – Cost of Capital) Total Assets
14-4
© 2013 by McGraw-Hill Education. This is proprietary material solely for authorized instructor use. Not authorized for sale or
distribution in any manner. This document may not be copied, scanned, duplicated, forwarded, distributed, or posted on a website, in
whole or part.
Chapter 14 – Financial Statement Analysis
b. Economic value added per dollar of invested capital:
CFA 1
Answer:
CFA 2
Answer:
CFA 3
Answer:
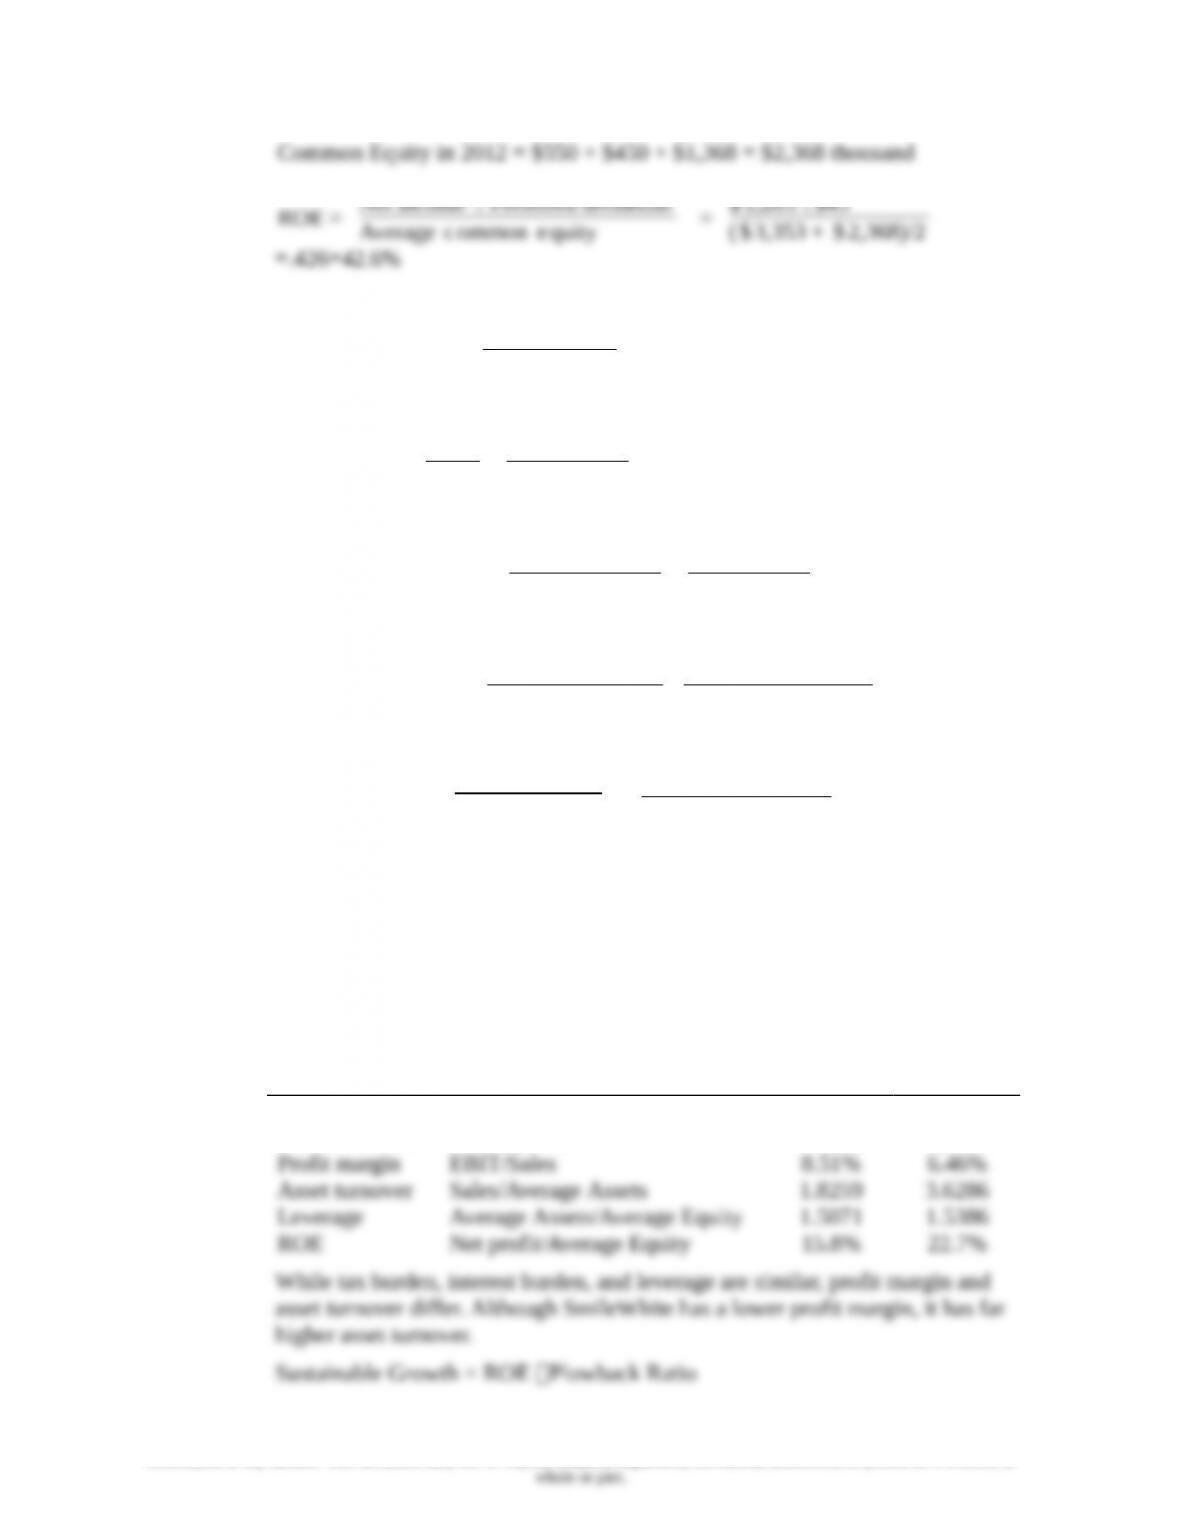
SmileWhite has the higher quality of earnings for several reasons:
i. SmileWhite amortizes its goodwill over a shorter period than does QuickBrush.
ii. SmileWhite depreciates its property, plant and equipment using an accelerated
iii.SmileWhite’s bad debt allowance, as a percent of receivables, is greater.
CFA 4
Answer:
a. Quick Ratio = =
$3 25 + $3,599
$ 3, 9 45
= .99
b. ROA
Assets
EBIT
2/)792,4$058,8($
78$259,2$
%4.36364.
c. Preferred Dividends = 0.1 $25 18,000 = $45,000
14-5
© 2013 by McGraw-Hill Education. This is proprietary material solely for authorized instructor use. Not authorized for sale or
distribution in any manner. This document may not be copied, scanned, duplicated, forwarded, distributed, or posted on a website, in
whole or part.
Chapter 14 – Financial Statement Analysis
d. Earnings Per Share
77.1$
2/)550829(
45$265,1$
e. Profit Margin
Sales
EBIT
%4.19194.
065,12$
78$259,2$
f. Times Interest Earned =
expense Interest
EBIT
0.30
78$
78$259,2$
g. Inventory Turnover =
inventory Average
sold goods of Cost
=
2/)423,2$415,1($
048,8$
= 4.2
h. Leverage ratio =
Average Assets
Average Equity
=
2/)803,3$868,2($
2/)058,8$792,4($
= 1.9
CFA 5
Answer:
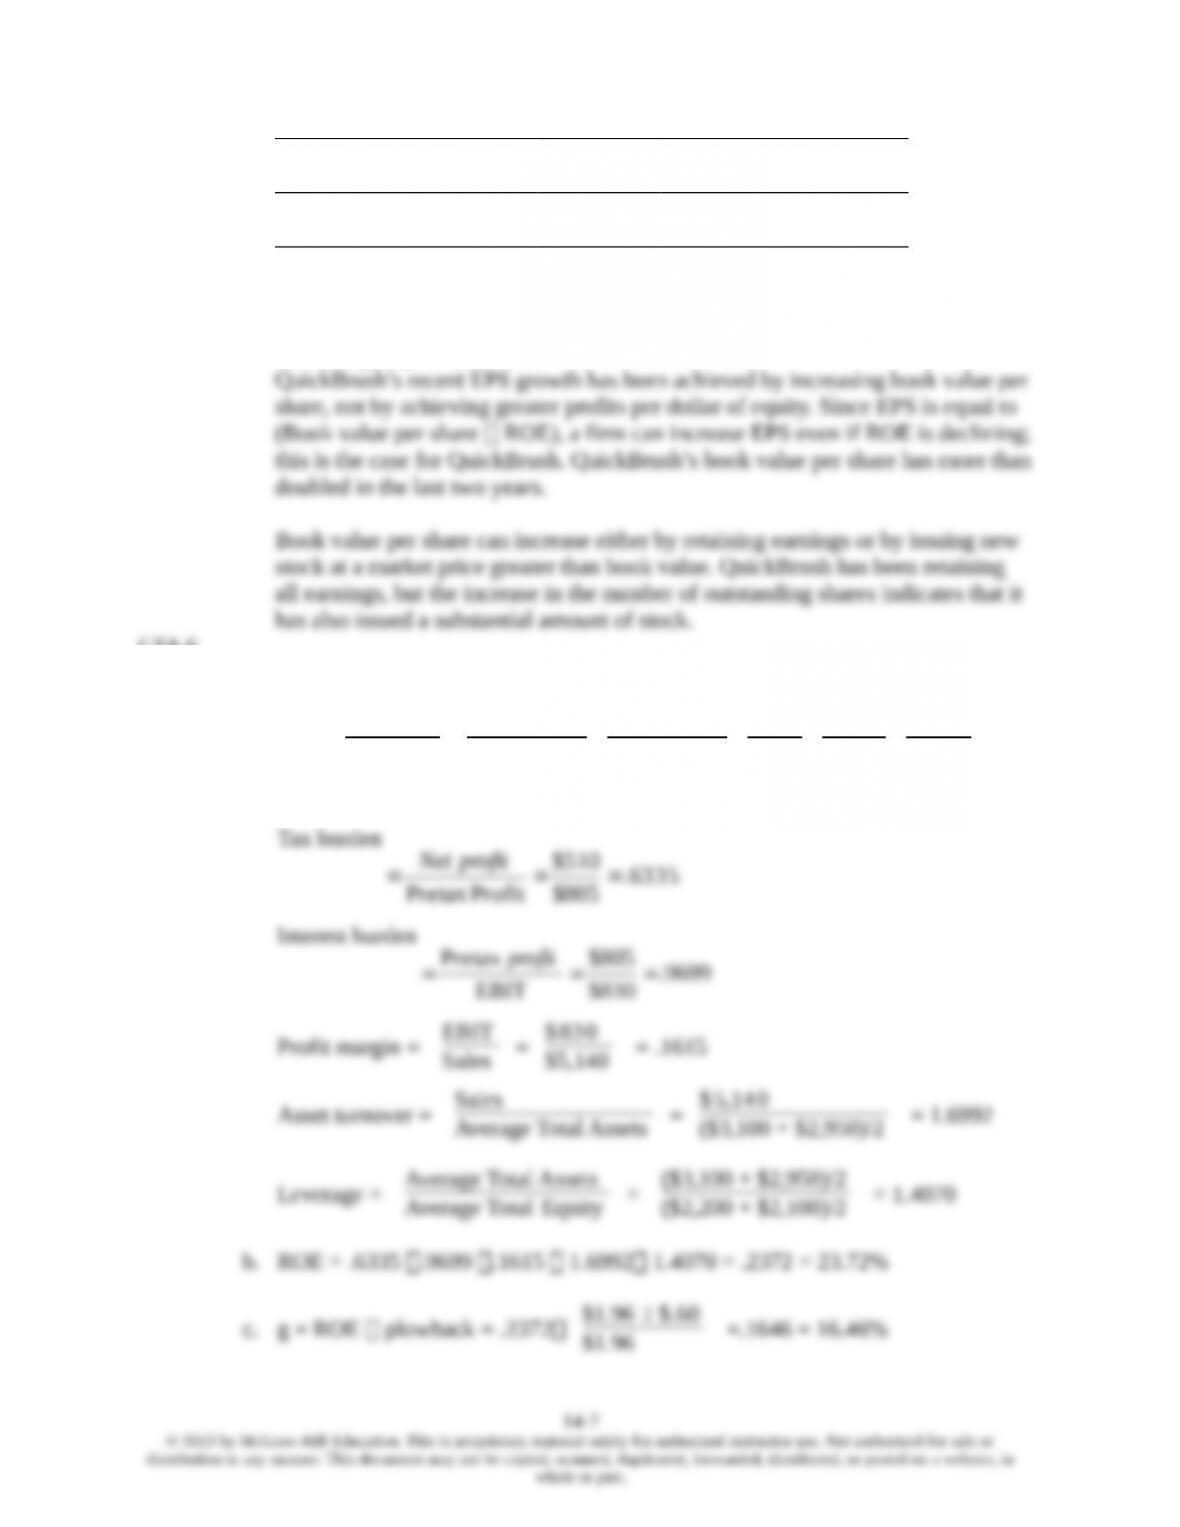
a. QuickBrush has had higher sales and earnings growth (per share) than
SmileWhite. Margins are also higher. But this does not necessarily mean that
QuickBrush is a better investment. SmileWhite has a higher ROE, which has been
stable, while QuickBrush’s ROE has been declining. We can use DuPont analysis
to identify the source of the difference in ROE:
Component Definition QuickBrush SmileWhite
Tax burden Net profit/Pretax profit 67.44% 65.99%
Interest burden Pretax profit/EBIT 1.00 0.9545
14-6
© 2013 by McGraw-Hill Education. This is proprietary material solely for authorized instructor use. Not authorized for sale or
distribution in any manner. This document may not be copied, scanned, duplicated, forwarded, distributed, or posted on a website, in
Chapter 14 – Financial Statement Analysis
ROE Plowback
ratio
Sustainableg
rowth rate
Ludlow’sesti
mate
QuickBrush 15.8% 1.00 15.8% 30.0%
SmileWhite 22.7% .344 7.8% 10.0%
Ludlow has overestimated the sustainable growth rate for each company.
QuickBrush has little ability to increase its sustainable growth because plowback
already equals 100%. SmileWhite could increase its sustainable growth by
increasing its plowback ratio.
CFA 6
Answer:
a. ROE
Equity
profit Net
Equity
Assets
Assets
Sales
Sales
EBIT
EBIT
profitPretax
profitPretax
profitNet
= Tax burden Interest burden Profit margin Asset turnover Leverage
Chapter 14 – Financial Statement Analysis
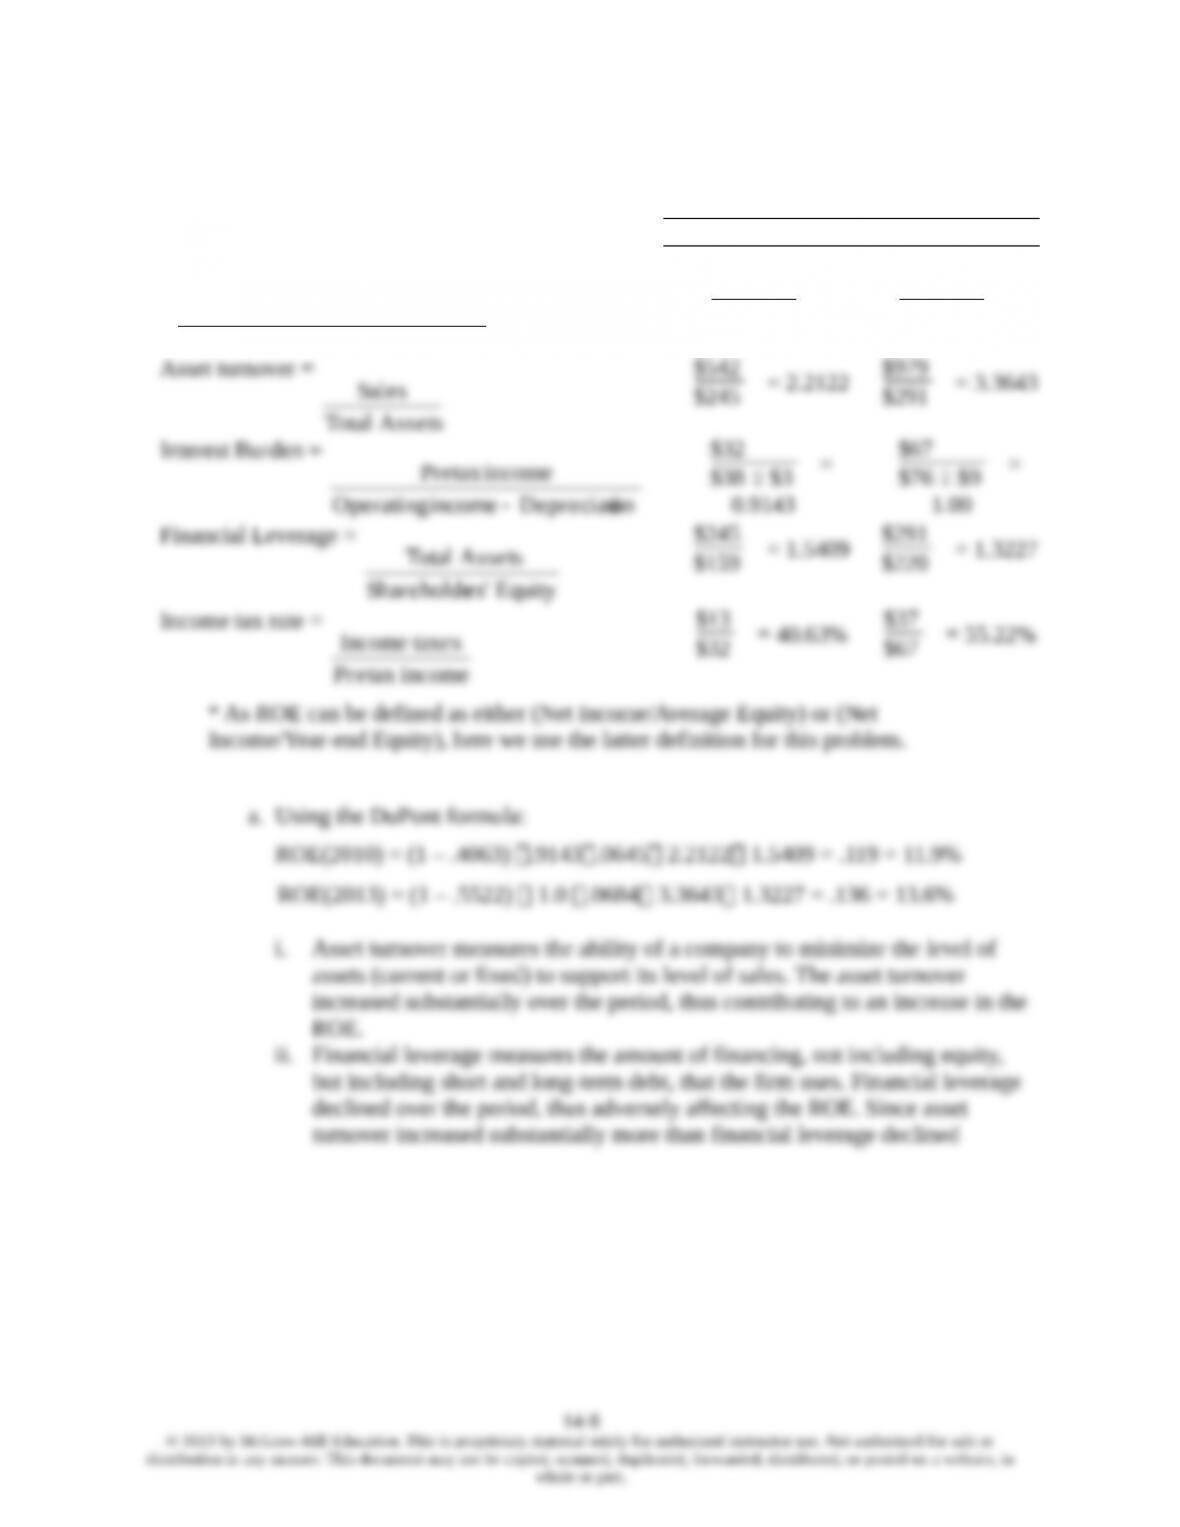
CFA 8
Answer:
2010 2013
Operating margin =
Operating income - Depreciation
Sales
$38 - $3
$542
=
6.45%
$76 - $9
$979
=
6.84%
$245
$159
$220
$32