Chapter 13 – Equity Valuation
CFA 1
Answer:
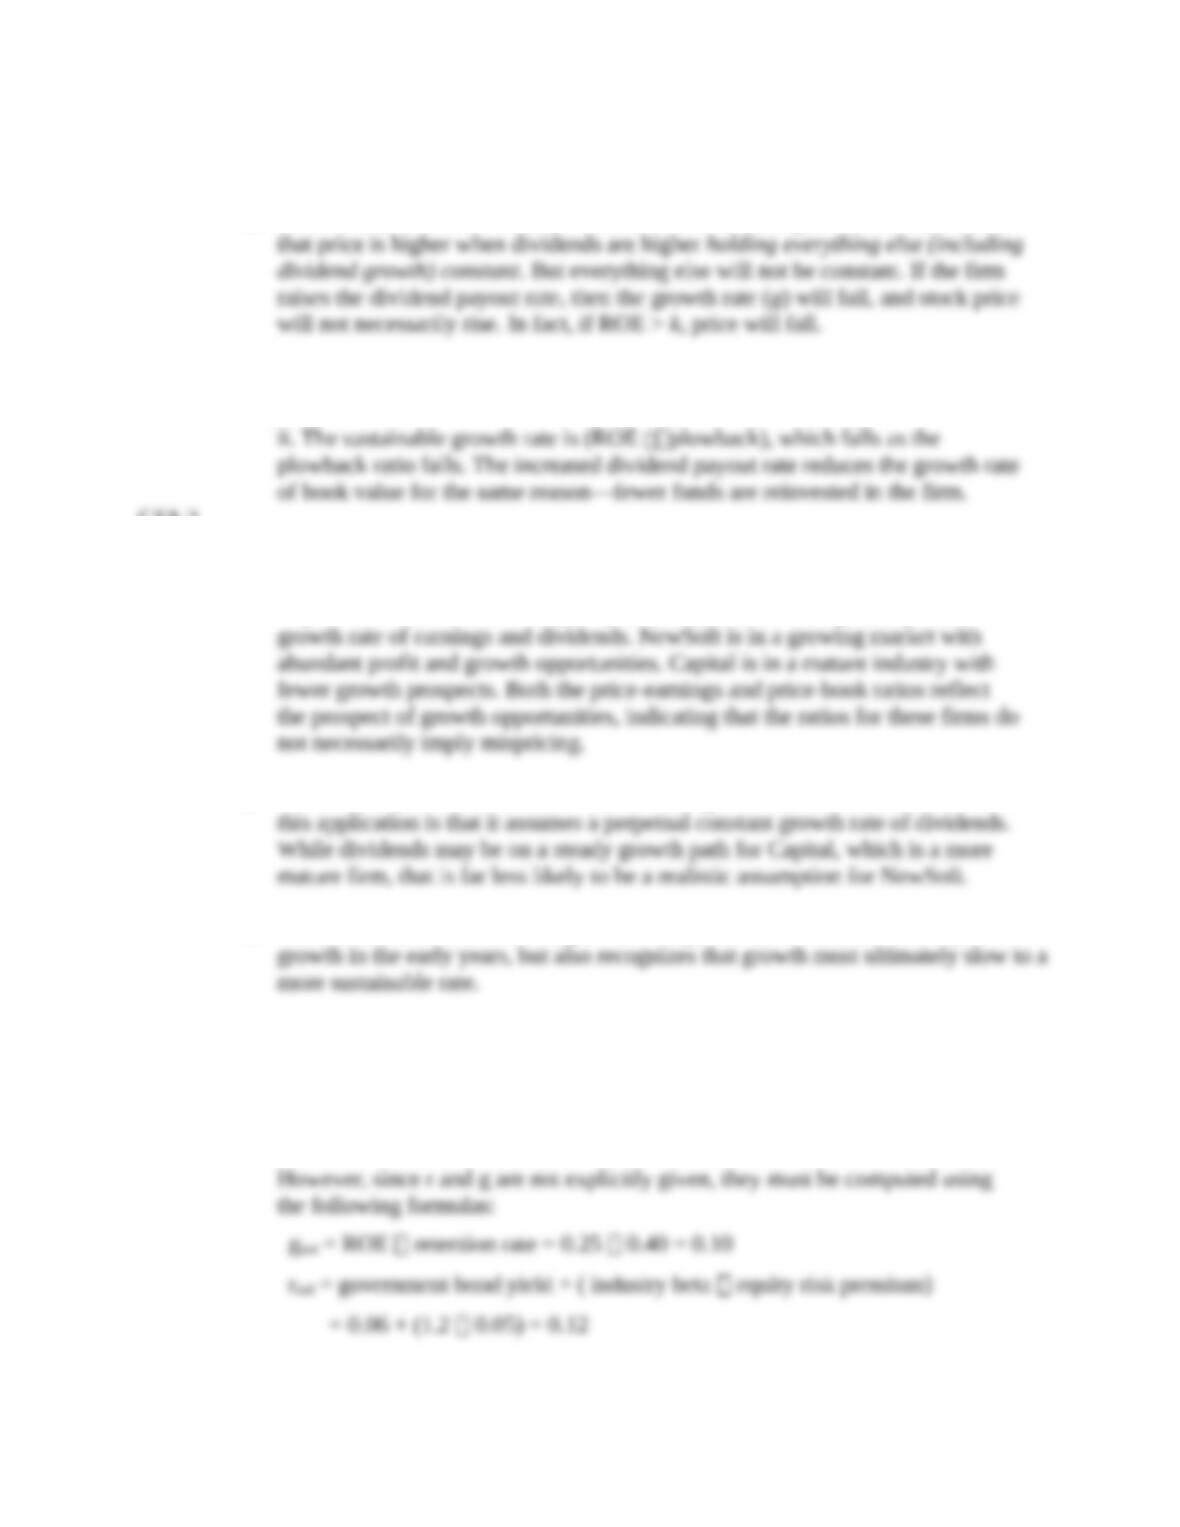
a. This director is confused. In the context of the constant growth model, it is true
b. i. An increase in dividend payout reduces the sustainable growth rate as fewer
funds are reinvested in the firm.
CFA 2
Answer:
a. It is true that NewSoft sells at higher multiples of earnings and book value than
Capital. But this difference may be justified by NewSoft’s higher expected
b. The most important weakness of the constant-growth dividend discount model in
c. NewSoft should be valued using a multi-stage DDM, which allows for rapid
CFA 3
Answer:
a. The industry’s estimated P/E can be computed using the following model:
P0/E1 = payout ratio/(r g)
Therefore:
13-1
© 2013 by McGraw-Hill Education. This is proprietary material solely for authorized instructor use. Not authorized for sale or
distribution in any manner. This document may not be copied, scanned, duplicated, forwarded, distributed, or posted on a website, in
whole or part.
Chapter 13 – Equity Valuation
b.
i. Forecast growth in real GDP would cause P/E ratios to be
ii. Government bond yield would cause P/E ratios to be generally
iii. Equity risk premium would cause P/E ratios to be generally
CFA 4
Answer:
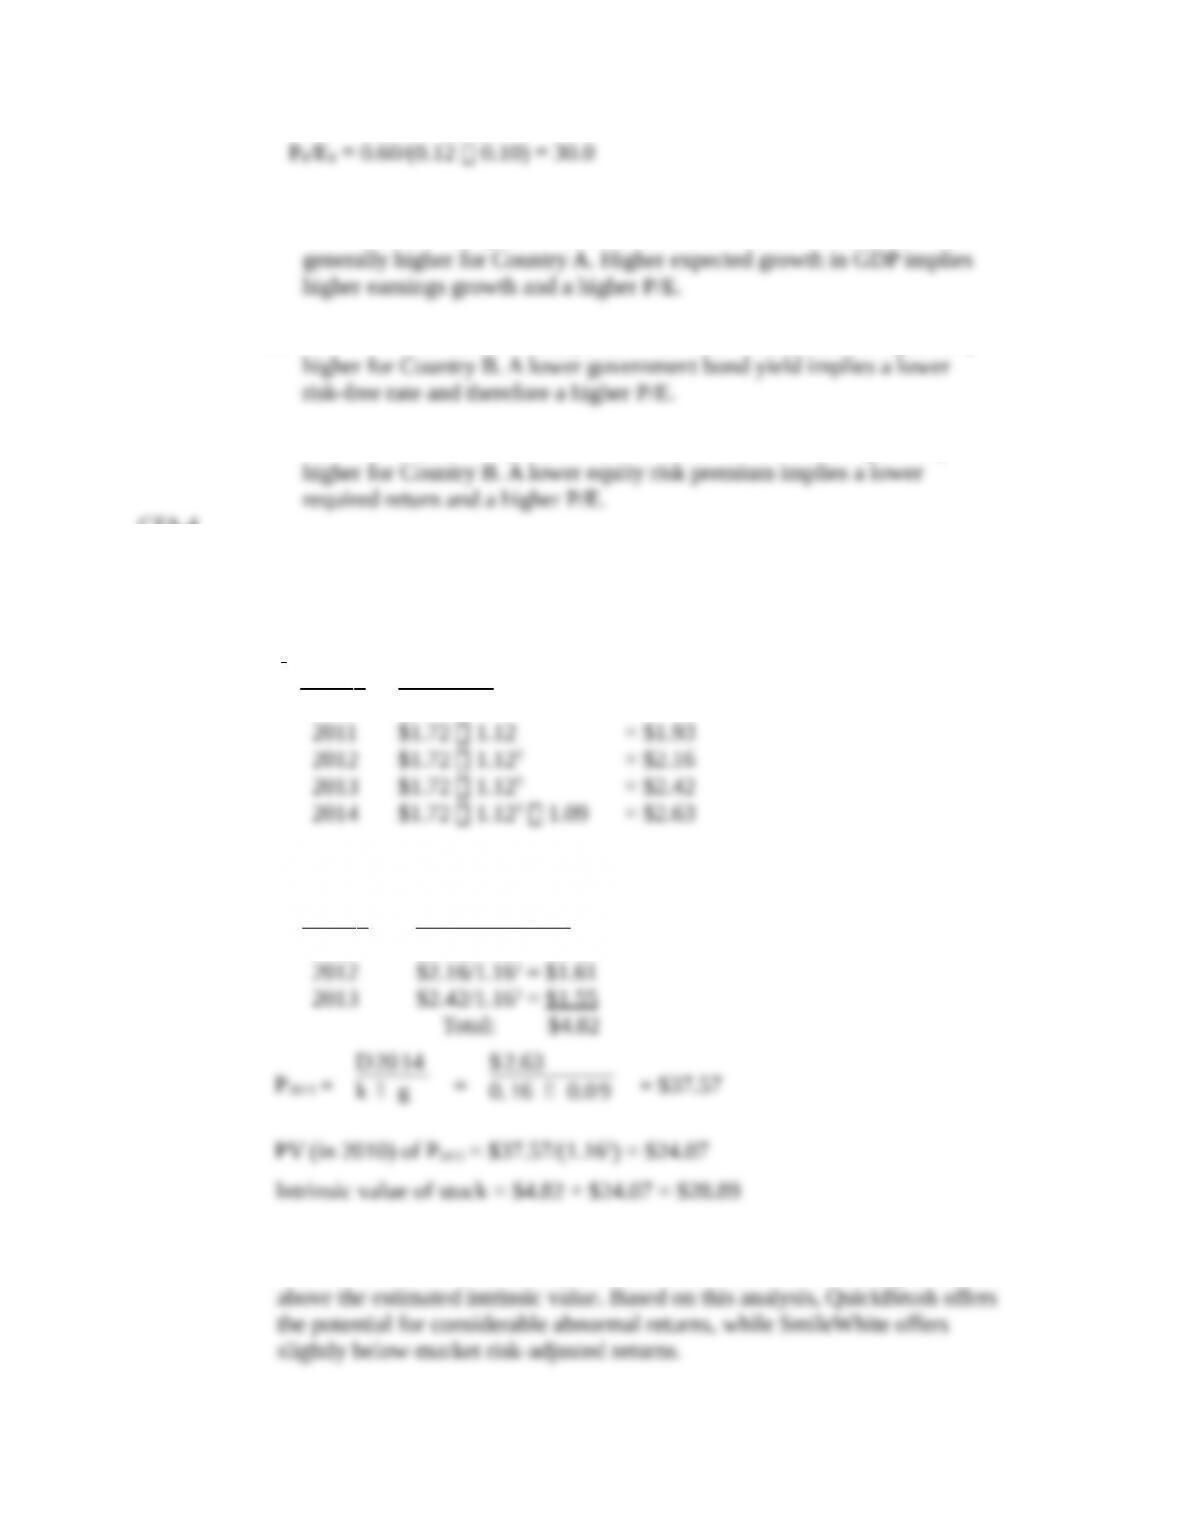
a. k = rf + β [E(rM) – rf ] = 0.045 + 1.15 (0.145 0.045) = 0.16 or 16%
b.
Year Dividends
2010 $1.72
Present value of dividends paid in years 2011 to 2013:
Year PV of Dividends
2011 $1.93/1.16 = $1.66
c. The table presented in the problem indicates that QuickBrush is selling below
intrinsic value, while we have just shown that SmileWhite is selling somewhat
13-2
© 2013 by McGraw-Hill Education. This is proprietary material solely for authorized instructor use. Not authorized for sale or
distribution in any manner. This document may not be copied, scanned, duplicated, forwarded, distributed, or posted on a website, in
whole or part.
Chapter 13 – Equity Valuation
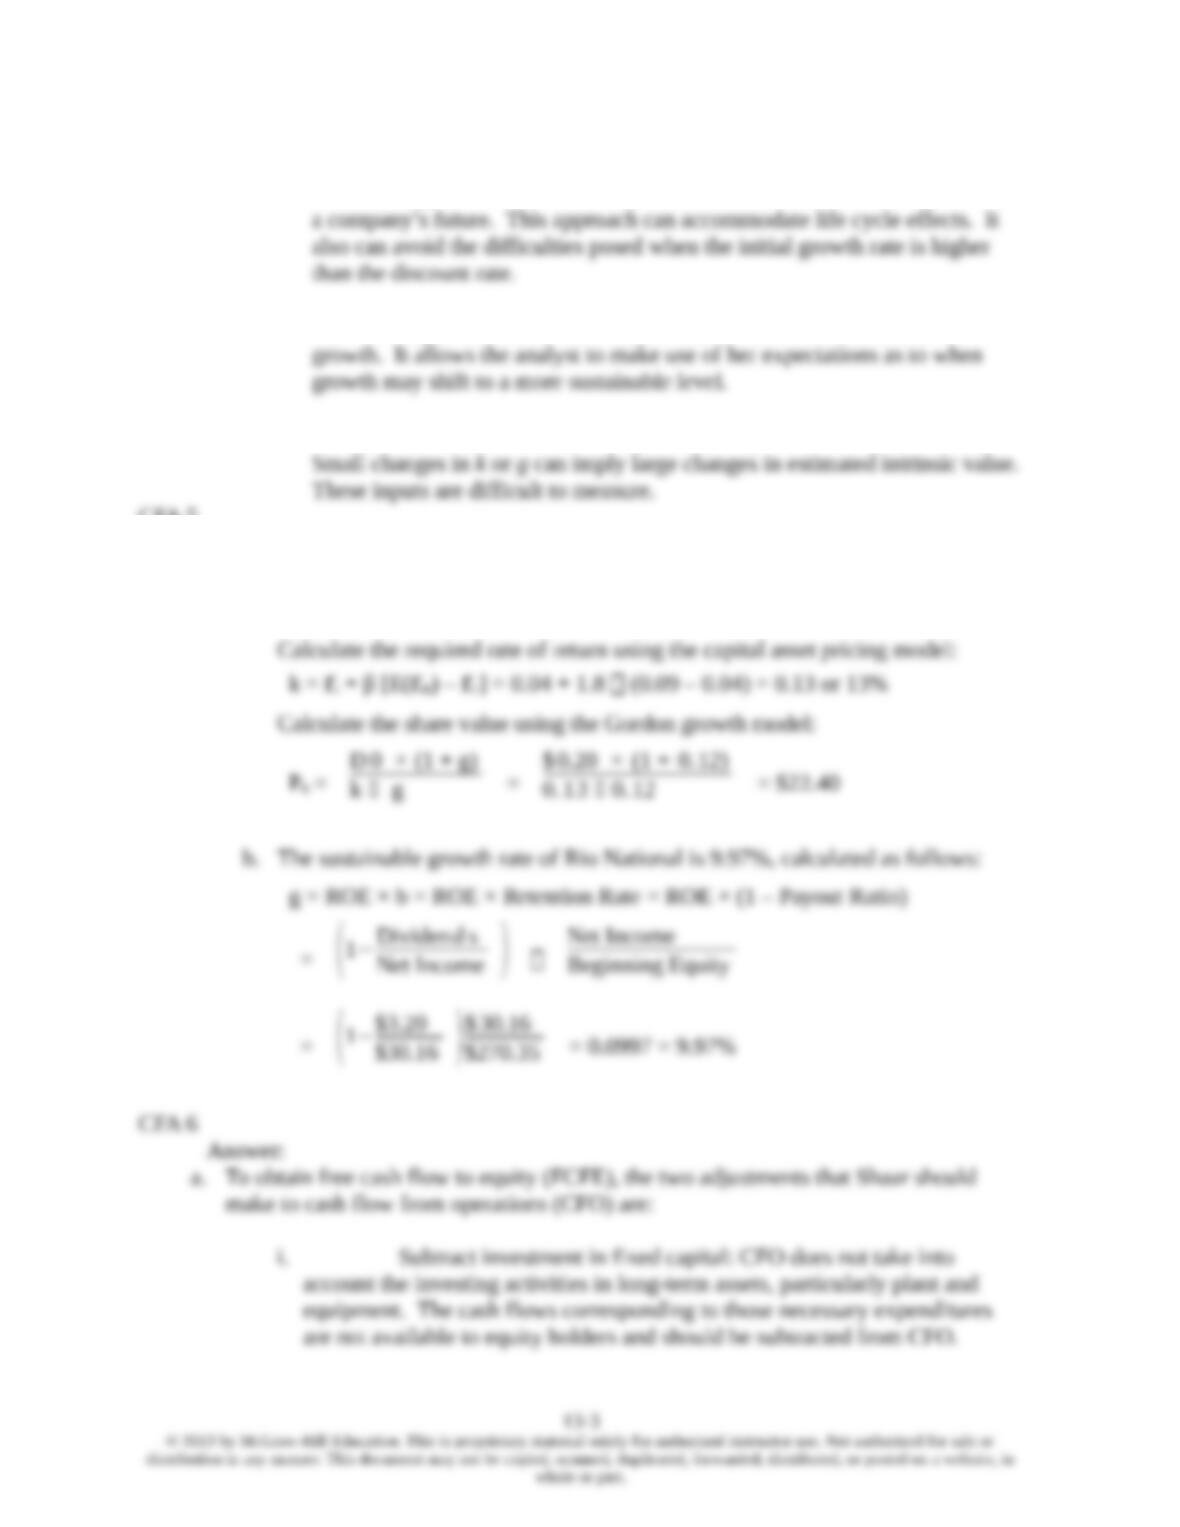
b. Strengths of two-stage DDM compared to constant growth DDM:
The two-stage model allows for separate valuation of two distinct periods in
The two-stage model allows for an initial period of above-sustainable
A weakness of all DDMs is that they are all very sensitive to input values.
CFA 5
Answer:
a. The value of a share of Rio National equity using the Gordon growth model and
the capital asset pricing model is $22.40, as shown below.
Chapter 13 – Equity Valuation
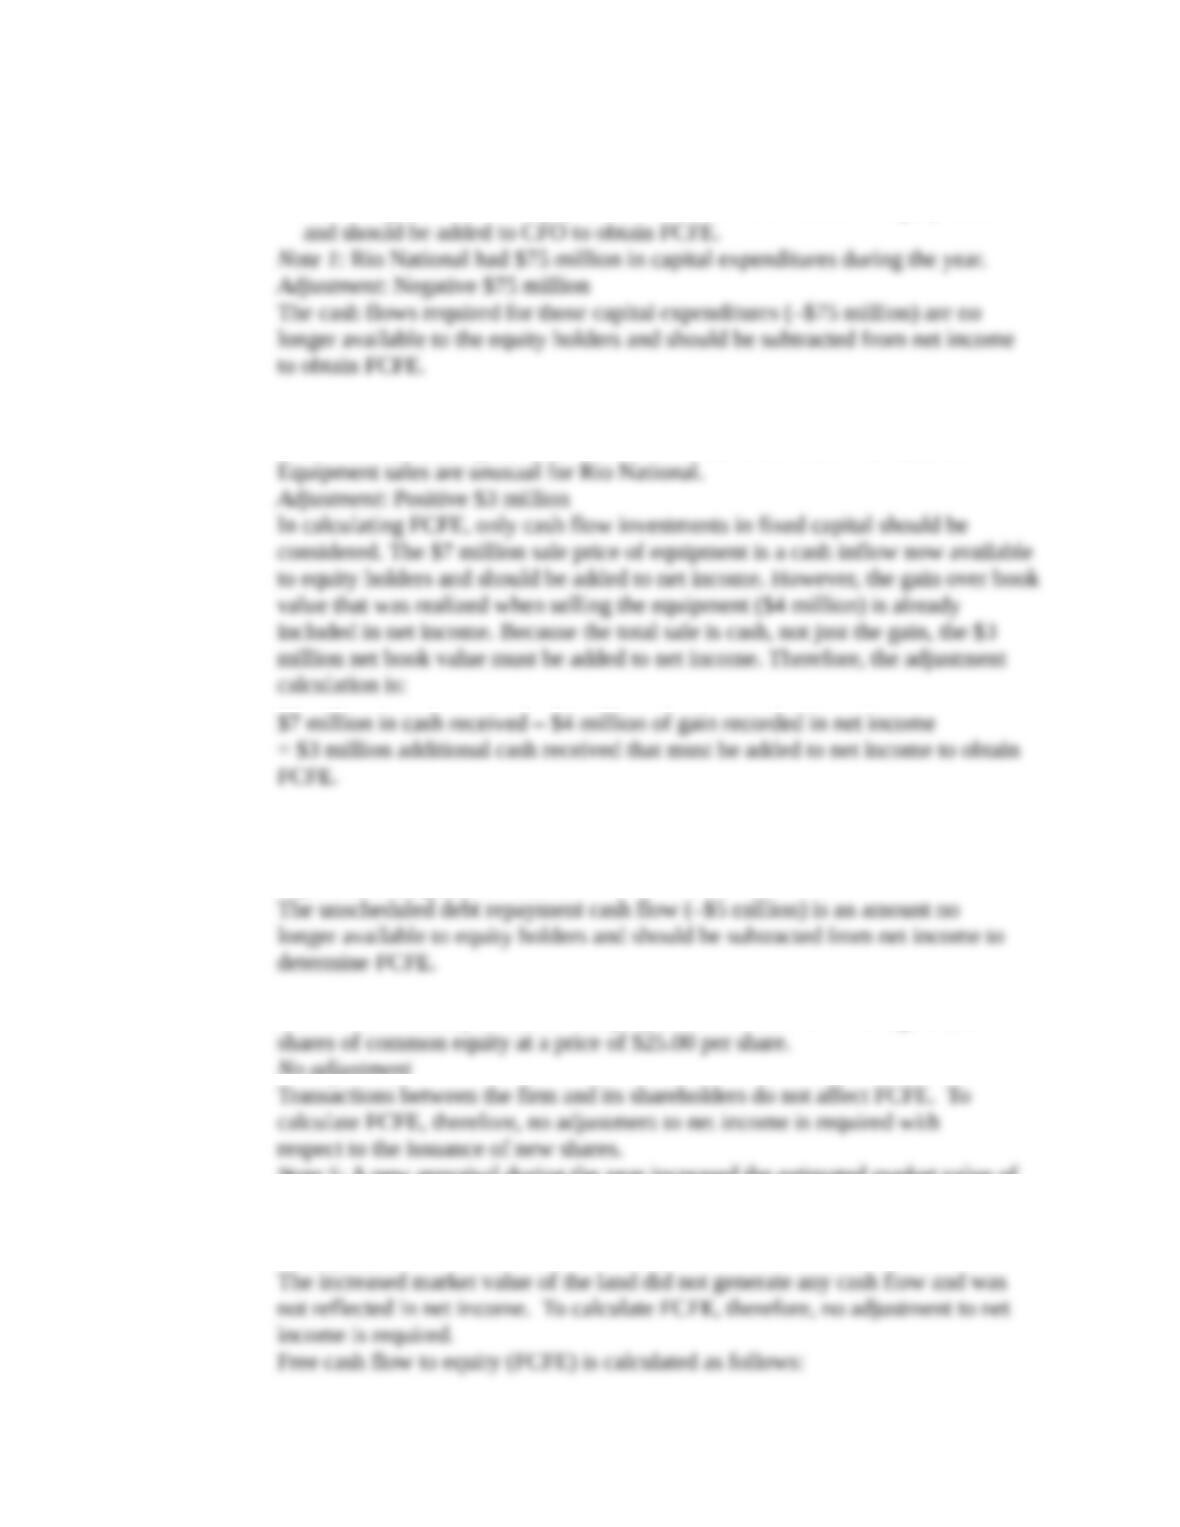
ii. Add net borrowing: CFO does not take into account the amount of
capital supplied to the firm by lenders (e.g., bondholders). The new
borrowings, net of debt repayment, are cash flows available to equity holders
Note 2: A piece of equipment that was originally purchased for $10 million was
sold for $7 million at year-end, when it had a net book value of $3 million.
Note 3: The decrease in long-term debt represents an unscheduled principal
repayment; there was no new borrowing during the year.
Adjustment: Negative $5 million
Note 4: On 1 January 2012, the company received cash from issuing 400,000
No adjustment
Note 5: A new appraisal during the year increased the estimated market value of
land held for investment by $2 million, which was not recognized in 2012
income.
No adjustment
13-4
© 2013 by McGraw-Hill Education. This is proprietary material solely for authorized instructor use. Not authorized for sale or
distribution in any manner. This document may not be copied, scanned, duplicated, forwarded, distributed, or posted on a website, in
whole or part.
Chapter 13 – Equity Valuation
Million $ Explanation
NI = $30.16 From Table 13.6
NCC = +$67.17 $71.17 (depreciation and amortization from Table 13.6)
– $4.00* (gain on sale from Note 2)
FCINV = –$68.00 $75.00 (capital expenditures from Note 1)
– $7.00* (cash on sale from Note 2)
WCINV = –$24.00 –$3.00 (increase in accounts receivable from Table 13.5) +
–$20.00 (increase in inventory from Table 13.5) +
–$1.00 (decrease in accounts payable from Table 13.5)
Net Borrowing = +(–$5.00) –$5.00 (decrease in long-term debt from Table 13.5)
FCFE = $0.33
*Supplemental Note 2 in Table 13.7 affects both NCC and FCINV
CFA 7
Answer:
Rio National
Industry
CFA 8
Answer:
Using a two-stage dividend discount model, the current value of a share of Sundanci is
calculated as follows:
2
3
2
2
1
1
0
)k1(
)gk(
D
)k1(
D
)k1(
D
V
13-5
© 2013 by McGraw-Hill Education. This is proprietary material solely for authorized instructor use. Not authorized for sale or
distribution in any manner. This document may not be copied, scanned, duplicated, forwarded, distributed, or posted on a website, in
whole or part.
Chapter 13 – Equity Valuation
98.43$
14.1
)13.014.0(
5623.0$
14.1
4976.0$
14.1
3770.0$
221
where:
E0 = $0.952
D0 = $0.286
E1 = E0 (1.32)1 = $0.952 1.32 = $1.2566
D1 = E1 0.30 = $1.2566 0.30 = $0.3770
E2 = E0 (1.32)2 = $0.952 (1.32)2 = $1.6588
D2 = E2 0.30 = $1.6588 0.30 = $0.4976
E3 = E0 (1.32)2 1.13 = $0.952 (1.32)3 1.13 = $1.8744
D3 = E3 0.30 = $1.8744 0.30 = $0.5623
CFA 9
Answer:
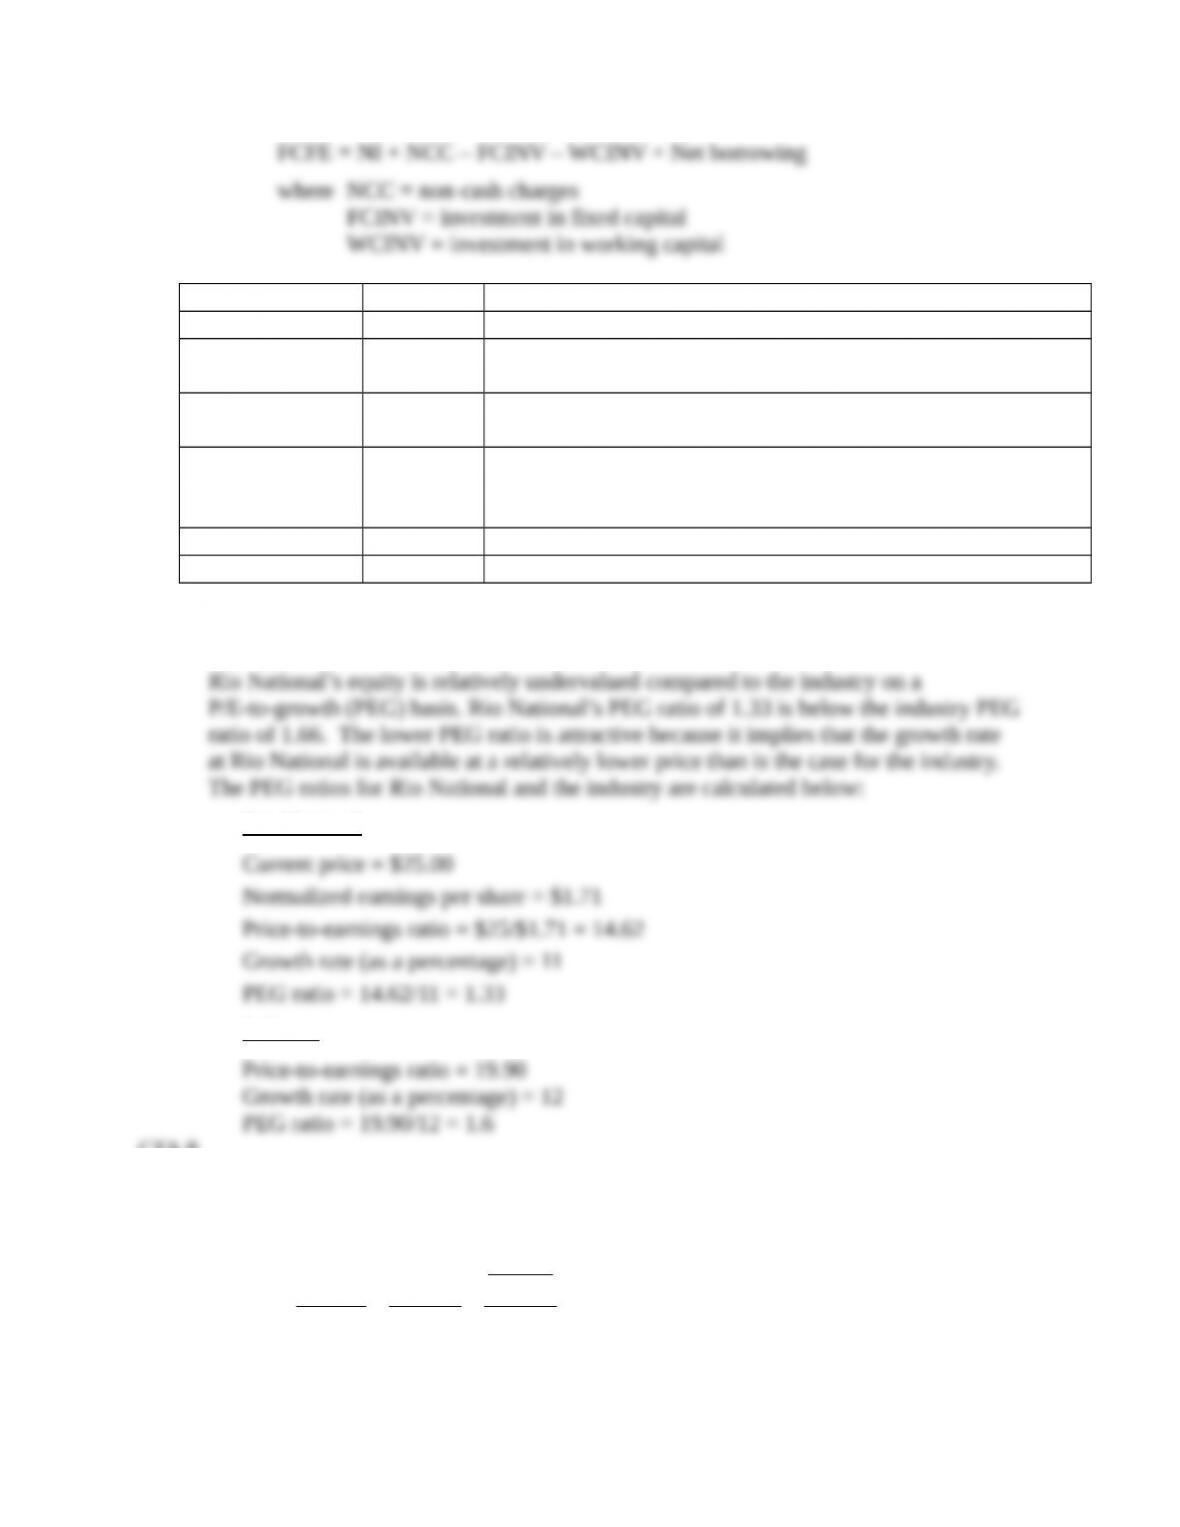
a. Free cash flow to equity (FCFE) is defined as the cash flow remaining after
meeting all financial obligations (including debt payment) and after covering
capital expenditure and working capital needs. The FCFE is a measure of how
much the firm can afford to pay out as dividends, but in a given year may be
more or less than the amount actually paid out.
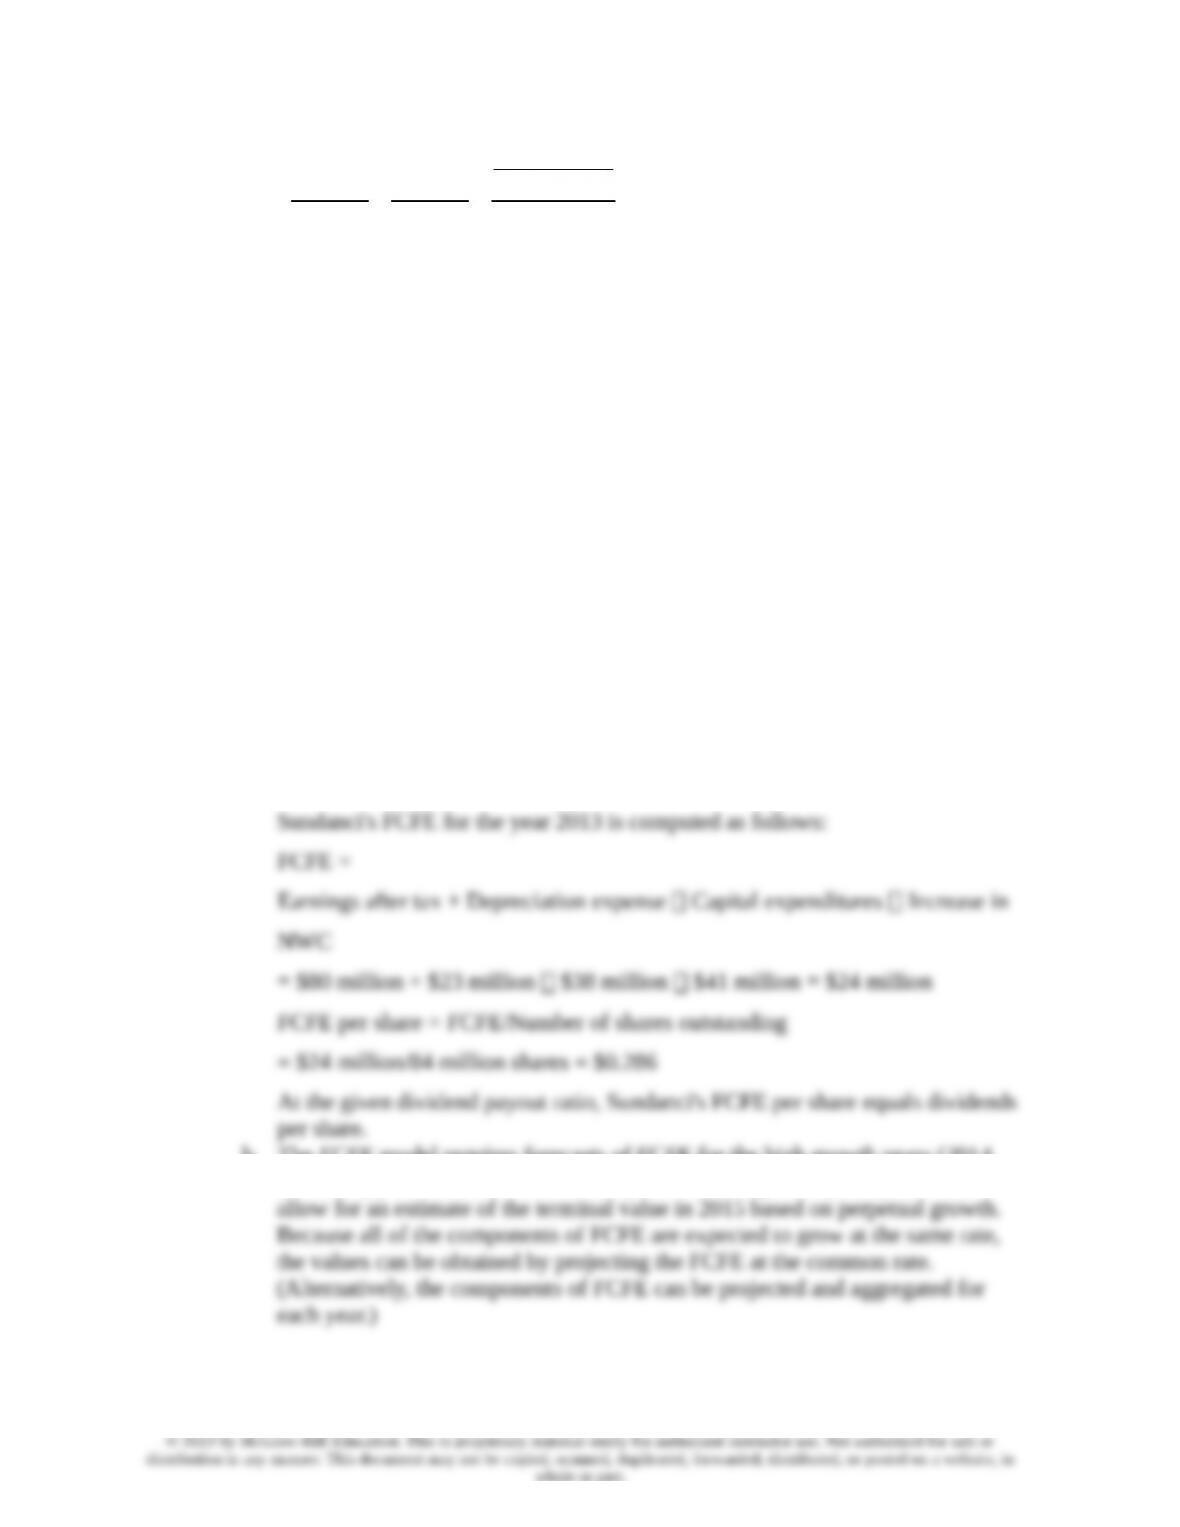
b. The FCFE model requires forecasts of FCFE for the high growth years (2014
and 2015) plus a forecast for the first year of stable growth (2016) in order to
13-6
© 2013 by McGraw-Hill Education. This is proprietary material solely for authorized instructor use. Not authorized for sale or
distribution in any manner. This document may not be copied, scanned, duplicated, forwarded, distributed, or posted on a website, in
whole or part.
Chapter 13 – Equity Valuation
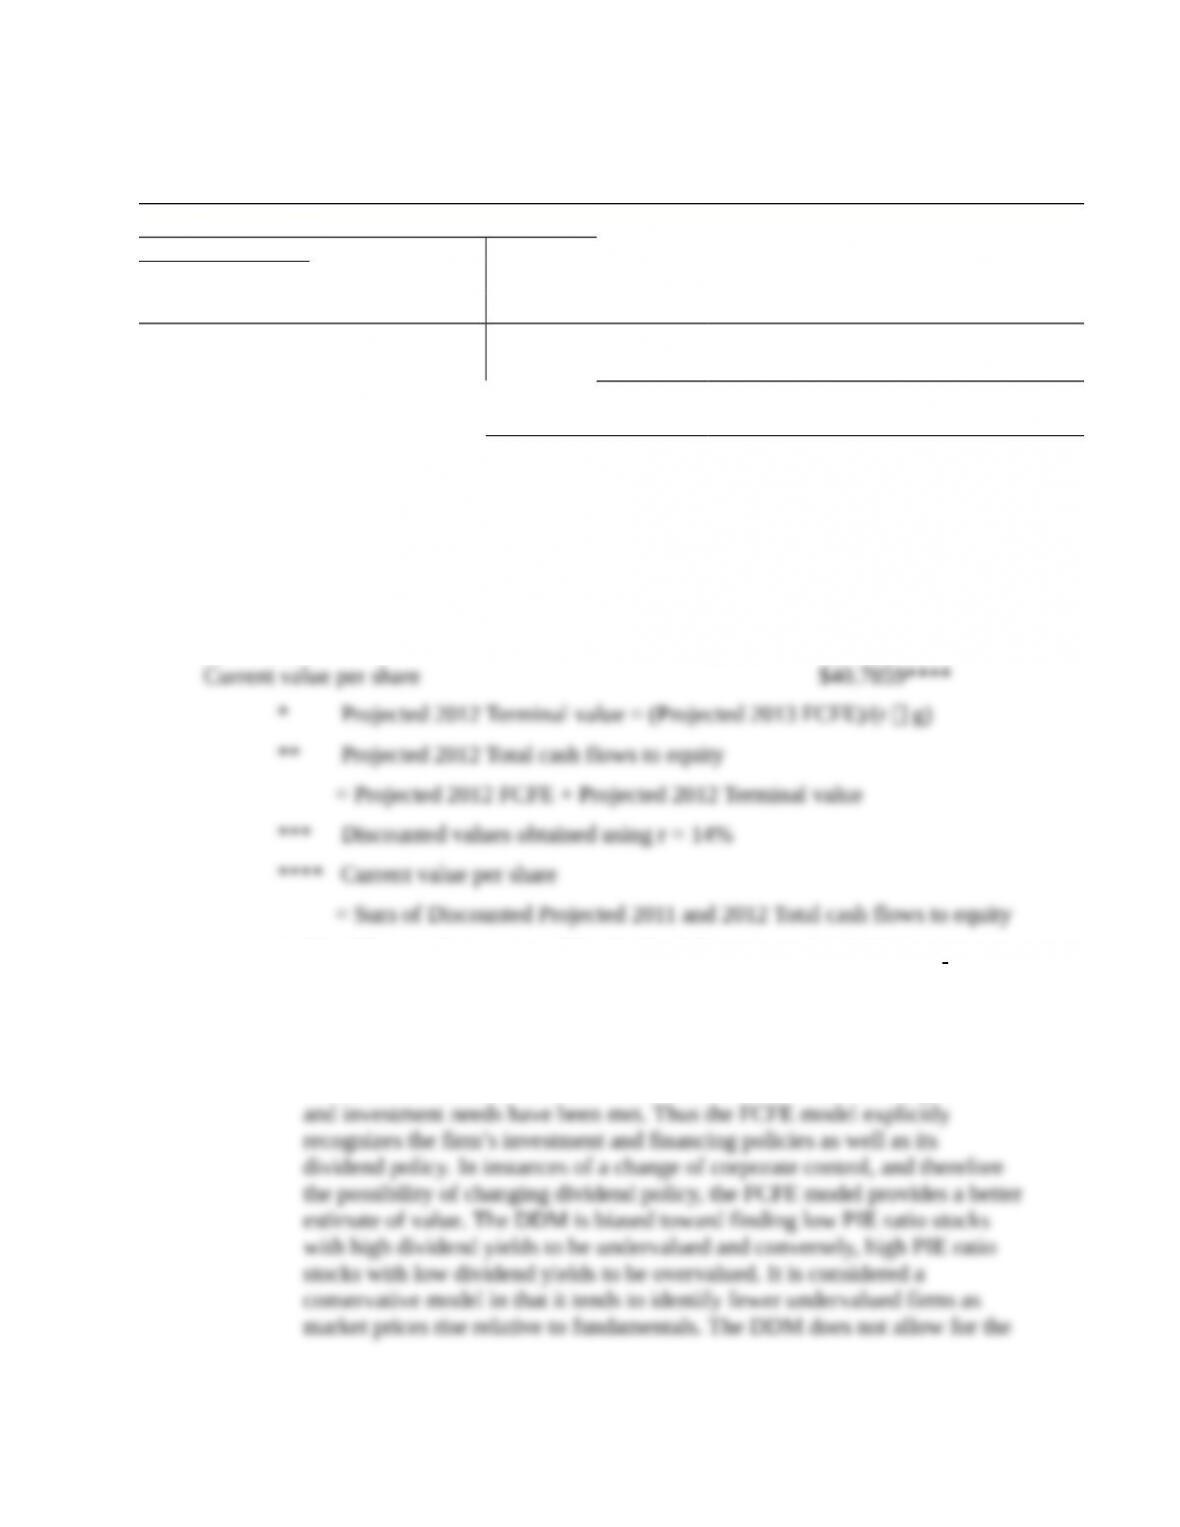
The following table shows the process for estimating Sundanci’s current value
on a per share basis:
Free Cash Flow to Equity
Base Assumptions
Shares outstanding: 84 millions
Required return on equity (r): 14%
Actual
2013
Projected
2014
Projected
2015
Projected
2016
Growth rate (g) 27% 27% 13%
Total Per share
Earnings after tax $80 $0.952 $1.2090 $1.5355 $1.7351
Plus: Depreciation expense $23 $0.274 $0.3480 $0.4419 $0.4994
Less: Capital expenditures $38 $0.452 $0.5740 $0.7290 $0.8238
Less: Increase in net working capital $41 $0.488 $0.6198 $0.7871 $0.8894
Equals: FCFE $24 $0.286 $0.3632 $0.4613 $0.5213
Terminal value $52.1300*
Total cash flows to equity $0.3632 $52.5913**
Discounted value $0.3186*** $40.4673***
c. i. The following limitations of the dividend discount model (DDM) are
addressed by the FCFE model. The DDM uses a strict definition of cash
flows to equity, i.e. the expected dividends on the common stock. In fact,
taken to its extreme, the DDM cannot be used to estimate the value of a stock
that pays no dividends. The FCFE model expands the definition of cash flows
to include the balance of residual cash flows after all financial obligations
13-7
© 2013 by McGraw-Hill Education. This is proprietary material solely for authorized instructor use. Not authorized for sale or
distribution in any manner. This document may not be copied, scanned, duplicated, forwarded, distributed, or posted on a website, in
whole or part.
Chapter 13 – Equity Valuation
ii. The following limitations of the DDM are not addressed by the FCFE model.
Both two-stage valuation models allow for two distinct phases of growth, an
initial finite period where the growth rate is abnormal, followed by a stable
CFA 11
Answer:
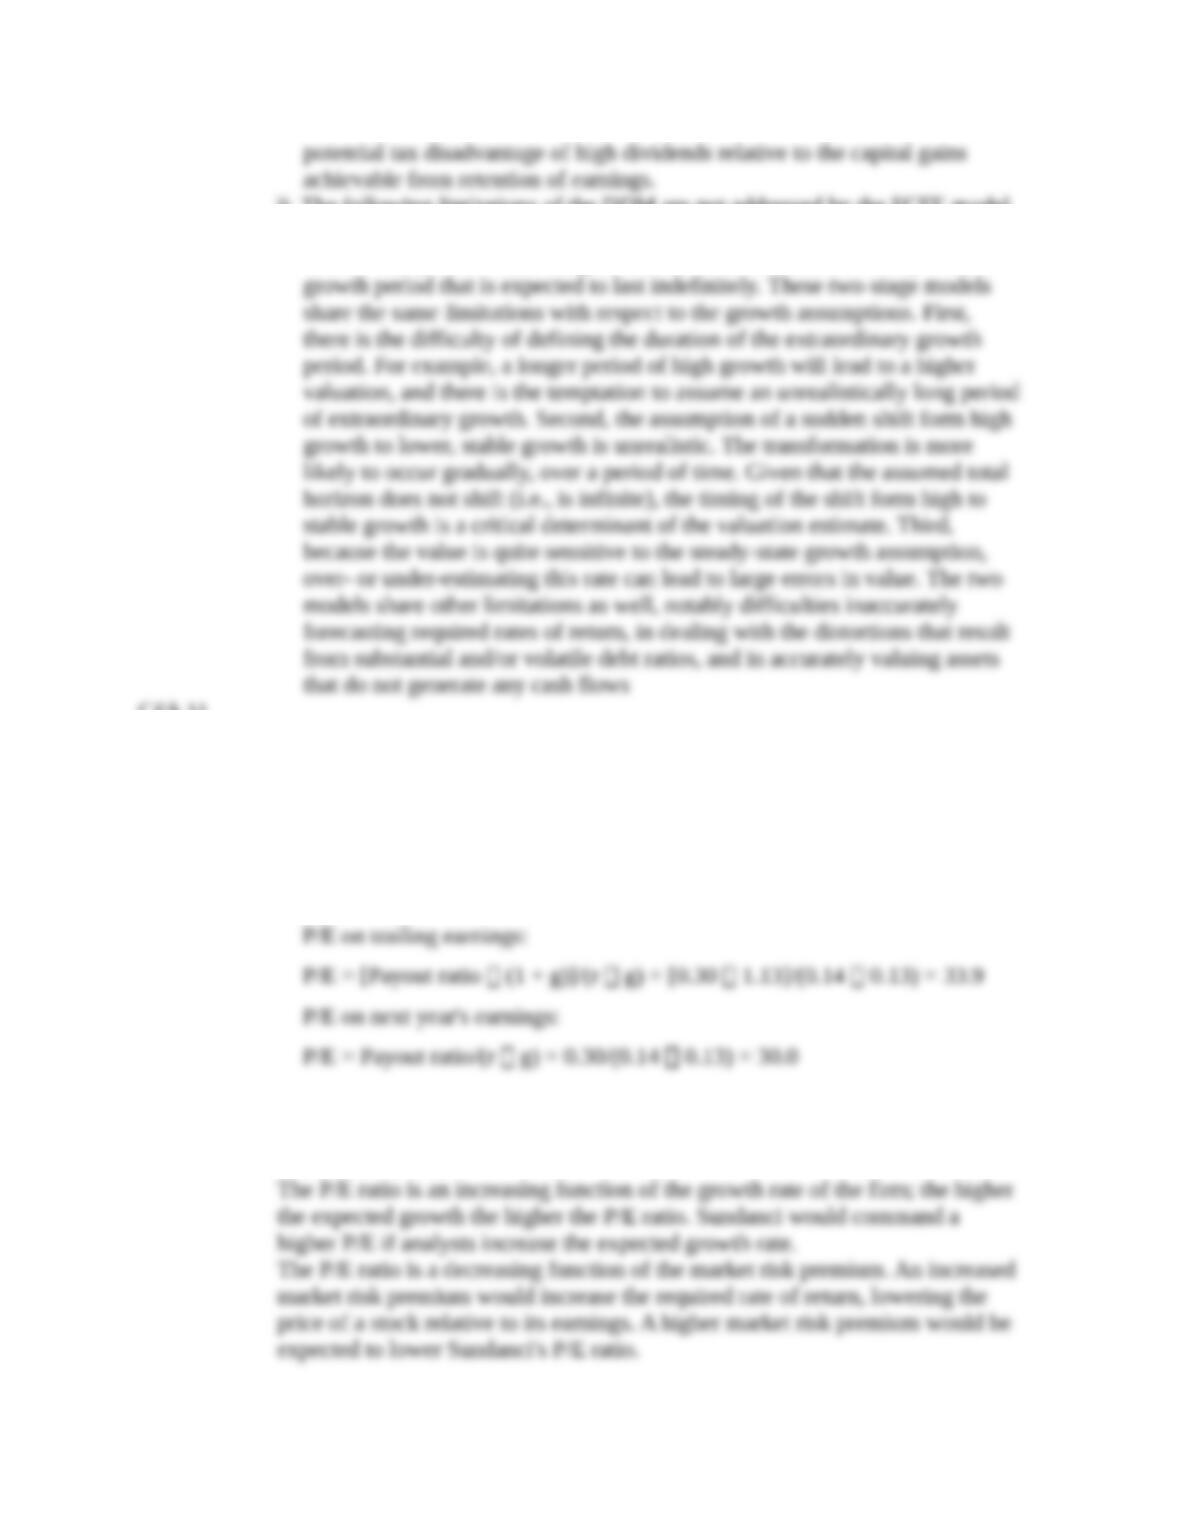
a. The formula for calculating a price earnings ratio (P/E) for a stable growth firm
is the dividend payout ratio divided by the difference between the required rate
of return and the growth rate of dividends. If the P/E is calculated based on
trailing earnings (year 0), the payout ratio is increased by the growth rate. If the
P/E is calculated based on next year’s earnings (year 1), the numerator is the
payout ratio.
b. The P/E ratio is a decreasing function of riskiness; as risk increases the P/E ratio
decreases. Increases in the riskiness of Sundanci stock would be expected to
lower the P/E ratio.
13-8
© 2013 by McGraw-Hill Education. This is proprietary material solely for authorized instructor use. Not authorized for sale or
distribution in any manner. This document may not be copied, scanned, duplicated, forwarded, distributed, or posted on a website, in
whole or part.
Chapter 13 – Equity Valuation
13-9
© 2013 by McGraw-Hill Education. This is proprietary material solely for authorized instructor use. Not authorized for sale or
distribution in any manner. This document may not be copied, scanned, duplicated, forwarded, distributed, or posted on a website, in
whole or part.