
Chapter 06 – Measuring and Evaluating the Performance of Banks and Their Principal Competitors
6-1
CHAPTER 6
MEASURING AND EVALUATING THE PERFORMANCE OF BANKS AND THEIR
PRINCIPAL COMPETITORS
Goal of This Chapter: The purpose of this chapter is to discover what analytical tools can be
applied to a bank’s financial statements so that management and the public can identify the most
critical problems inside each bank and develop ways to deal with those problems.
Key Topics in this Chapter
• Stock Values and Profitability Ratios
• Measuring Credit, Liquidity, and Other Risks
• Measuring Operating Efficiency
• Performance of Competing Financial Firms
• Size and Location Effects
• Appendix: Using Financial Ratios and Other Analytical Tools to Track Financial
Firm Performance—The UBPR and BHCPR
Chapter Outline
I. Introduction:
II Evaluating Performance
A. Determining Long-Range Objectives
B. Maximizing the Value of the Firm: A Key Objective for Nearly All Financial-
Service Institutions
C. Profitability Ratios: A Surrogate for Stock Values
1. Key Profitability Ratios
2. Interpreting Profitability Ratios
D. Useful Profitability Formulas for Banks and Other Financial-Service Companies
E. Return on Equity and Its Principal Components
F. The Return on Assets and Its Principal Components
G. What a Breakdown of Profitability Measures Can Tell Us
H. Measuring Risk in Banking and Financial Services
1. Credit Risk
2. Liquidity Risk
3. Market Risk
a. Price Risk
b. Interest Rate Risk
4. Foreign Exchange and Sovereign Risk
5. Off-Balance-Sheet Risk
6. Operational (Transactional) Risk
7. Legal and Compliance Risks
8. Reputation Risk
Chapter 06 – Measuring and Evaluating the Performance of Banks and Their Principal Competitors
6-2
9. Strategic Risk
10. Capital Risk
I. Other Goals in Banking and Financial-Services Management
III. Performance Indicators among Banking’s Key Competitors
IV. The Impact of Size on Performance
A. Size, Location, and Regulatory Bias in Analyzing the Performance of Banks and
Competing Financial Institutions
V. Summary of the Chapter
Appendix to the Chapter – Using Financial Ratios and Other Analytical Tools to Track Financial-
Firm Performance-The UBPR and BHCPR
Concept Checks
6-1. Why should banks and other corporate financial firms be concerned about their level of
profitability and exposure to risk?
Banks in the U.S. and most other countries are like private businesses that must attract capital
6-2. What individuals or groups are likely to be interested in these dimensions of performance
for a financial institution?
6-3. What factors influence the stock price of a financial-service corporation?
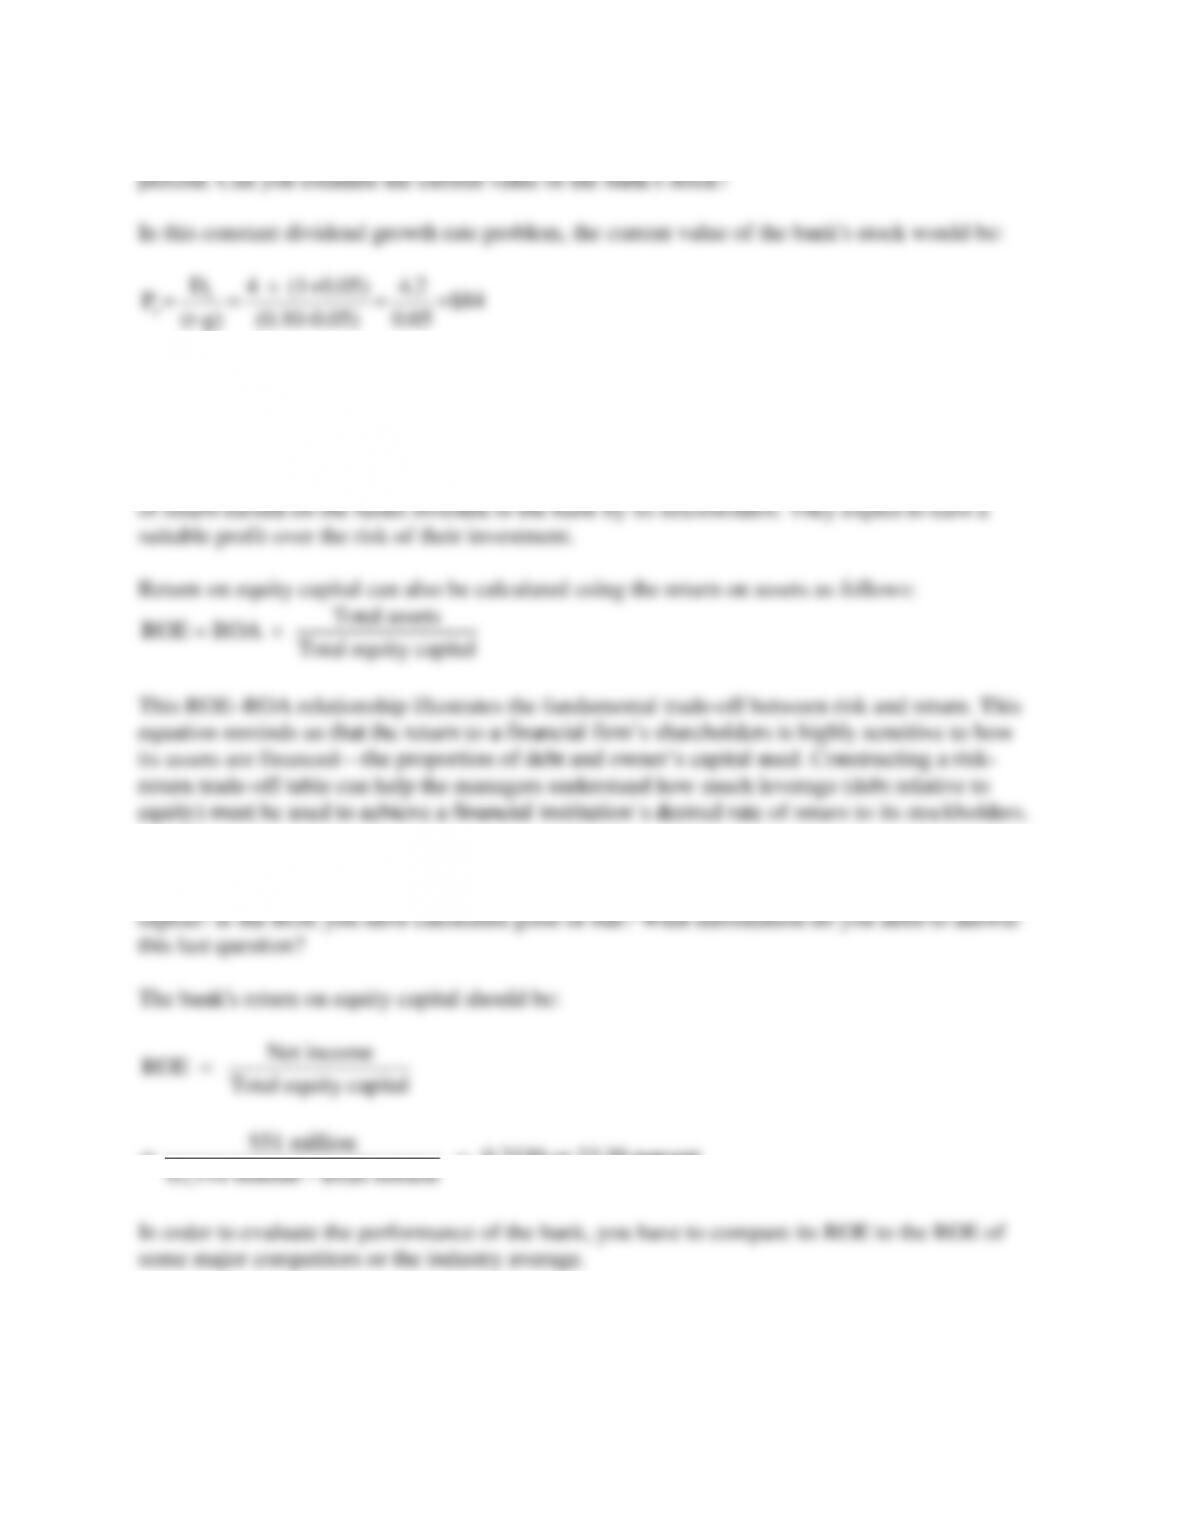
A bank’s stock price is affected by all those factors affecting its profitability and risk exposure,
Chapter 06 – Measuring and Evaluating the Performance of Banks and Their Principal Competitors
minimum required return-to-equity capital based on the bank’s perceived level of risk is 10
o
(r–g) (0.10-0.05) 0.05
6-5. What is return on equity capital, and what aspect of performance is it supposed to
measure? Can you see how this performance measure might be useful to the managers of
financial firms?
Return on equity capital is the ratio of net income over total equity capital. It represents the rate
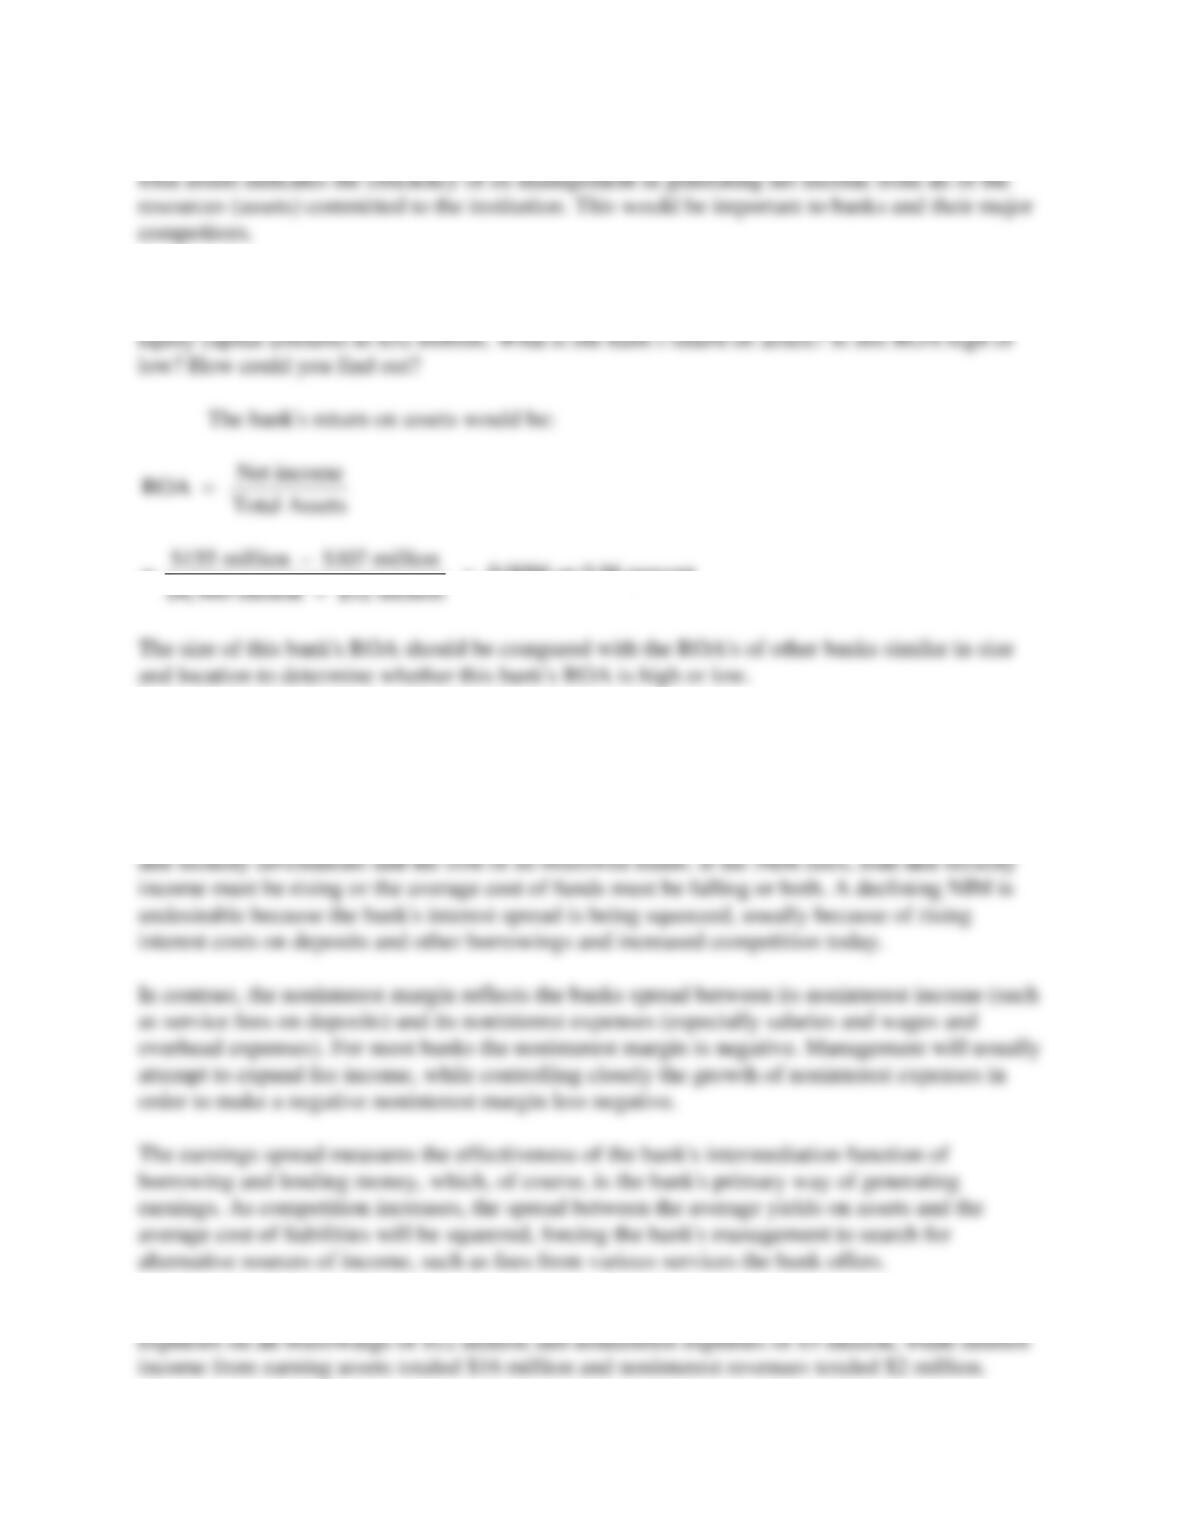
6-6 Suppose a bank reports that its net income for the current year is $51 million, its assets
total $1,144 million, and its liabilities amount to $926 million. What is its return on equity
Chapter 06 – Measuring and Evaluating the Performance of Banks and Their Principal Competitors
Return on assets is the ratio of net income over total assets. The rate of return secured on a bank’s
6-8. A bank estimates that its total revenues will amount to $155 million and its total expenses
(including taxes) will equal $107 million this year. Its liabilities total $4,960 million while its
Chapter 06 – Measuring and Evaluating the Performance of Banks and Their Principal Competitors
6-5
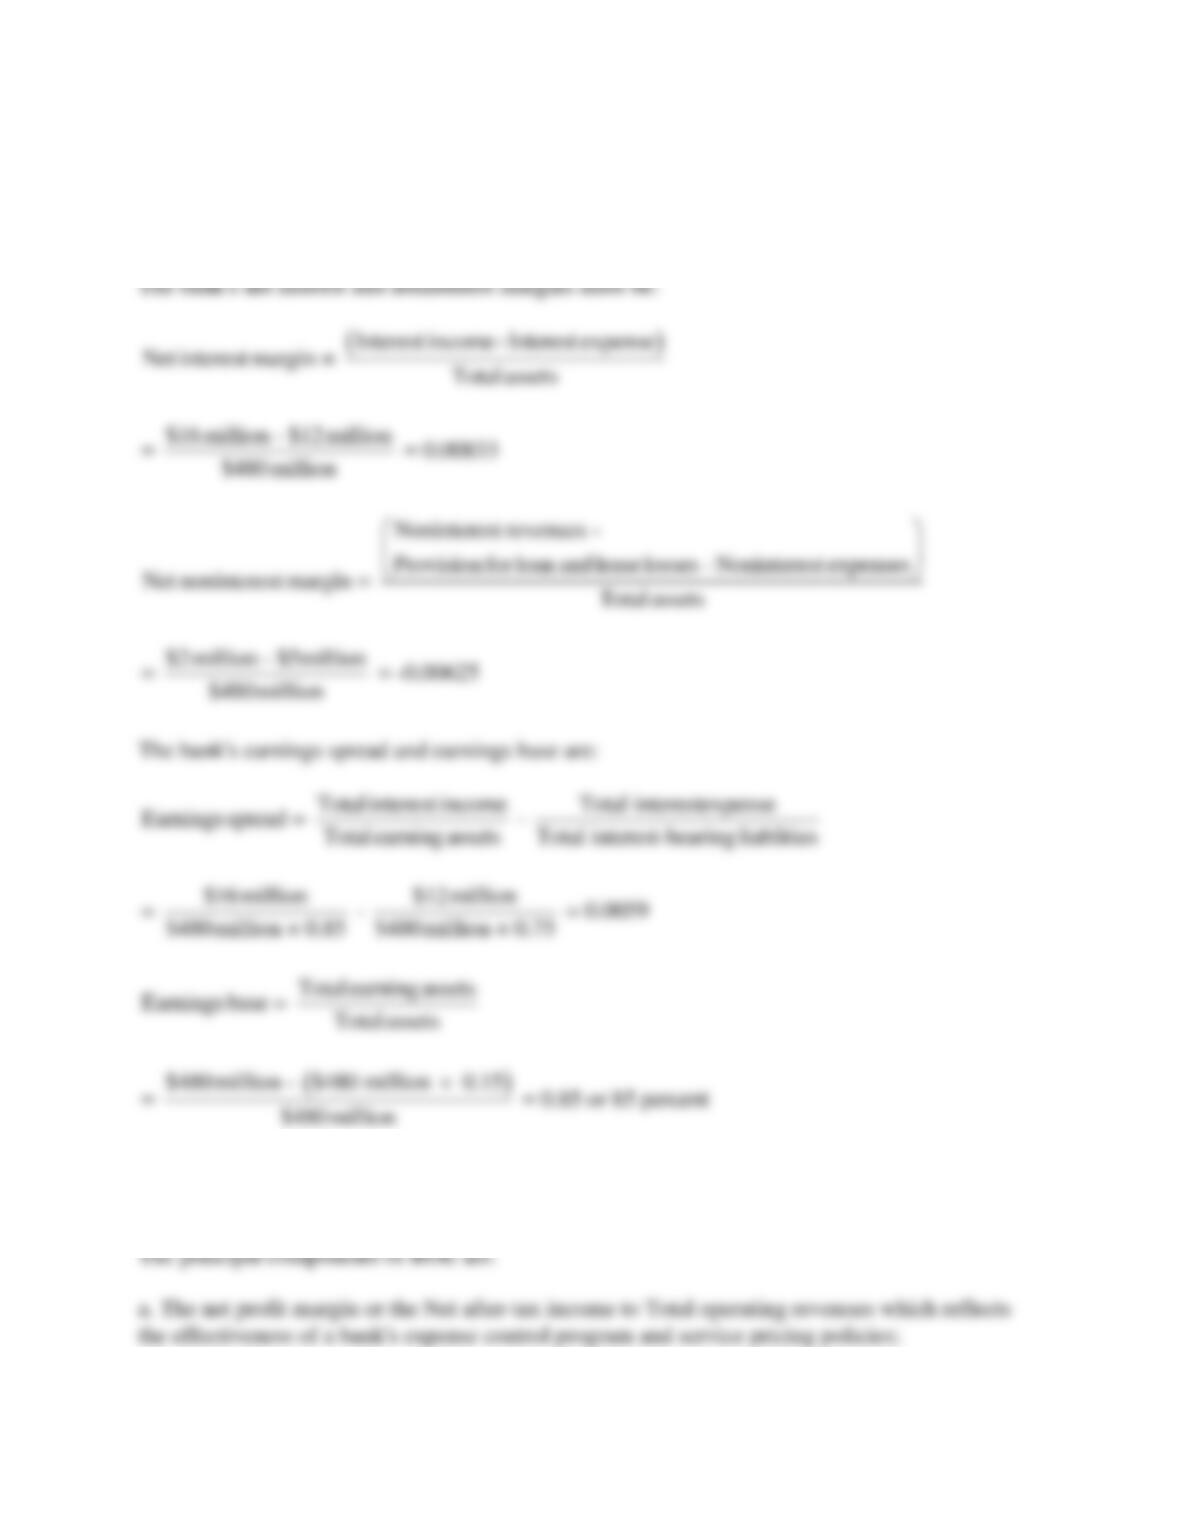
Suppose further that assets amounted to $480 million, of which earning assets represented 85
percent of that total while total interest-bearing liabilities amounted to 75 percent of total assets.
See if you can determine this bank’s net interest and noninterest margins and its earnings base
and earnings spread for the most recent year.
$480million
6-11. What are the principal components of ROE, and what does each of these components
measure?
Chapter 06 – Measuring and Evaluating the Performance of Banks and Their Principal Competitors
6-6
b. The degree of asset utilization or the ratio of Total operating revenues to Total assets which
6-12. Suppose a bank has an ROA of 0.80 percent and an equity multiplier of 12X. What is its
ROE = 9.60 percent = 0.60 percent × Equity multiplier
9.60 percent
Equity Multiplier 16X
0.60 percent
==
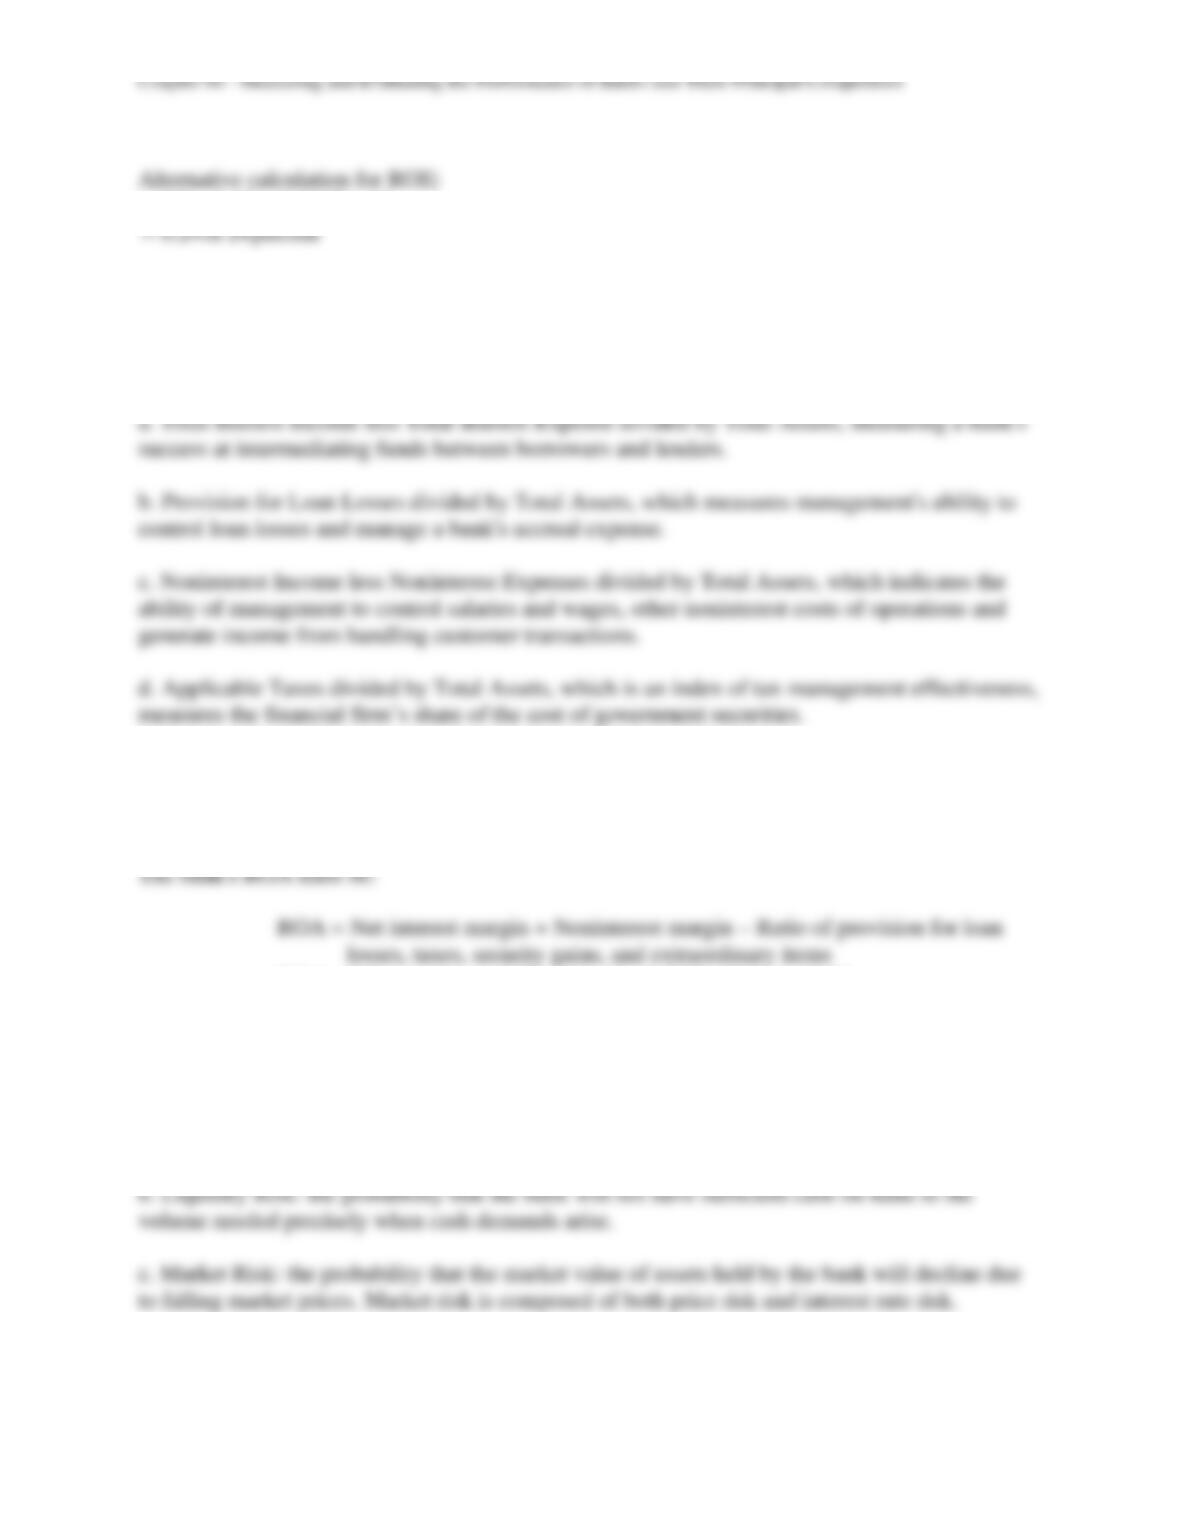
6-13. Suppose a bank reports net income of $12, pre-tax net income of $15, operating revenues
of $100, assets of $600, and $50 in equity capital. What is the bank’s ROE? Tax-management
efficiency indicator? Expense control efficiency indicator? Asset management efficiency
$50
6-7
= 0.8 × 0.15 × 0.1667 × 12
= 0.24or 24percent
6-14. What are the most important components of ROA, and what aspects of a financial
institution’s performance do they reflect?
The principal components of ROA are:
6-15. If a bank has a net interest margin of 2.50%, a noninterest margin of −1.85%, and a ratio
of provision for loan losses, taxes, security gains, and extraordinary items of −0.47%, what is its
ROA?
ROA = 2.5 percent + (−1.85 percent) – (−0.47 percent) = 1.12 percent
6-16. To what different kinds of risk are banks and their financial-service competitors subjected
today?
a. Credit Risk: the probability that the loans and securities the bank holds will not pay out as
promised.
Chapter 06 – Measuring and Evaluating the Performance of Banks and Their Principal Competitors
6-8
Price Risk: the probability or possibility that the value of bond portfolios and
stockholders’ equity may decline due to market prices movement against the financial
firm.
Interest-Rate Risk: the possibility or probability that the interest rates will change,
subjecting the bank to incur a lower margin of profit or a lower value for the firm’s
capital.
6-17. What items on a bank’s balance sheet and income statement can be used to measure its
risk exposure? To what other financial institutions do these risk measures seem to apply?
There are several alternative measures of risk in banking and financial service firms. Capital risk
6-9
funds.
6-18. A bank reports that the total amount of its net loans and leases outstanding is $936
million, its assets total $1,324 million, its equity capital amounts to $110 million, and it holds
1. Liquidity Risk:
Net Loans and Leases $936million
= = 0.706949or 70.69percent
Total Assets $1,324 million
2. Interest Rate Risk:
Uninsured Deposits $243million
= = 0.211304or 21.13percent
Total Deposits $1,150 million
3. Capital Risk:
Equity Capital $130million
= = 0.09009or 9.01percent
Risk Assets $1,443 million
Market Valueof Assets $1,443 million
4. Credit Risk:
Nonperforming Assets $43million
= = 0.04594or 4.59percent
Net Loans and Leases $936 million
Charge-offs of Loans $21million
= = 0.022436or 2.24percent
Total Loans and Leases $936 million
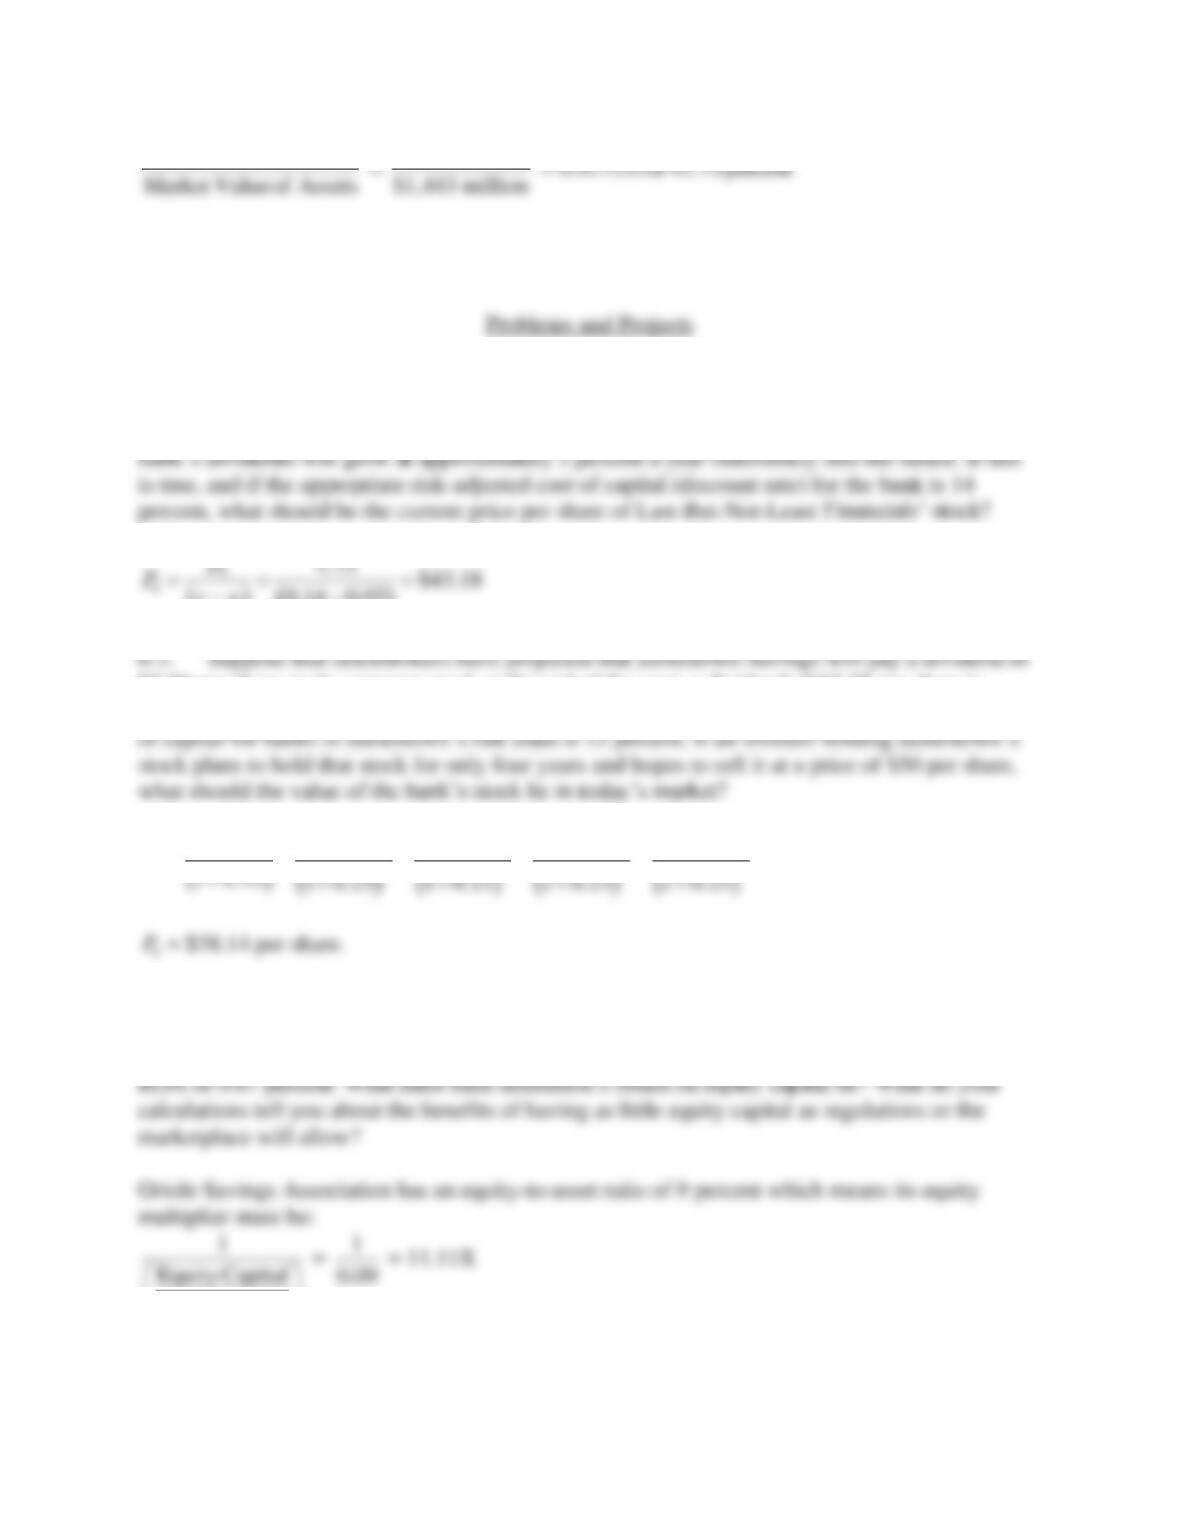
5. Price Risk:
Chapter 06 – Measuring and Evaluating the Performance of Banks and Their Principal Competitors
Book Value of Assets $1,324million
= = 0.917533or91.75percent
Market Valueof Assets $1,443 million
Problems and Projects
6-1. An investor holds the stock of Last-But-Not-Least Financials and expects to receive a
dividend of $4.75 per share at the end of the year. Stock analysts recently predicted that the
( ) ( )
1
0
4.75 $43.18
0.14 0.03
D
−−
$2.50 per share on its common stock at the end of the year; a dividend of $3.25 per share is
expected for the next year, and $4.00 per share in the following two years. The risk-adjusted cost
( ) ( ) ( ) ( ) ( )
02 3 4 4
2.50 3.25 4 4 50
1 0.15 1 0.15 1 0.15 1 0.15 1 0.15
P= + + + +
++ + + +
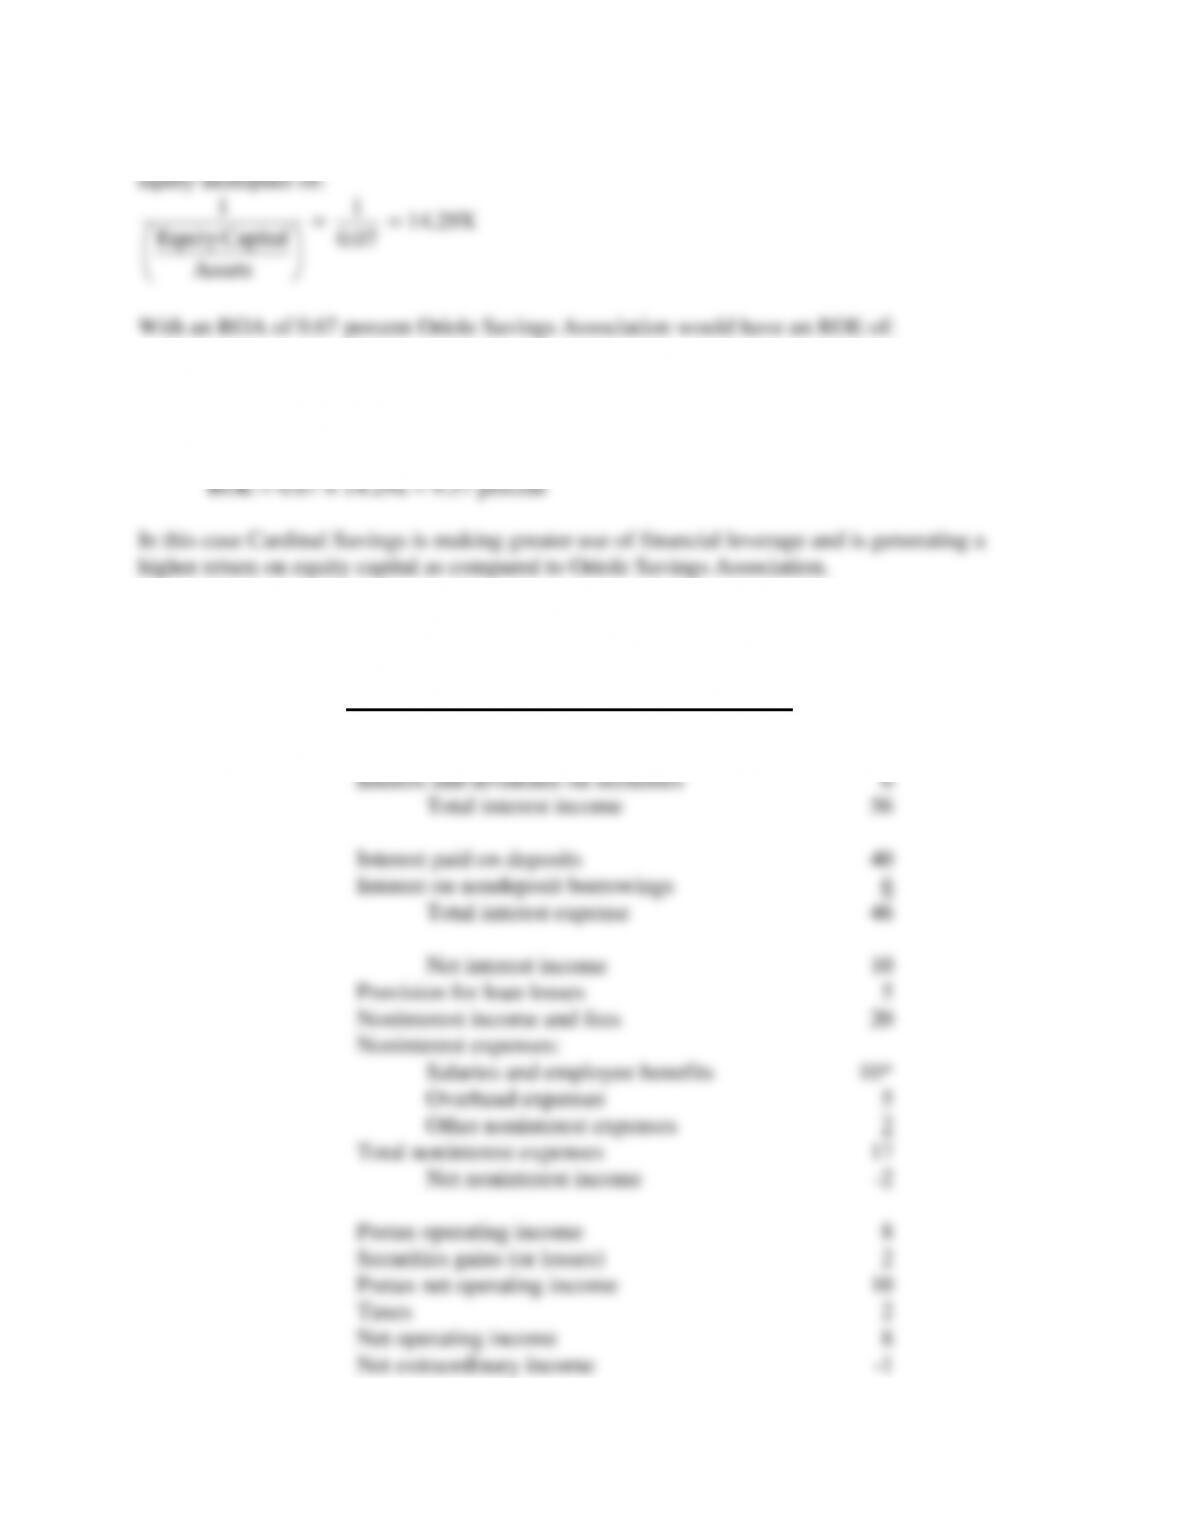
6-3 Oriole Savings Association has a ratio of equity capital to total assets of 9 percent. In
contrast, Cardinal Savings reports an equity-capital-to-asset ratio of 7 percent. What is the value
of the equity multiplier for each of these institutions? Suppose that both institutions have an
Chapter 06 – Measuring and Evaluating the Performance of Banks and Their Principal Competitors
6-11
In contrast, Cardinal Savings has an equity-to-asset ratio of 7 percent which means it has an
ROE = 0.67 × 11.11x = 7.44 percent.
With an ROA of 0.67 percent Cardinal Savings would have an ROE of:
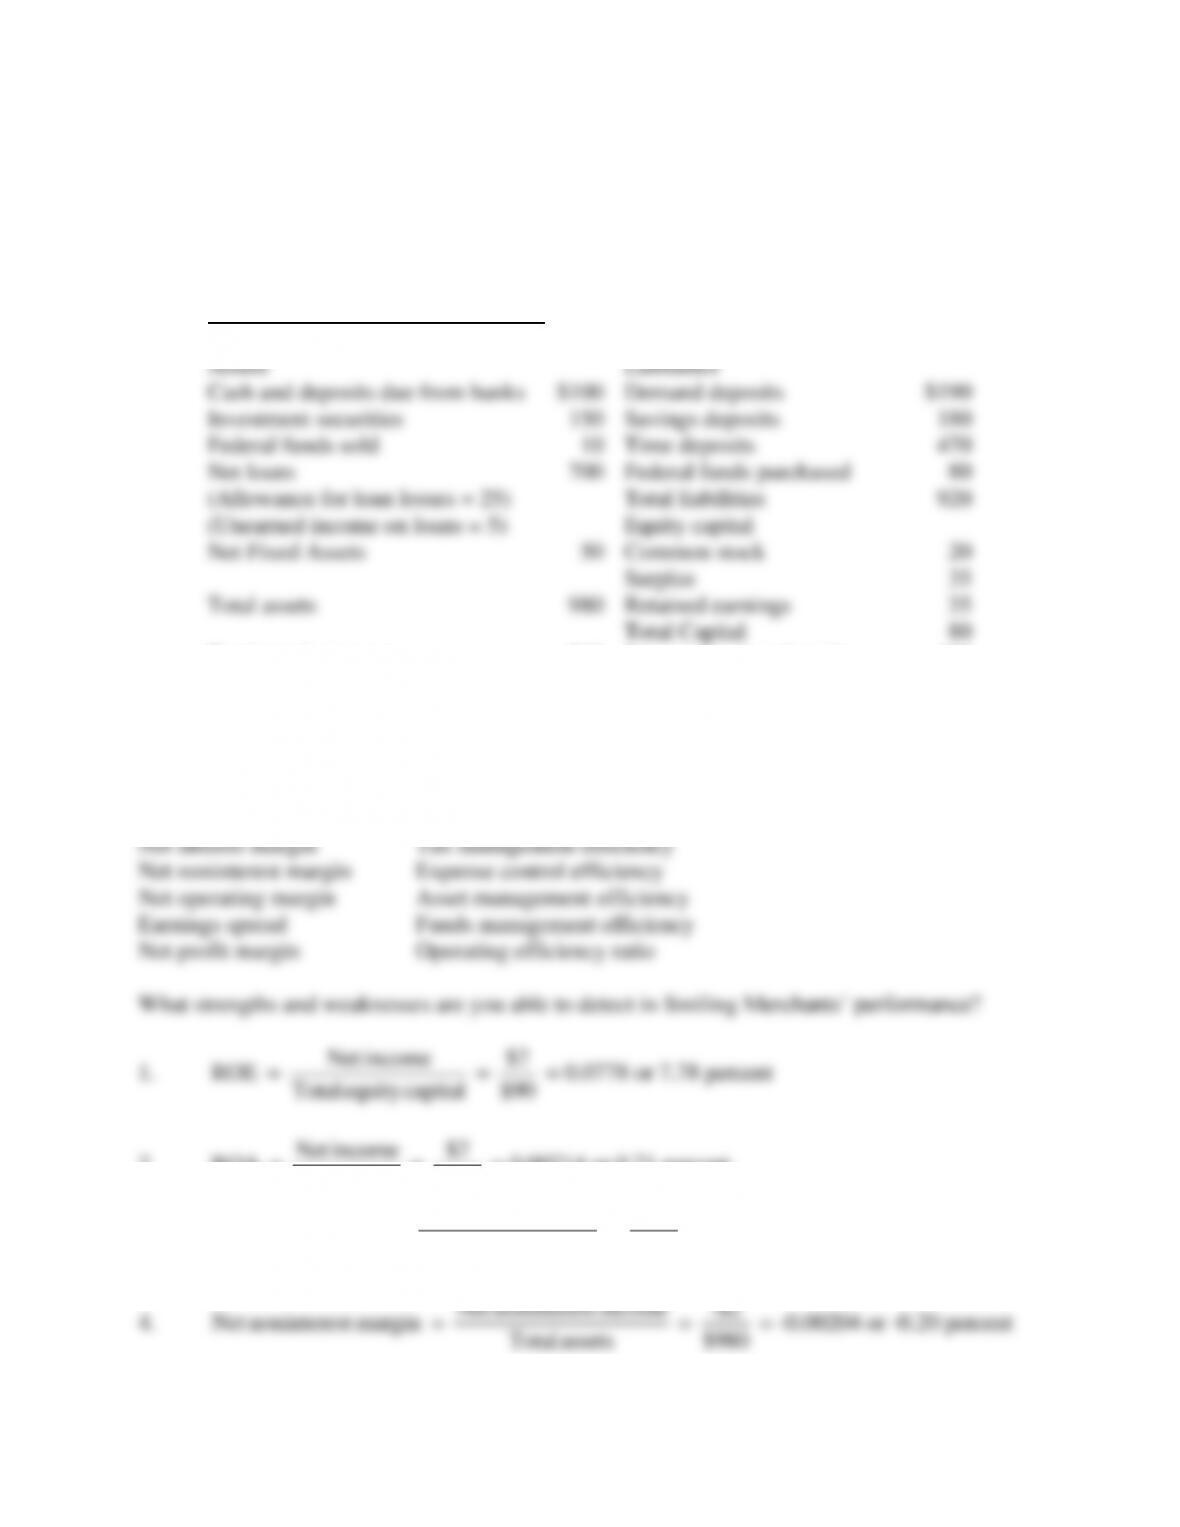
6-4. The latest report of condition and income and expense statement for Smiling Merchants
National Bank are as shown in the following tables:
Smiling Merchants National Bank (complete)
Income and Expense Statement (Report of Income)
Interest and fees on loans
$50
Interest and dividends on securities
6
Total interest income
56
Interest paid on deposits
40
Interest on nondeposit borrowings
6
Total interest expense
46
Net interest income
10
Provision for loan losses
5
Noninterest income and fees
20
Noninterest expenses:
Salaries and employee benefits
10*
Overhead expenses
5
Other noninterest expenses
2
Total noninterest expenses
17
Net noninterest income
-2
Pretax operating income
8
Securities gains (or losses)
2
Pretax net operating income
10
Taxes
2
Net operating income
8
Net extraordinary income
-1
Chapter 06 – Measuring and Evaluating the Performance of Banks and Their Principal Competitors
6-12
Net income
7
*Note: the bank currently has 40 FTE employees.
Smiling Merchants National Bank
Report of Condition
Assets
Liabilities
Cash and deposits due from banks
$100
Demand deposits
$190
Investment securities
150
Savings deposits
180
Federal funds sold
10
Time deposits
470
Net loans
700
Federal funds purchased
80
(Allowance for loan losses = 25)
Total liabilities
920
(Unearned income on loans = 5)
Equity capital
Net Fixed Assets
50
Common stock
20
Surplus
35
Total assets
980
Retained earnings
35
Total Capital
80
Total earnings assets
860
Interest-bearing deposits
650
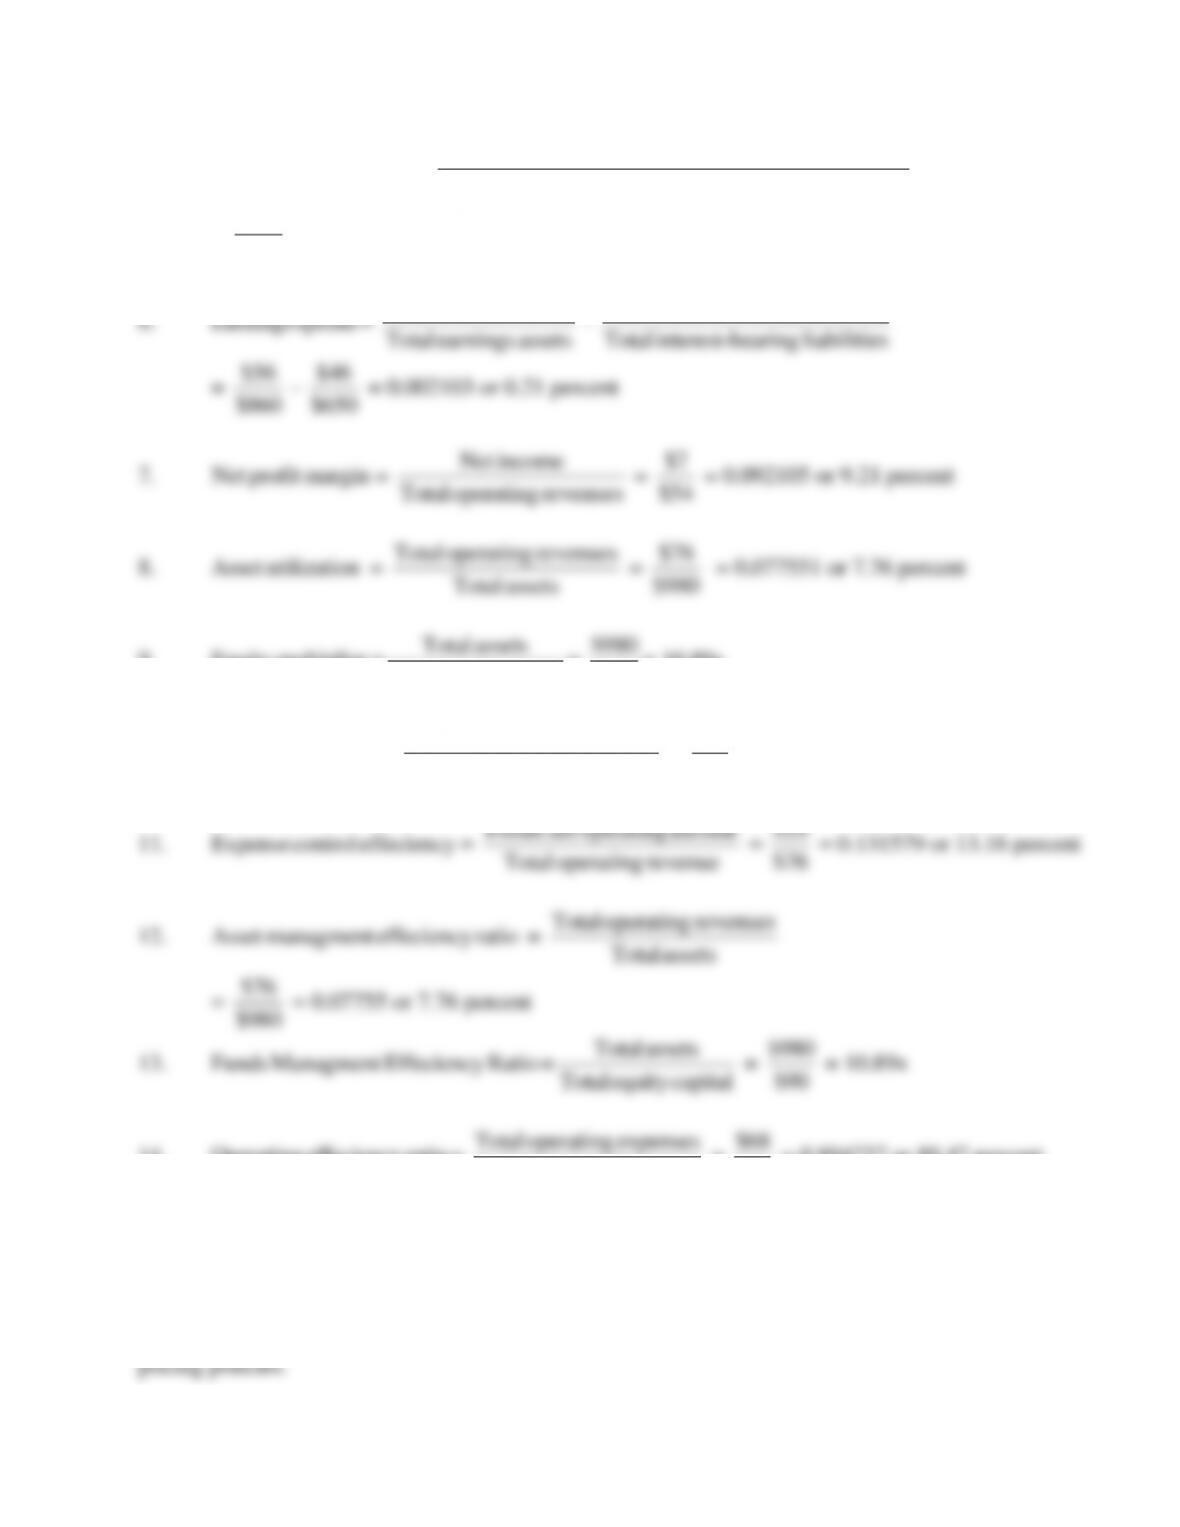
Fill in the missing items on the income and expense statement. Using these statements, calculate the
following performance measures:
ROE Asset utilization
ROA Equity multiplier
2.
Net income $7
ROA = = = 0.00714 or 0.71 percent
Totalassets $980
3.
Net interest income $10
Net interest margin = = = 0.0120 or 1.02 percent
Totalassets $980
Net noninterest income –$2
Totalassets $980
Chapter 06 – Measuring and Evaluating the Performance of Banks and Their Principal Competitors
6-13
5.
Totaloperating revenues – Totaloperatingexpenses
Net operating margin = Totalassets
$8
= = 0.008163 or 0.82 percent
$980
Totalinterest income Totalinterest expenses
Totalearningsassets Totalinterest-bearing liabilities
$56 $46
= – = 0.002103 or 0.21 percent
$860 $650
7.
Net income $7
Net profit margin = = = 0.092105 or 9.21 percent
Totaloperating revenues $54
8.
Totaloperating revenues $76
Asset utilization = = = 0.077551 or 7.76 percent
Totalassets $980
9.
Totalassets $980
Equity multiplier = = = 10.89x
Totalequitycapital $90
10.
Net income $7
Tax Management = = = 0.7 or 70 percent
Pretax net operatingincome $10
Pretax net operatingincome $10
14.
Totaloperating expenses $68
Operating effeciency ratio= = = 0.894737 or 89.47 percent
Totaloperating revenues $76
Strengths:
ROE: Positive value reflects a high rate of return flowing to shareholders.
Net profit margin: Positive value reflects effectiveness of management in controlling cost and service