Chapter 15 – The Management of Capital
Tier 1
Tier 2
Qualifying noncumulative
perpetual preferred stock
Allowance for loan and lease
losses
Common stock
Subordinated debt under
two years to maturity
Undivided profits
Intermediate-term preferred stock
Minority interest in the equity
accounts of consolidated
subsidiaries
Cumulative perpetual preferred
stock with unpaid dividends
Subordinated debt capital
instrument with an original
maturity of at least five years
Equity notes
Mandatory convertible debt
15-3. Under the terms of the Original Basel Agreement, what risk weights apply to the
following on-balance-sheet and off-balance-sheet items?
Residential real estate loans
Credit card loans
Cash
Standby letters of credit for municipal
Commercial loans
bonds
U.S. Treasury securities
Long-term unused commitments to make
Deposits held at other banks
corporate loans
GNMA mortgage-backed
Currency derivative contracts
securities
Interest-rate derivative contracts
Standby credit letters for
Short-term (under one year) loan
commercial paper
commitments
Federal agency securities
Bank real property
Municipal general obligation bonds
Bankers’ acceptances
Investments in subsidiaries
Municipal revenue bonds
FNMA or FHLMC issued
Reserves on deposit at the Federal
or guaranteed securities
Reserve banks
Cash
Deposits held at other
banks
Residential real
estate loans
Commercial loans
Chapter 15 – The Management of Capital
15–13
loans
GNMA mortgage-
backed securities
Municipal general
obligation bonds
Currency derivative
contracts
Investments in
subsidiaries
Short- term (under
one year) loan
commitments
FNMA or FHLMC
issued or guaranteed
securities
Interest-rate
derivative contracts
Credit card loans
Reserves on deposit
at the Federal
Reserve banks
Standby letters of
credit for municipal
bonds
Municipal revenue
bonds
Bank real property
Bankers’
acceptances
15-4. Using the following information for Gold Star National Bank, calculate that bank’s ratios
of Tier 1 capital-to-risk-weighted assets and total-capital-to-risk-weighted assets. Does the bank
have sufficient capital according to Basel I?
On-Balance-Sheet Items (Assets)
Off-Balance-Sheet Items
Cash
$ 4.0 million
Standby letters of credit
backing repayment of
commercial paper
$ 20.5 million
U.S Treasury
securities
30.6 million
Long-term unused loan
commitments to corporate
customers
25.5 million
Deposit balances
due from other
banks
4.0 million
Total off-balance-sheet
items
46.0 million
Loans secured by
first liens on
residential property
(1– to 4- family
dwellings)
66.0 million
Tier 1 capital
7.5 million
Loans to
corporations
105.3 million
Tier 2 capital
5.8 million
Total assets
$209.9 million
Gold Star National Bank’s required level of capital under the new international capital standards
would be determined from:
The credit-equivalent amount of each off-balance-sheet (OBS) items:
Standby letters of credit backing repayment of
commercial paper
$20.5 million × 1.00 = $20.5 million
Long-term unused loan commitments to
corporate customers
$25.5 million × 0.50 = 12.75 million
On-Balance-Sheet Items and Credit-Equivalent Off-Balance Sheet Items:
Chapter 15 – The Management of Capital
15–14
0 Percent Risk-Weighting Category
Cash
$4 million
U.S Treasury securities
$30.6 million
Total
$34.6 million
× 0.00 = $0.00 million
20 Percent Risk-Weighting Category
Deposit balances due from other banks
$4.0 million
× 0.20 = $0.80 million
50 Percent Risk-Weighting Category
Loans secured by first liens on
residential property
$66.0 million
× 0.50 = $33.00 million
100 Percent Risk-Weighting
Category
Loans to corporations
$105.3 million
Standby letters of credit backing
repayment of commercial paper
$20.5 million
Long-term unused loan commitments
to corporate customers
$12.75 million
Total
$138.55 million
×1.00 = $138.55 million
Total risk-weighted assets held by this
bank
$172.35 million
The bank’s capital ratio is:
Tier 1capital
Tier 1 capital-to-total risk–weighted assets = Risk–weighted assets including off-balance-sheet items
Tier 1 capital ÷ Risk-weighted assets = $7.5 million ÷ $172.35 million
= 4.35 percent
Total capital ÷ Risk-weighted Assets = $13.3 million ÷ $172.35 million
= 7.72 percent
The ratio of Tier 1 capital-to-risk-weighted assets is just above the minimum rate of 4 percent.
15-5. Please calculate Red River National Bank’s total risk-weighted assets, based on the
Chapter 15 – The Management of Capital
Cash
$ 75 million
Domestic interbank deposits
130 million
U.S. government securities
250 million
Residential real estate loans
375 million
Commercial loans
520 million
Total assets
$1,350 million
Total liabilities
$1,250 million
Total capital
$100 million
Standby credit letters that back municipal
general obligation bonds
$ 87 million
Long-term unused loan commitments to
private companies
145 million
general obligation bonds
$87 million × 0.20 = $17.4 million
private companies
$145 million × 0.50 = $72.5 million
Cash
$75.00 million
U.S government securities
Total
Domestic interbank deposits
general obligation bonds
17.40 million
Total
× 0.20 = $29.48 million
Chapter 15 – The Management of Capital
Residential real estate loans
$375.00 million
× 0.50 = $187.50 million
100 Percent Risk-Weighting Category
Commercial loans
$520.00 million
Long-term unused loan commitments to
private companies
$72.50 million
Total
$592.50 million
× 1.00 = $592.50 million
Total risk-weighted assets held by this bank
$809.48 million
$100 million
15-6. Suppose Red River National Bank, whose balance sheet is given in problem 5, reports the
forms of capital shown in the following table as of the date of its latest financial statement. What
is the total dollar volume of Tier 1 capital? Tier 2 capital? Calculate the Tier 1 capital-to-risk-
weighted- assets ratio, total capital-to-risk-weighted-asset ratio, and the leverage ratio.
According to the data given in Problems 5 and 6, does Red River have a capital deficiency?
Common stock (par value)
Allowance for loan losses
$25 million
Surplus
Subordinated debt capital
$20 million
Undivided profits
Intermediate-term preferred stock
$5 million
$50 million
Chapter 15 – The Management of Capital
Total capital-to-risk-weighted-asset ratio is calculated as follows:
Total capital
=
$50 million + $50 million
=
0.1235 or 12.35 percent
Total risk-weighted assets
$809.48 million
=
=
0.0370 or 3.70 percent
$1,350 million
Chapter 15 – The Management of Capital
15–18
Name of Bank
Net Income ÷ Total
Assets
(or ROA)
Net Income ÷ Total
Equity Capital (or ROE)
First National Bank of
Hopkins
1.25%
15%
Safety National Bank
1.2%
13%
Ilsher State Bank
0.9%
11%
Mercantile Bank and Trust
Company
0.25%
3%
Lakeside National Trust
−0.5%
−7%
The basic relationship needed in this problem is:
Net income after tax
ROE = Equity capital
Net income after tax
Equity capital = ROE
And,
Net income after taxes
ROA= Total Assets
Net income after taxes
Total Assets = ROA
Hence, the capital-to-asset ratio can be calculated as follows:
ROA
Capital-to-asset ratio = ROE
Therefore, the ratio of total capital to total assets for the banks named in the problem must be:
Name of Bank
Net Income ÷
Total Assets
(or ROA)
Net Income ÷
Total Equity
Capital (or
ROE)
ROA ÷ ROE
First National
Bank of Hopkins
1.25%
15.00%
8.33%
Safety National Bank
1.20%
13.00%
9.23%
Ilsher State Bank
0.90%
11.00%
8.18%
Mercantile Bank and
Trust Company
0.25%
3.00%
8.33%
Lakeside National Trust
−0.50%
−7.00%
7.14%
Chapter 15 – The Management of Capital
15–19
If an institution’s ratio of equity capital to total assets drops to 2 percent or less, a depository
15-9. Over the Hill Savings has been told by examiners that it needs to raise an additional $8
million in long-term capital. Its outstanding common equity shares total 5.4 million, each bearing
a par value of $1. This thrift institution currently holds assets of nearly $2 billion, with $135
million in equity. During the coming year, the thrift’s economist has forecast operating revenues
of $180 million, of which operating expenses are $25 million plus 70% of operating revenues.
Chapter 15 – The Management of Capital
15–20
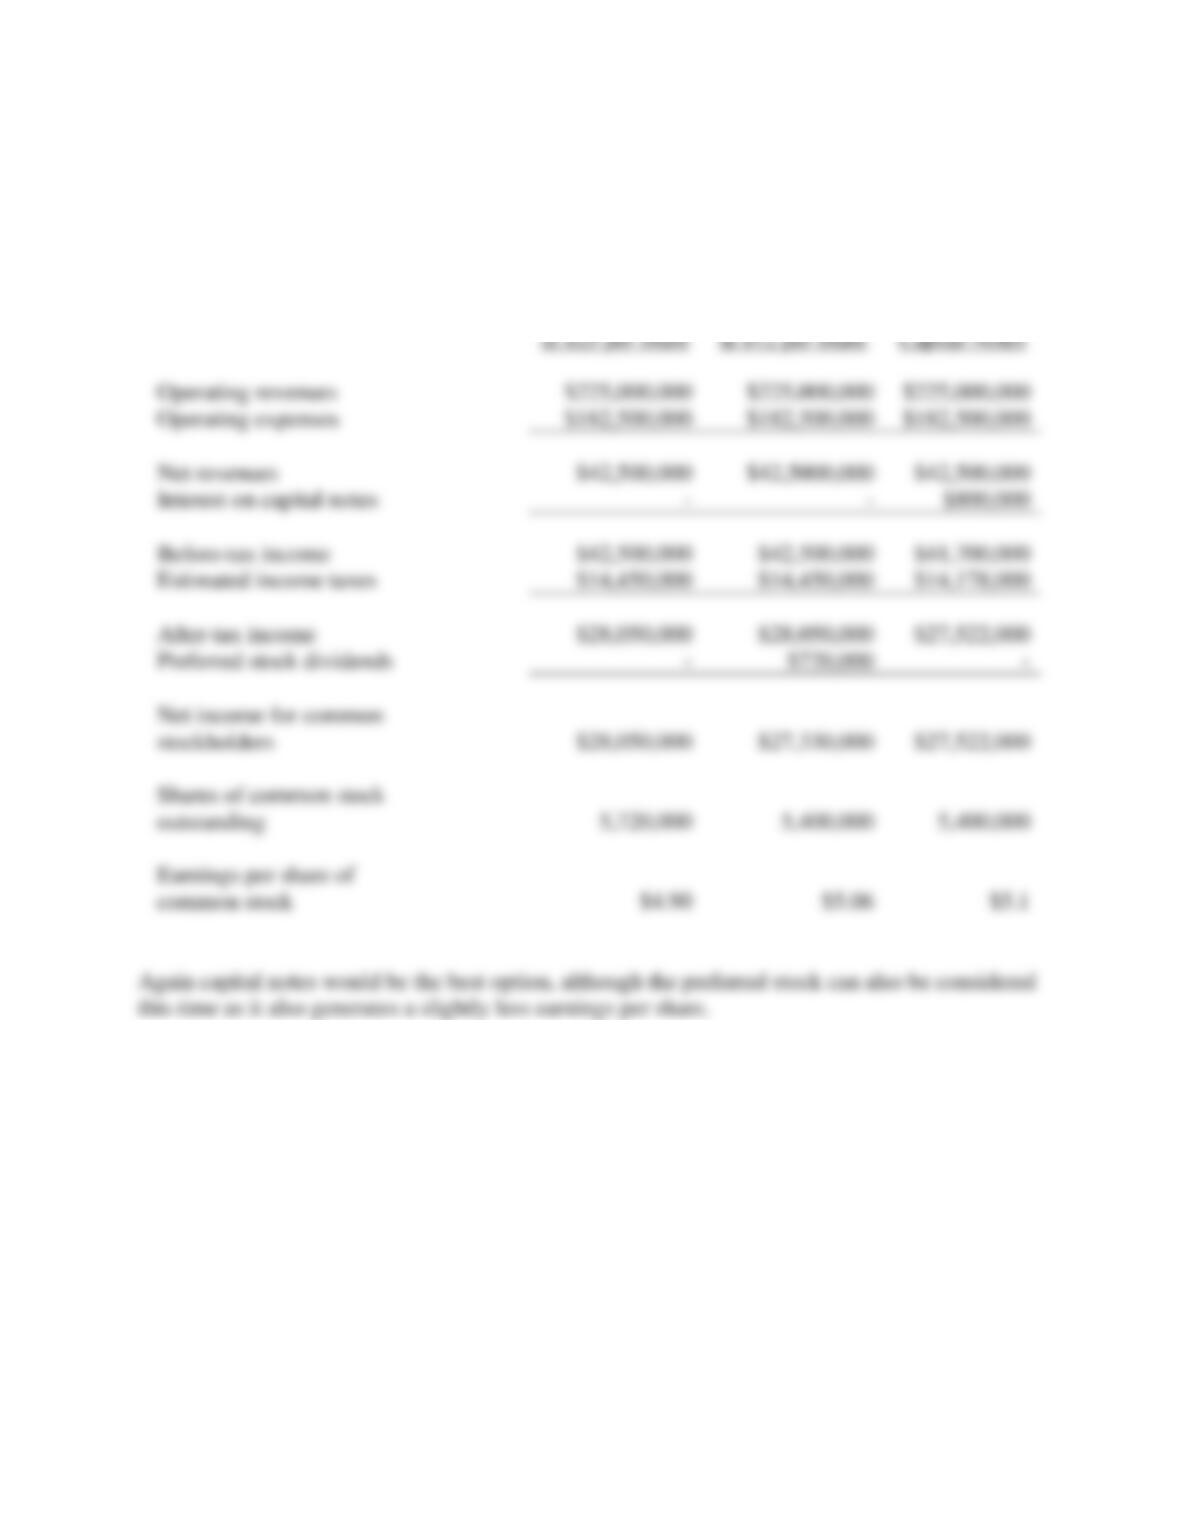
Because of the dilution effect of issuing stock, if operating revenues rise to $225 million, the
situation will be as shown below:
(a)
Sale of
Common Stock
at $25 per share
(b)
Sale of 9%
Preferred Stock
at $12 per share
(c)
Sale of 10%
Capital Notes
Operating revenues
$225,000,000
$225,000,000
$225,000,000
Operating expenses
$182,500,000
$182,500,000
$182,500,000
Net revenues
$42,500,000
$42,5000,000
$42,500,000
Interest on capital notes
–
–
$800,000
Before-tax income
$42,500,000
$42,500,000
$41,700,000
Estimated income taxes
$14,450,000
$14,450,000
$14,178,000
After-tax income
$28,050,000
$28,050,000
$27,522,000
Preferred stock dividends
–
$720,000
–
Net income for common
stockholders
$28,050,000
$27,330,000
$27,522,000
Shares of common stock
outstanding
5,720,000
5,400,000
5,400,000
Earnings per share of
common stock
$4.90
$5.06
$5.1
Again capital notes would be the best option, although the preferred stock can also be considered
this time as it also generates a slightly less earnings per share.
Chapter 15 – The Management of Capital
15–21
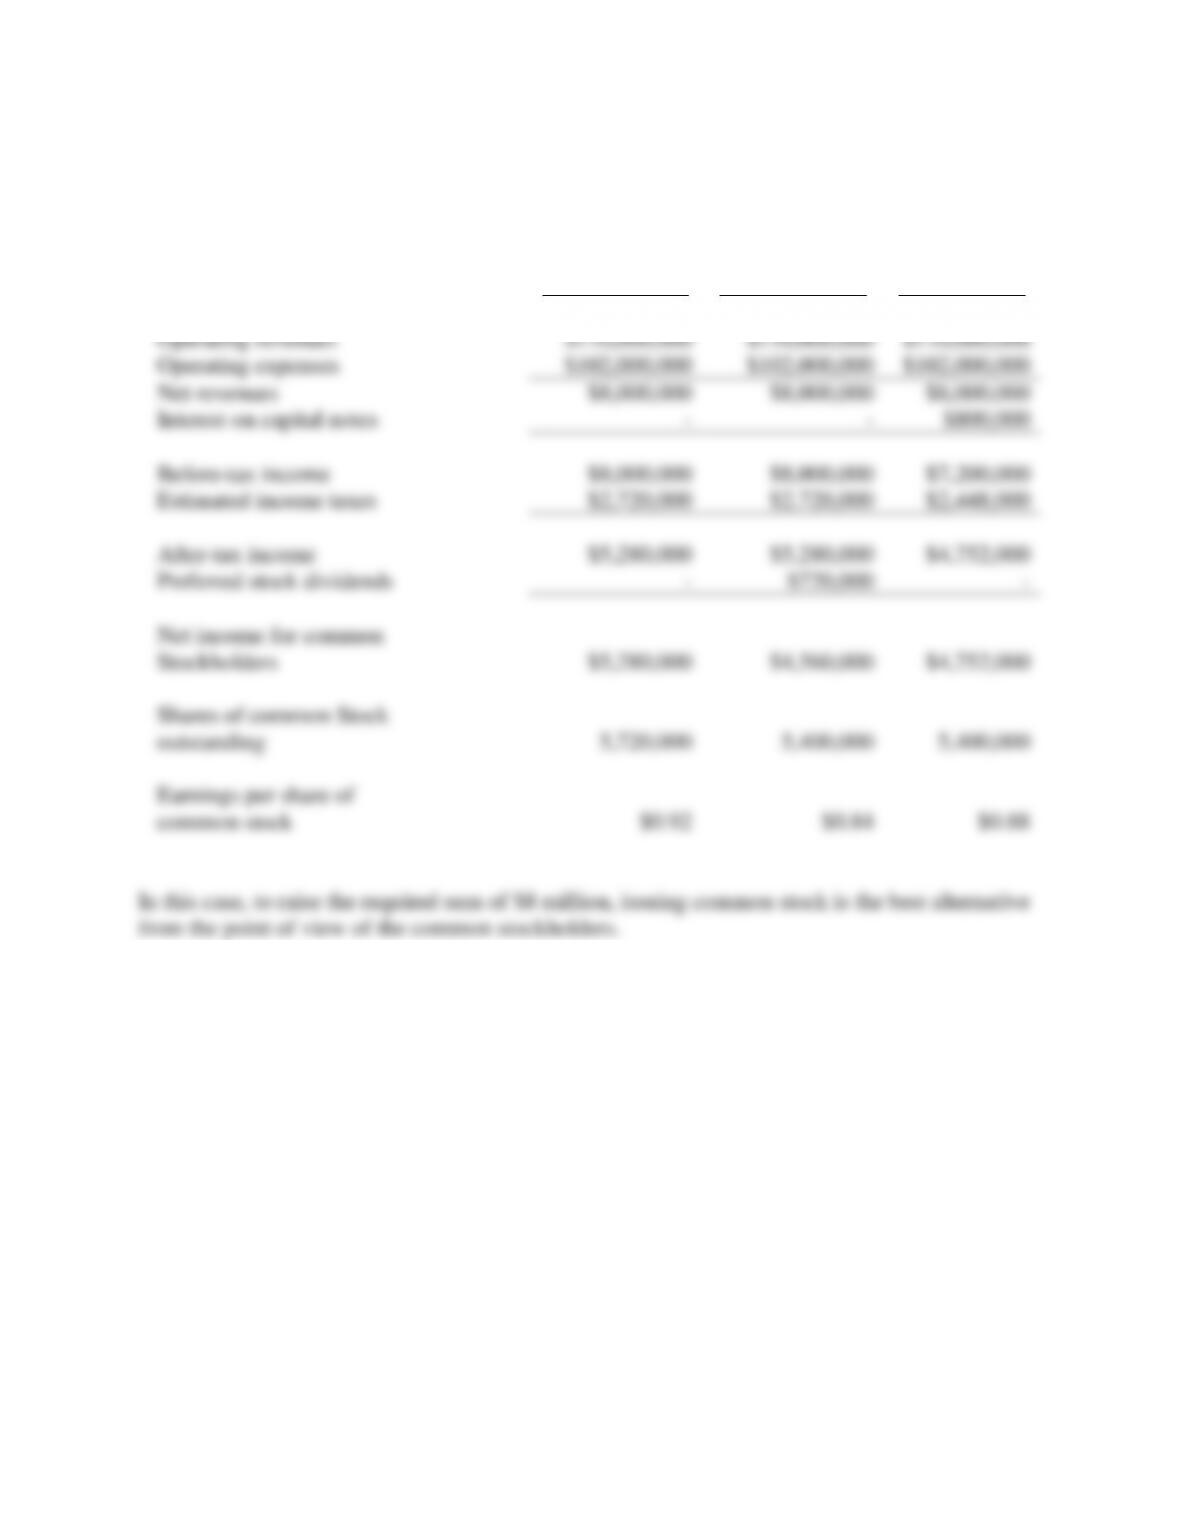
If operating revenues drop to $110 million, then the situation will be as shown below:
(a)
Sale of
Common Stock
at $25 per share
(b)
Sale of 9%
Preferred Stock
at $12 per share
(c)
Sale of 10%
Capital Notes
Operating revenues
$110,000,000
$110,000,000
$110,000,000
Operating expenses
$102,000,000
$102,000,000
$102,000,000
Net revenues
$8,000,000
$8,000,000
$8,000,000
Interest on capital notes
–
–
$800,000
Before-tax income
$8,000,000
$8,000,000
$7,200,000
Estimated income taxes
$2,720,000
$2,720,000
$2,448,000
After-tax income
$5,280,000
$5,280,000
$4,752,000
Preferred stock dividends
–
$720,000
–
Net income for common
Stockholders
$5,280,000
$4,560,000
$4,752,000
Shares of common Stock
outstanding
5,720,000
5,400,000
5,400,000
Earnings per share of
common stock
$0.92
$0.84
$0.88
In this case, to raise the required sum of $8 million, issuing common stock is the best alternative
from the point of view of the common stockholders.