14. An interesting question to ask students toward the end of this case, once you have
covered all the threats and governance brought about by the new Title IV – related rules
and laws, is: “What alternatives to traditional student loan funding might UOP pioneer; or
we encourage?”
enterprise, Lumni, http://www.lumni.net/, already doing it. Lumni has raised almost $20 million
to finance the education of 2,000 students in Chile, Columbia, Mexico and the U.S. It offers
“human capital contracts” to people that would otherwise not be able to attend college. The
company manages social-investment funds that invest in the education of a diverse pool of
graduation.
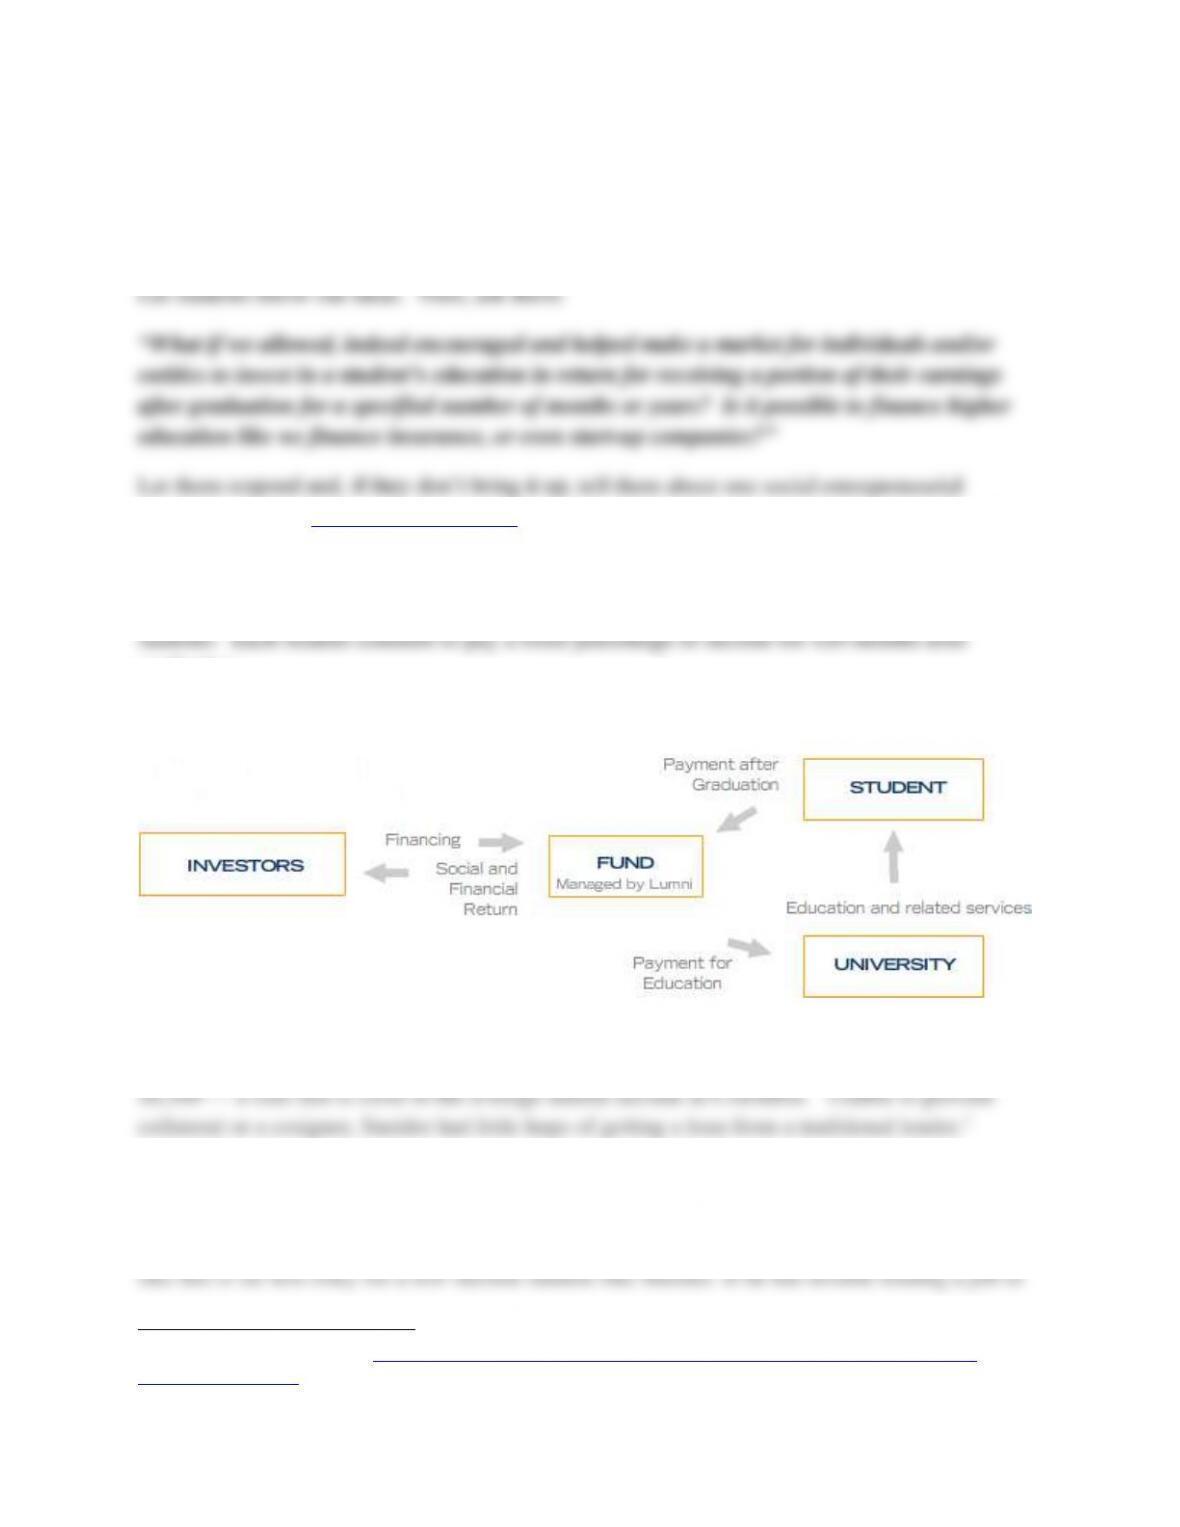
Lumni’s model:
An example of would be Jairo Sneider, who grew up in a low-income, single parent family in
Colombia. His dream: attend college to become a nurse and serve his community. The cost:
Here’s the deal that Lumni made with Sneider: For $8,530 in financing, pay 14% of his salary
for 118 months after he graduated. At that point, regardless of how much he has paid, his
obligation terminates. While sounding similar to a loan, an “income contingent” repayment plan
1
David Bornstein blogging at: http://opinionator.blogs.nytimes.com/2011/05/30/instead-of-student-loans-
investing-in-futures/.

his success.
2
Interestingly, Milton Friedman proposed this idea for the U.S. in the 1950s.
Lumni has made similar deals with 2,000 students through early 2011. Fifty five percent of them
are women and 90 percent are the first in their families to attend college. Most of these students
3
You can read more on Bornstein’s blog about this and other examples at:
http://opinionator.blogs.nytimes.com/2011/06/02/a-way-to-pay-for-college-with-dividends/ and
http://opinionator.blogs.nytimes.com/2011/05/30/instead-of-student-loans-investing-in-futures/. As of mid2011.
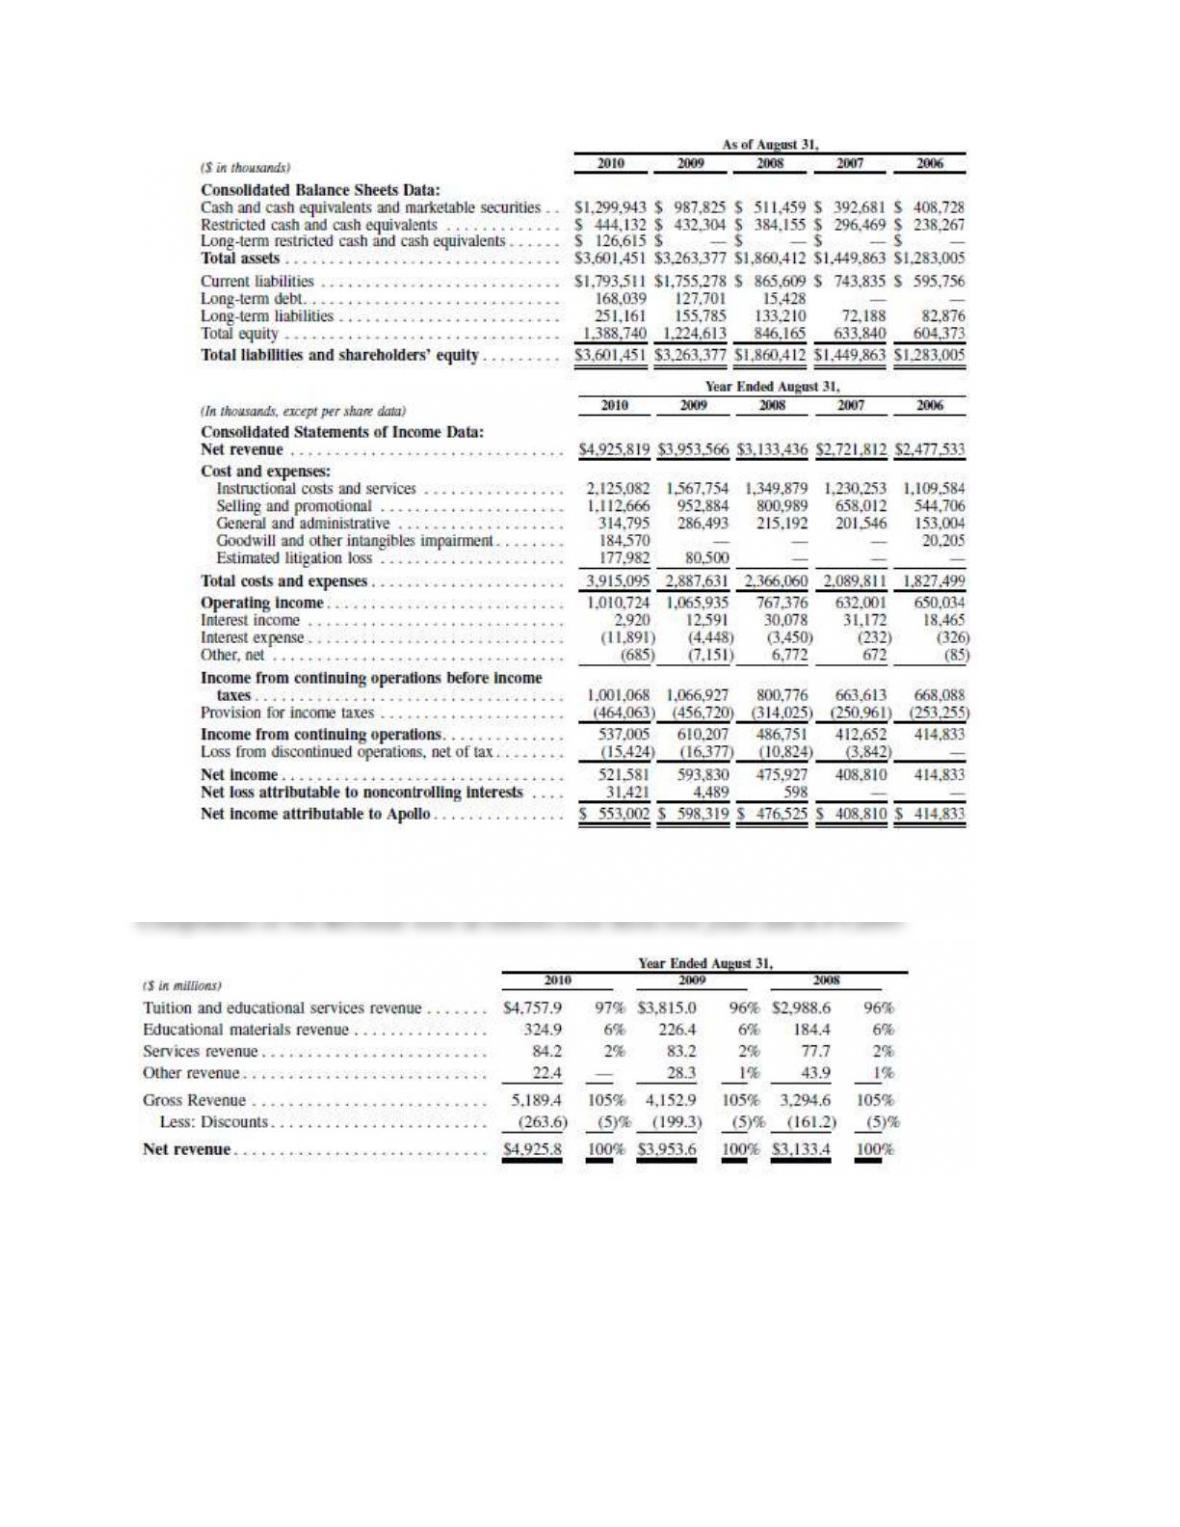
15. Examining the Apollo Group’s Financials reveals:
Revenues have steadily grown, doubling in the last five years from$2.48B to $$4.93B.
Tuition remains has gradually climbed from 94% to 97% of this revenue, and
Educational materials remain a steady 6% of these revenues
Title IV funding as a percent of total net revenues has risen quickly from ~60% in 2005
to what is to 88% in 2010; and predicted by Apollo execs to exceed 90% in FY2012
This means almost $4.4 billion of Apollo’s $4.9 billion 2010 revenue is money students
are paying to attend the UOP from loans they have received linked in so way to Title IV.
Sales and Promotion Expenses have risen from 21.6% of revenue in 2006 to a high of
25.6% in 2008 then declined to 22.6% by 2010. Interestingly, the 10-K no longer breaks
out the separate expense categories in 2010, choosing instead to make a summary
statement as follows:
2
Bornstein, ibid.
3
Bornstein, ibid.
4
G& A expenses have risen from a low 4.4% of revenue in 2005 to 6.2% of revenue in
2010. A significant increase when you would normally expect it to actually drop as
revenues doubled over the same 5-year period. Why did it rise? Probably an indication of
the seriousness with which the Apollo Group is taking and responding to the new, Title
compliance, and adjustment.
Goodwill impairment and litigation loss reserves have become 3.8% and 3.6%
respectively of net revenue in 2010. Goodwill impairment had to do with writing down
goodwill values associated with Apollo Group’s international operations based on their
Current ratio has remained in the 1:1 range
Long term debt to equity ratio is quite low
Assets to liabilities about 1.5 – solid
Net income has not grown nearly as fast as it historically did. Net income of $484
million in 2006 rose to $553 million in 2010 – 11% of net revenue in 2010 vs. over 19%
in 2005.
NOTE: Also, for your convenience, we have provided in the American Public Education Inc.
Case Instructor’s Guide a table which compares UOP and APEI on all their P&L figures; to

include commentary on what might be discussion / interpretation points. So you may want to
For your convenience, the financial information provided in the case is reprinted here:
Revenue at the Apollo Group doubled during the last five fiscal years as follows:
Revenue [ $$ in millions]
Source of the Revenue
2010
2009
2008
2007
2006
University of Phoenix
$ 4,498.3
$3,766.6
$2,987.7
$2,537.8
$2,074.4
Apollo Global:
BPP
$ 251.7
13.1
—–
—–
—–
Other5
$ 78.3
76.1
42.3
Total Apollo Global
$ 330.0
89.0
42.3
—–
—–
Other Schools
95.7
95.0
93.6
182.6
402.1
Corporate
1.8
2.8
9.8
1.4
1.0
Net Revenue
$4,925.8
$3,953.6
$3,133.4
$2,723.8
$2,477.5
5
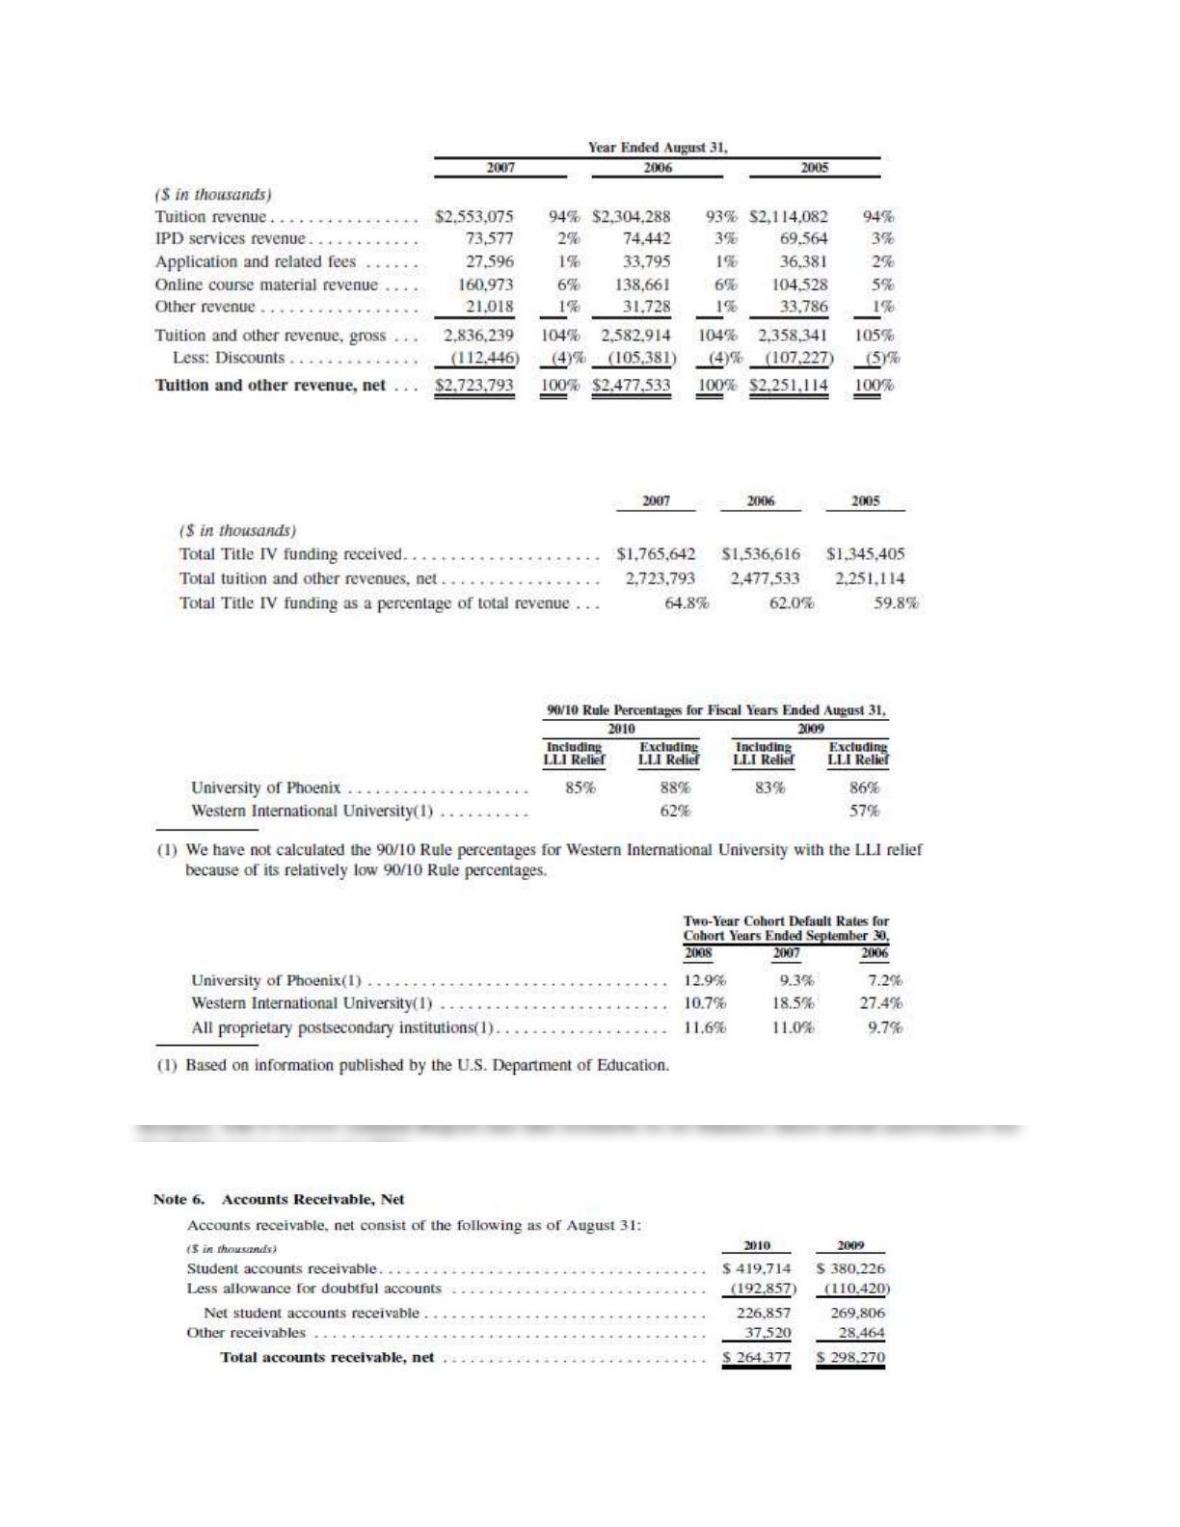
Total revenues from Title IV funding were as follows over the 2005-2007 time period:
Proximity to 90/10 rule & Cohort Default Rate thresholds in 2010 and 2009 at UOP and WIU:
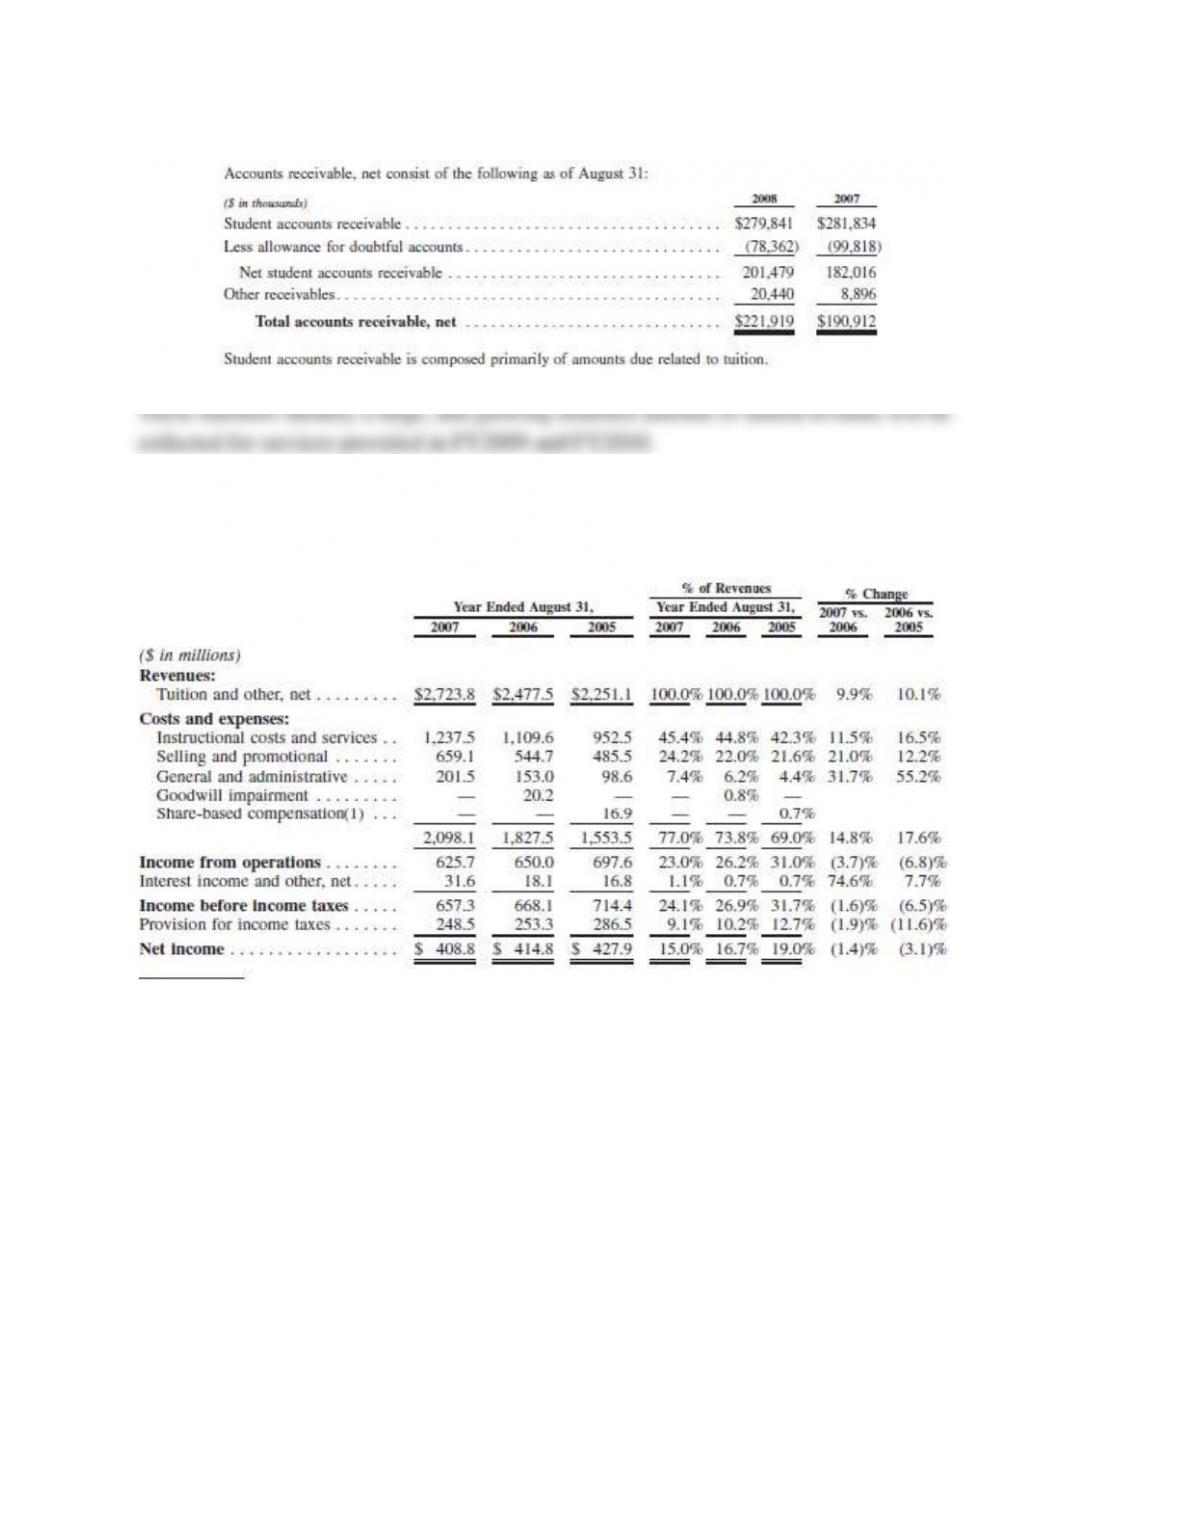
doubtful accounts receivable:
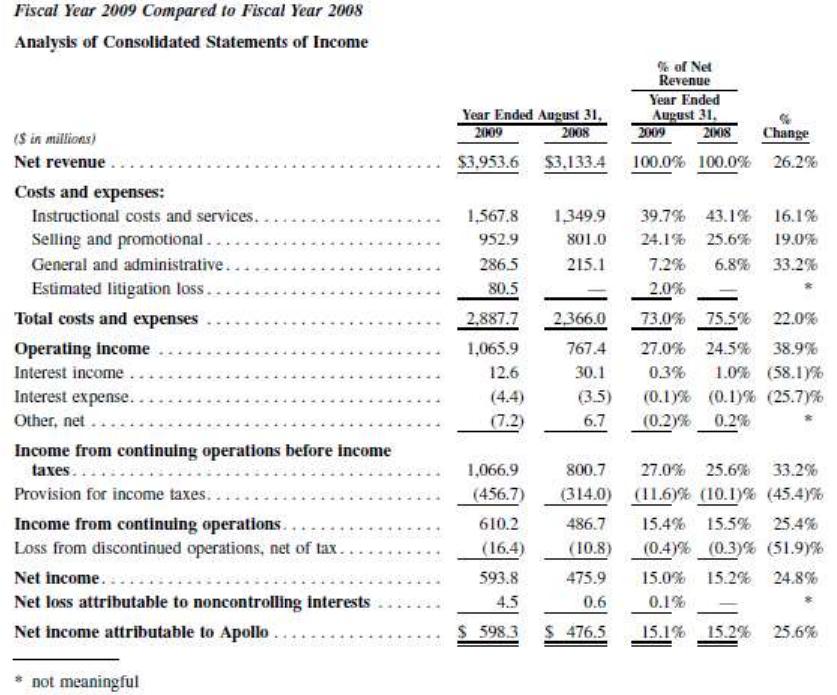
Apollo/UOP’s costs as a percent of revenue were as follows over the last six years:
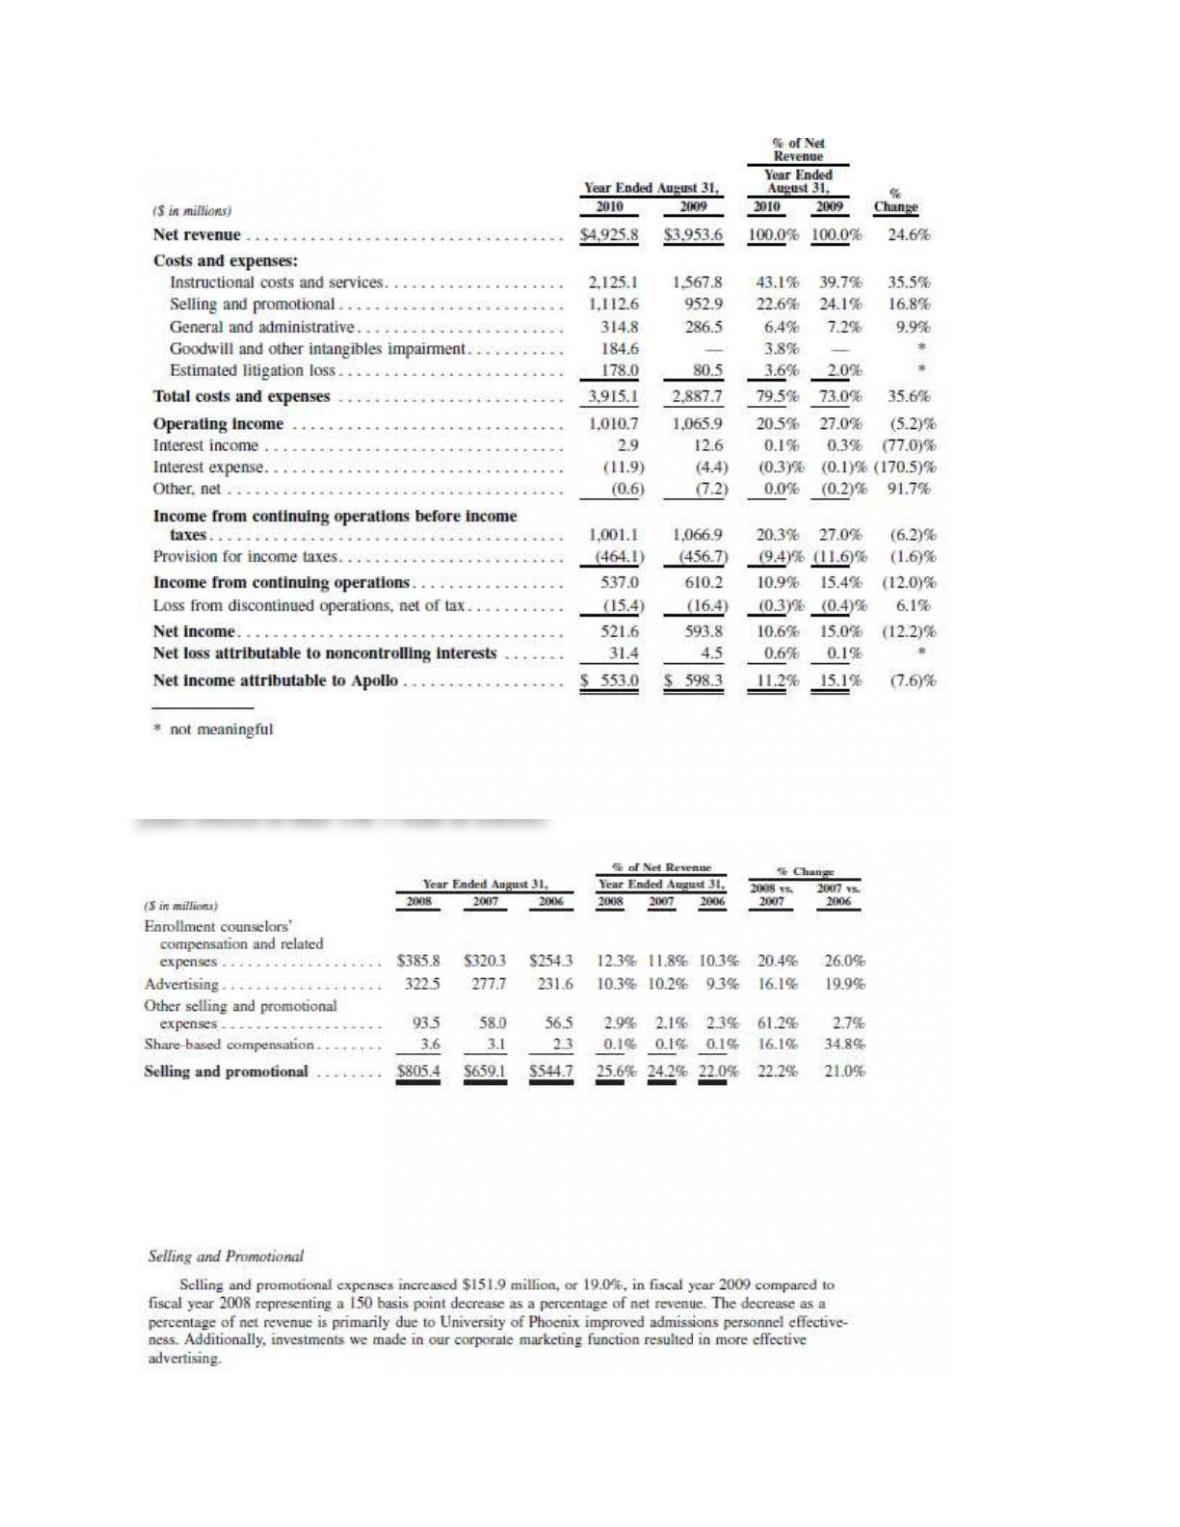
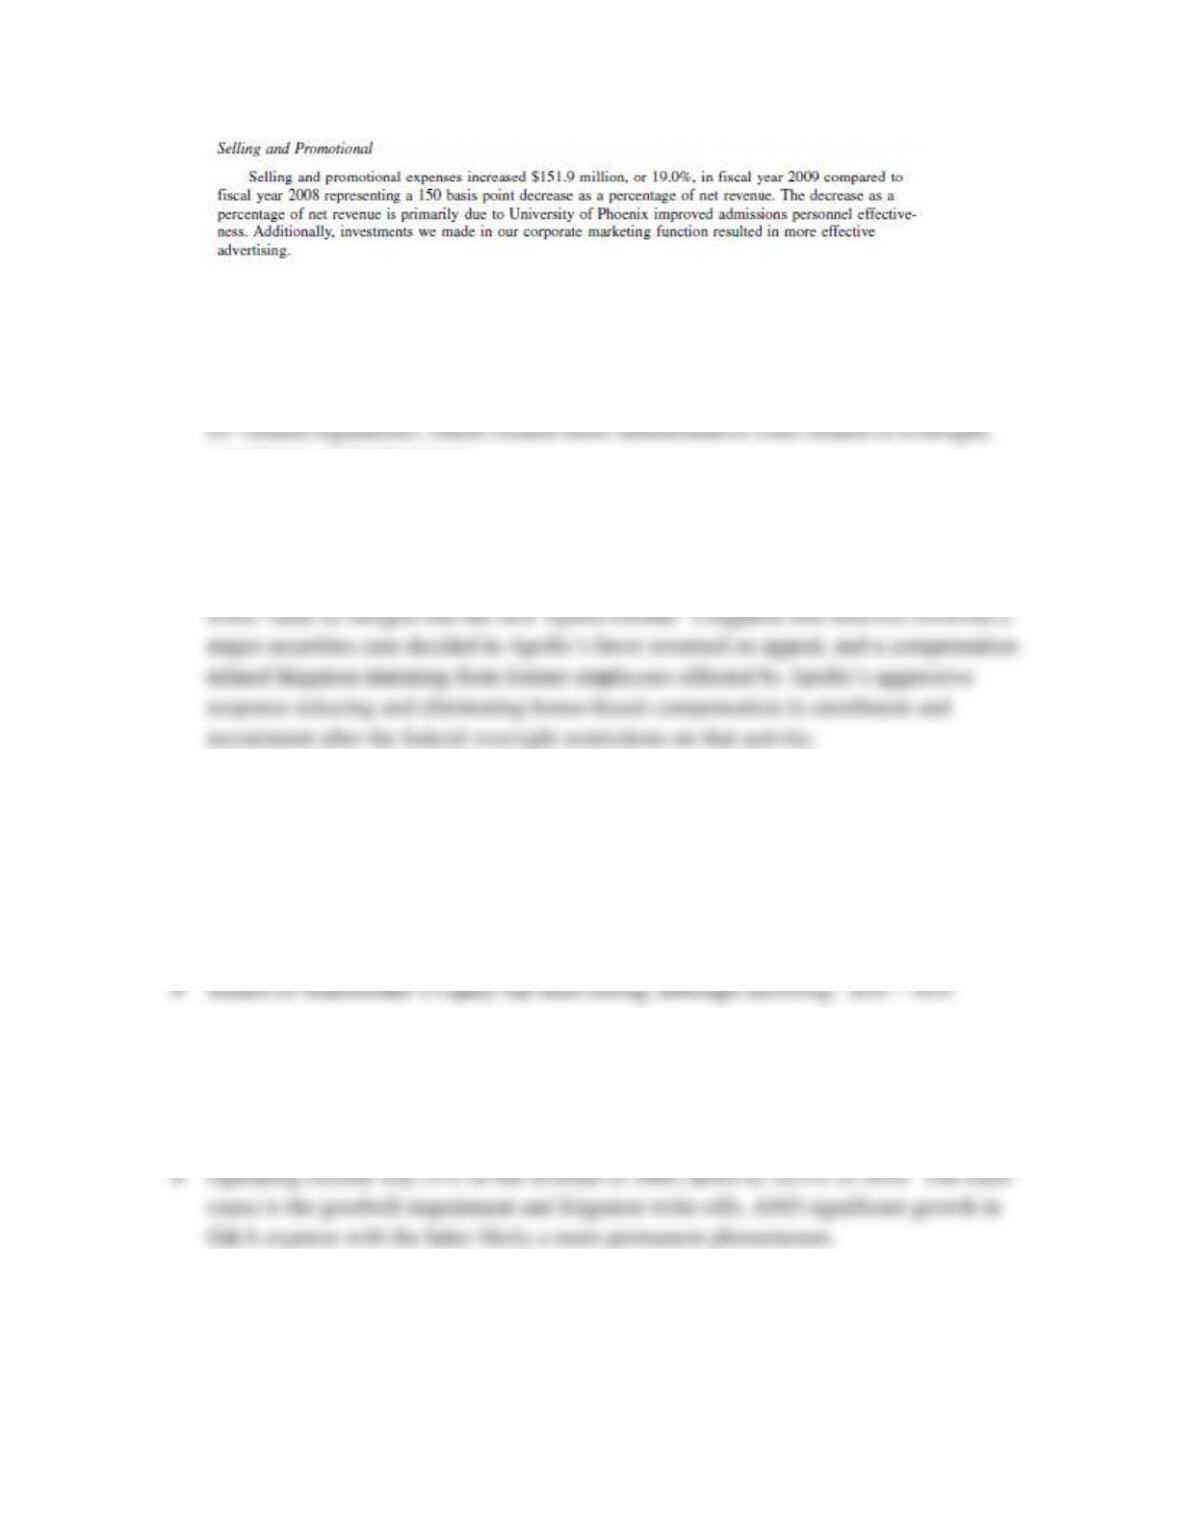
Further breakdown of the Apollo Group’s “Selling and Promotional” expenses for the last five
Interestingly, the Apollo Group 2010 10-K chose not to break out expenses in this same manner
and instead provided this summary referring to FY2009 and FY2008, with no breakdown of the
$1.1B+ selling and promotional expenditures in 2010: