UVA–QA-0749TN
Oct. 21, 2010
Foundation.
SALMONES PUYUHUAPI (A), (B), AND (C)
Teaching Note
Synopsis
hopes that the virus does not spread to the SP site.
The A case includes Richards’s calculation of contribution for the “harvest now”
alternative. Students receive the Excel model (UVA–QA-0749X) that performs those calculations
booked six months into the future. Also, the processing plant is about to shut down for the off-
season.
The B case contains Richards’s probabilities for the various virus scenarios. The C case
fish and a reduced growth rate.
Although the case is written in English, the comments of the three managers are given in
-2- UVA–QA-0749TN
Options for Using the Cases
The A, B, and C cases offer instructors flexibility in how to use the cases. If the A case is
used alone, the students will be expected to evaluate scenarios and calculate break-even
Instead of handing out the B and/or C cases before or in class, instructors might consider
For example, the class could start with the students explaining their A case analysis to a
visiting Correa. Students could then work with the visitor to develop some approximate
probabilities. Or Correa could receive a phone call from Rivas with the desired probabilities.
Given that everything happens in a matter of months and there are no apparent longer-
term consequences of this decision, there is little need to consider the time value of money, and
the situation is well suited for a “decision diagram” analysis. Students will adapt the model
provided and use it to evaluate end points on the decision diagram. The three virus scenarios
simulation.
Assignment
Prepare the A case. Assume the role of Correa and evaluate the various scenarios
return with their reports.
-3- UVA–QA-0749TN
Analysis
two-month period), and line items are added to the financials for the costs of the crew and
disposing of the dead fish.
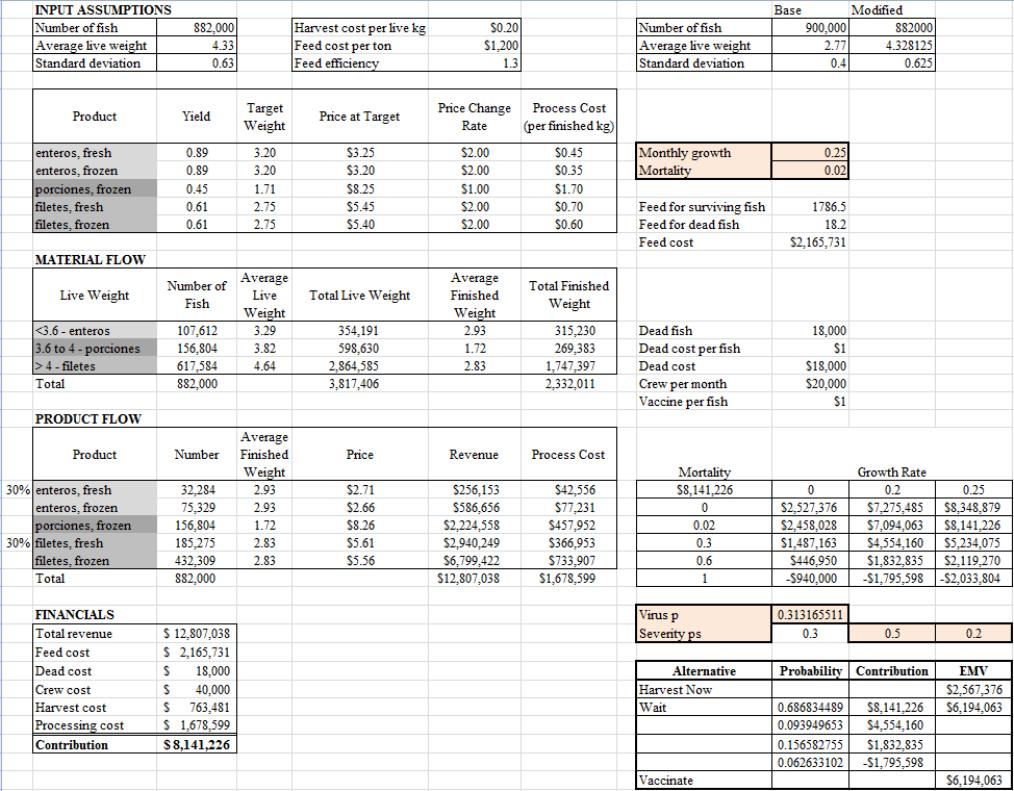
Exhibit TN1 contains the extended model with inputs corresponding to “wait—and the
The $4.2 million spent to date on the fish at the Jacaf Fjord site is sunk and will be
With the model capable of calculating contribution as a function of monthly growth and
mortality rate, we use a two-way data table to calculate the contributions for the relevant
combinations of growth and mortality. Next, we include the probabilities from the B case and
Note that this analysis assumes information in the B and C cases. Students’ analyses will
be different if they only have the A case to work with. We expect that many students will make
The model in Exhibit TN1 supports a host of sensitivity analyses. Assumptions that can
be questioned include feed costs, cost per dead fish, yields, growth rate, and probabilities. With
respect to better alternatives, consider waiting until the first sign of the virus and then harvesting
immediately. The actual situation is one in which Ace Services is available now and booked by
-4- UVA–QA-0749TN
perform the harvesting service, and the reality is that it is too large a job for SP to do without the
Ace Services boat and pump and crews. Additionally, the processing plant is about to close down
Assume that if the virus hits, it will arrive in one month. This new alternative achieves
$8,141,226 if the virus does not hit (p = 0.35) and the contribution from harvesting in one month
-5- UVA–QA-0749TN
Exhibit TN1
SALMONES PUYUHUAPI (A), (B), AND (C)
Extended Spreadsheet Model