UVA-F-1578TN
Rev. Aug. 11, 2010
School Foundation, Charlottesville, VA. All rights reserved. To order copies, send an e-mail to
sales@dardenbusinesspublishing.com. No part of this publication may be reproduced, stored in a retrieval system,
used in a spreadsheet, or transmitted in any form or by any means—electronic, mechanical, photocopying,
recording, or otherwise—without the permission of the Darden School Foundation. Rev. 8/10.
Perpetual Growth Valuation
The case leads students to conduct their enterprise valuations using a multiple for the
terminal value. Students are also likely to have learned to develop valuations using a perpetual
growth assumption. This section of the teaching note discusses how this may be accomplished. It
can be considered supplemental analysis.
The perpetual growth approach used in this note is to forecast an additional year under
steady-state (long-term growth) assumptions and then use this to calculate a terminal value in the
final year of the planning period. This steady state is, in most cases, no different from the last
year’s except that the long-term growth rate is applied to financial statement items. It is this
growth rate that will be the focus of our discussion.
If one considers the base case where all markets are assumed to be in parity, then it is
easy to see that a growth rate in the cash flows of one currency will imply a specific growth rate
in the exchange rate converted cash flows. In fact, that implied rate can be calculated exactly as
we had previously calculated a foreign currency discount rate! In particular, we make the
following adjustment:
1
1
1
)1(
domestic
foreign
domesticforeign r
r
gg
where g is the growth rate.
growth rate is 0.98%. The value of Milagrol using either approach is the same.
The 10% perpetual BRL growth rate is probably a bit high (depends on inflation
assumptions), but what is interesting is that lower assumptions will yield a negative USD growth
1
1
Again, we note that the sovereign spread inflates the interest differential relative to parity making the
adjustment more severe.
-2- UVA-F-1578TN
illustrated.
Inflation and valuation
As noted, if inflation affects nominal values and not real values, and if that effect is
properly captured in discount rates, inflation becomes irrelevant. This is a point students may
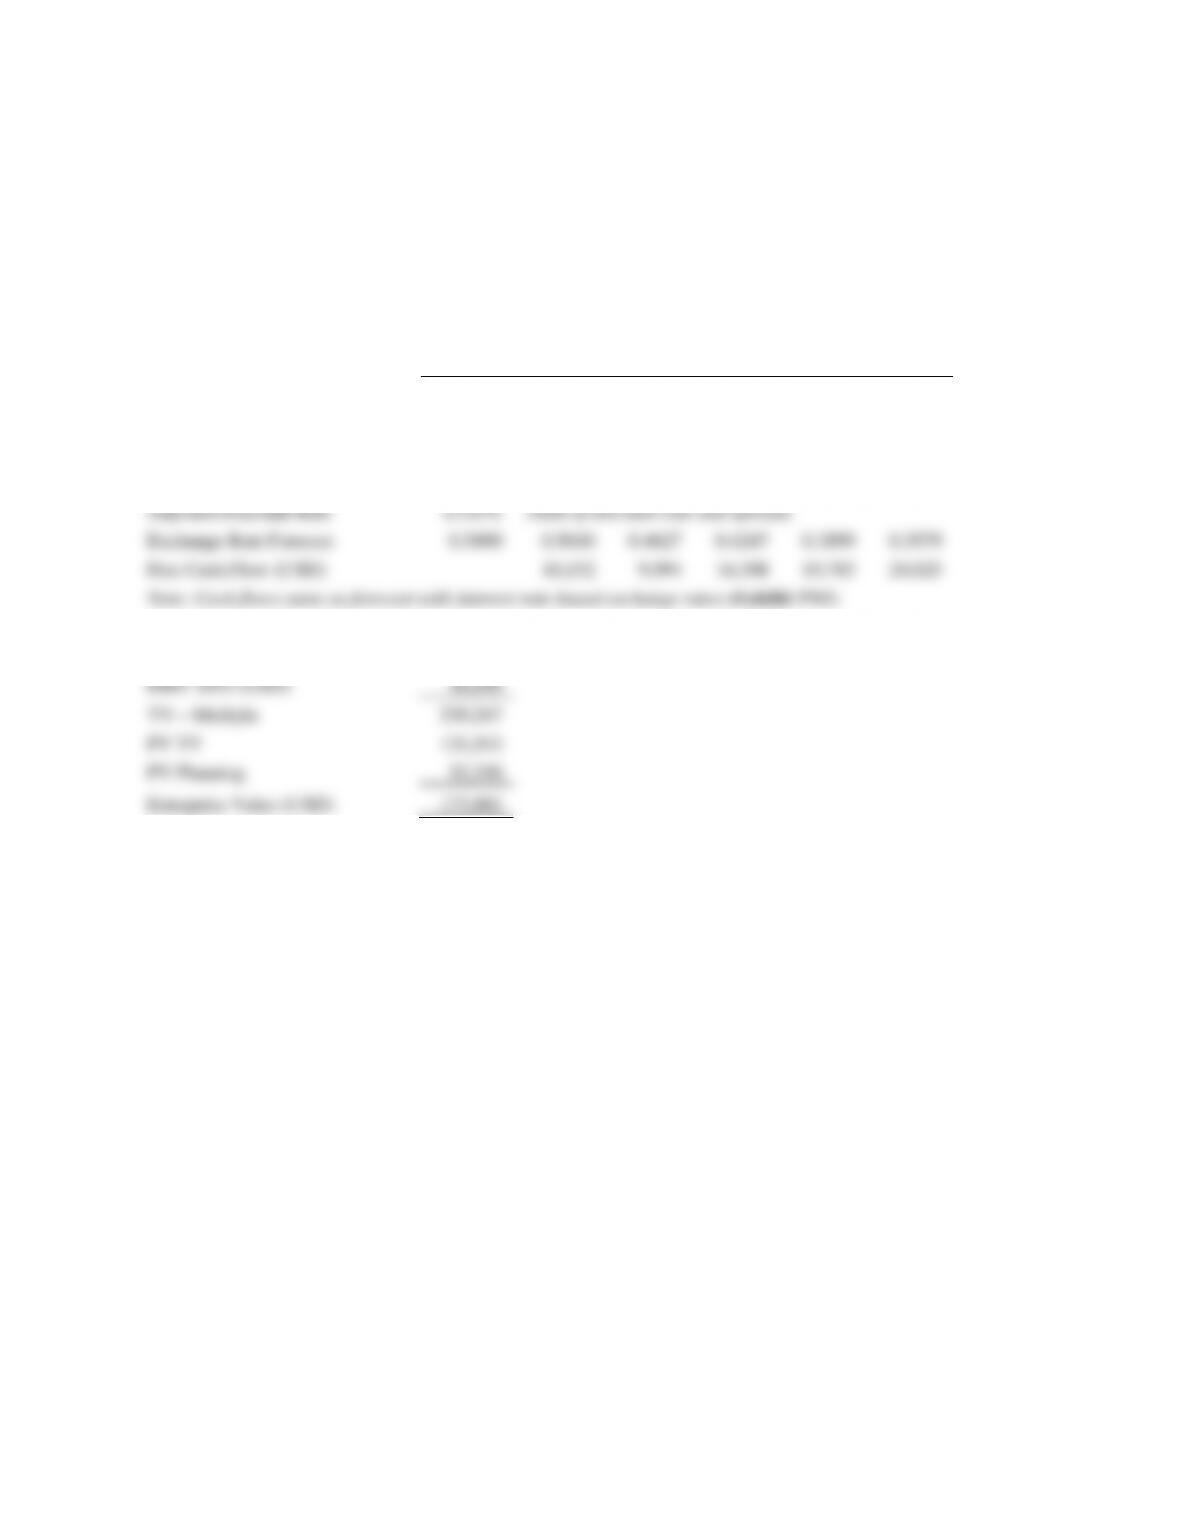
MILAGROL LTDA.
Valuation Analysis—Baseline Approaches
(numbers in thousands of USD or BRL)
2010
2011
2012
2013
2014
2015
Free Cash Flow (BRL)
20,144
21,601
38,397
50,739
67,124
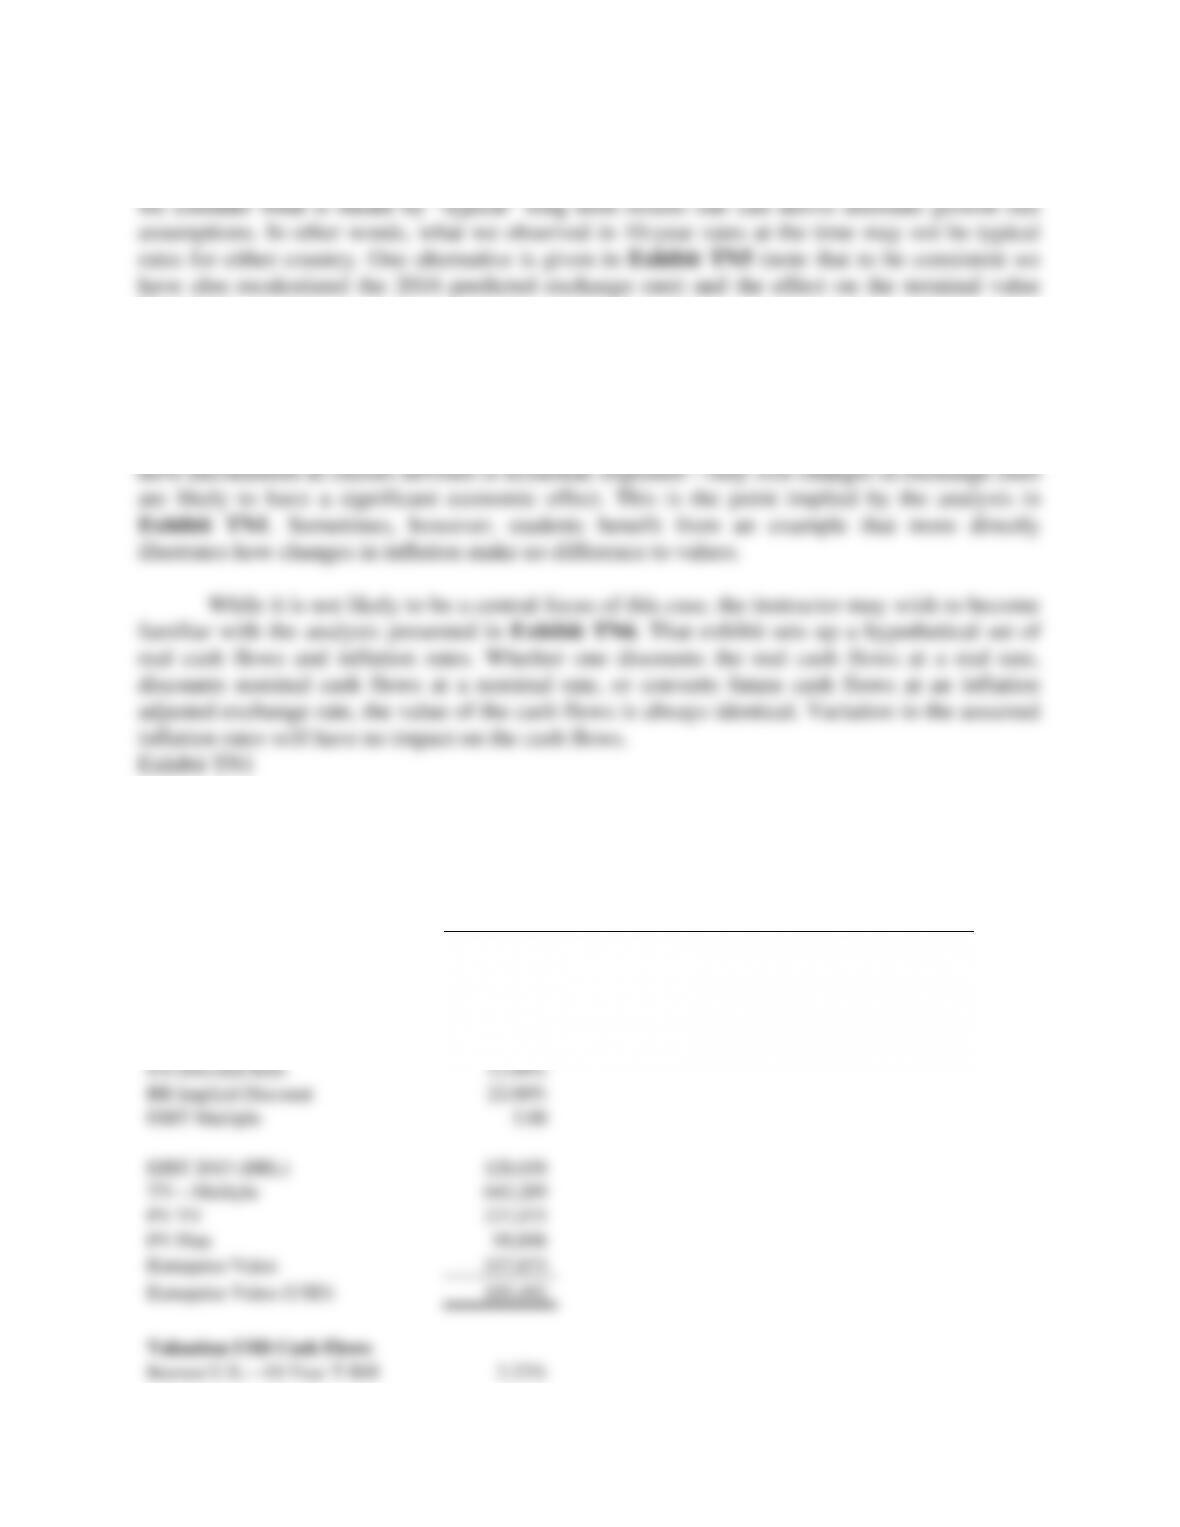
Valuation BRL Discount Rate
Interest U.S.—10-Year T-Bill
3.22%
BRL Interest
12.44%
US Discount Rate
12.00%
BR Implied Discount
22.00%
EBIT Multiple
5.00
EBIT 2015 (BRL)
128,658
TV—Multiple
643,289
PV TV
237,975
PV Plan
99,898
Enterprise Value
337,873
Enterprise Value (USD)
185,492
Valuation USD Cash Flows
Interest U.S.—10-Year T-Bill
3.22%
-3- UVA-F-1578TN
BRL Interest less Sovereign Spread
12.44%
Implied Future Spot Rates
0.5490
0.5040
0.4627
0.4247
0.3899
0.3579
Converted Free Cash Flows
10,152
9,994
16,308
19,783
24,025
EBIT 2015 (BRL)
128,658
EBIT 2015 (USD)
46,049
(Convert at forecast exchange rate for 2015)
TV—Multiple
230,247
(USD EBIT times multiple)
PV TV
130,648
PV Planning
54,844
Enterprise Value (USD)
185,492
Source: Created by case writer.
-4- UVA-F-1578TN
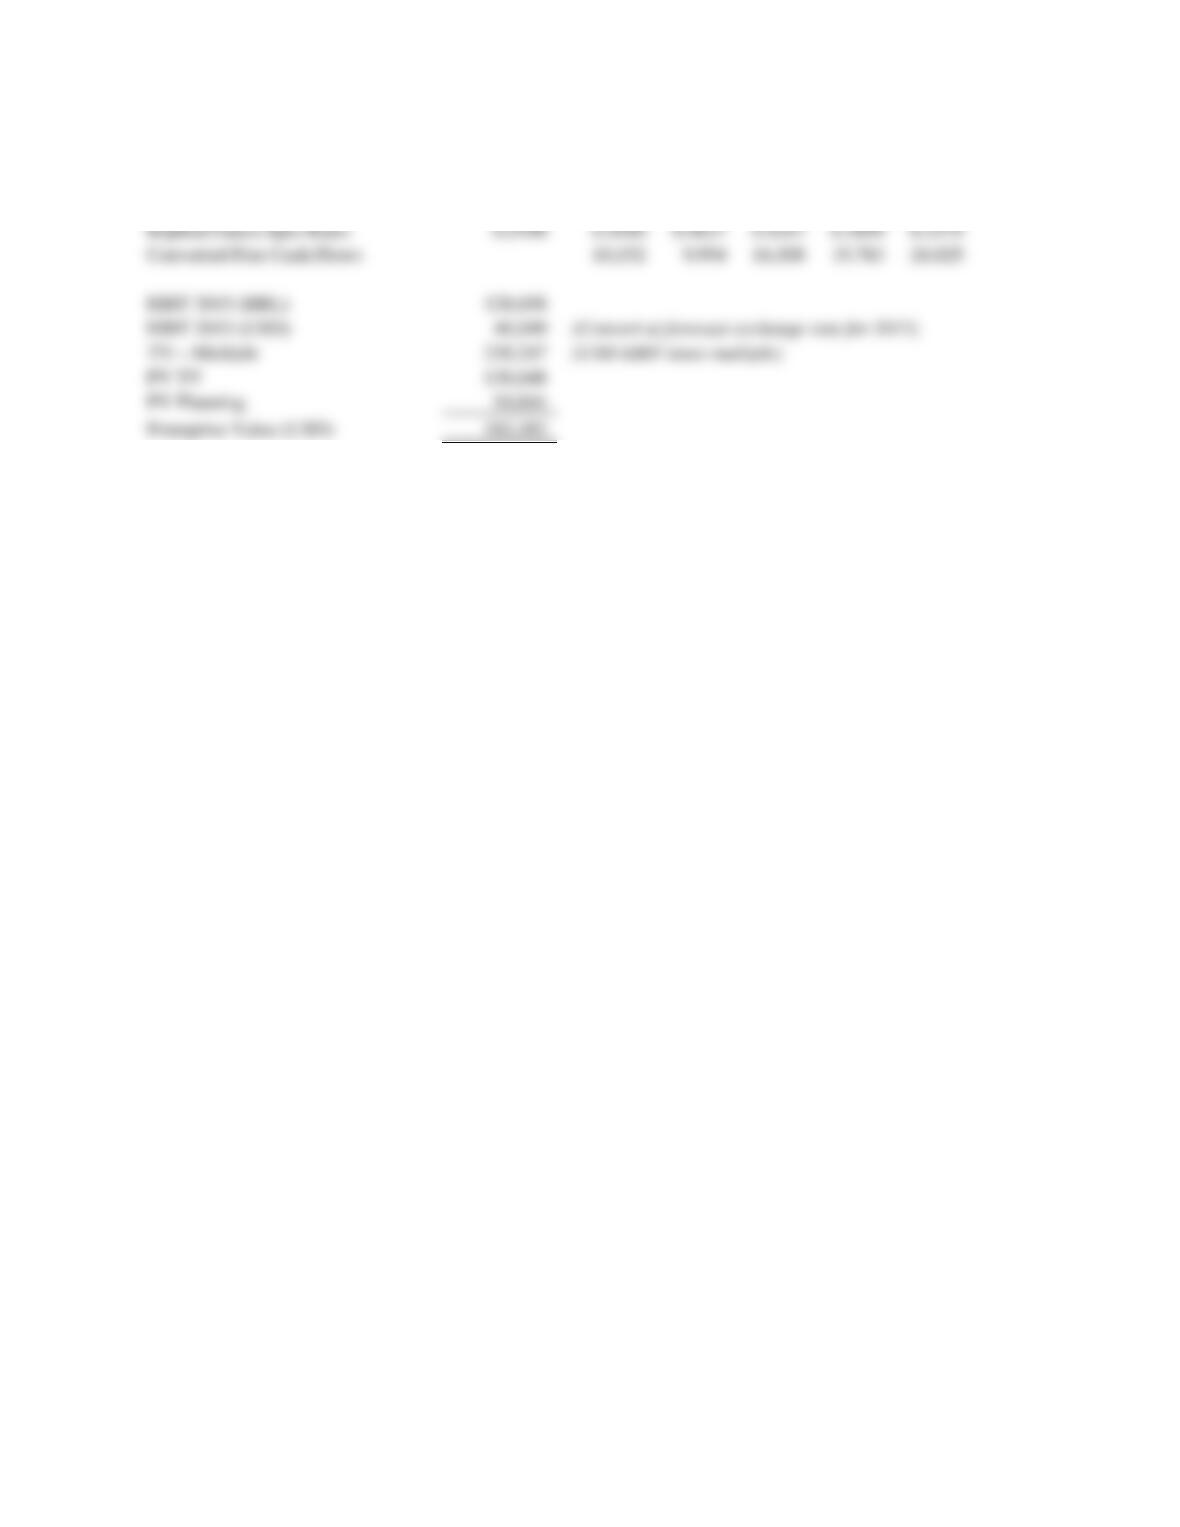
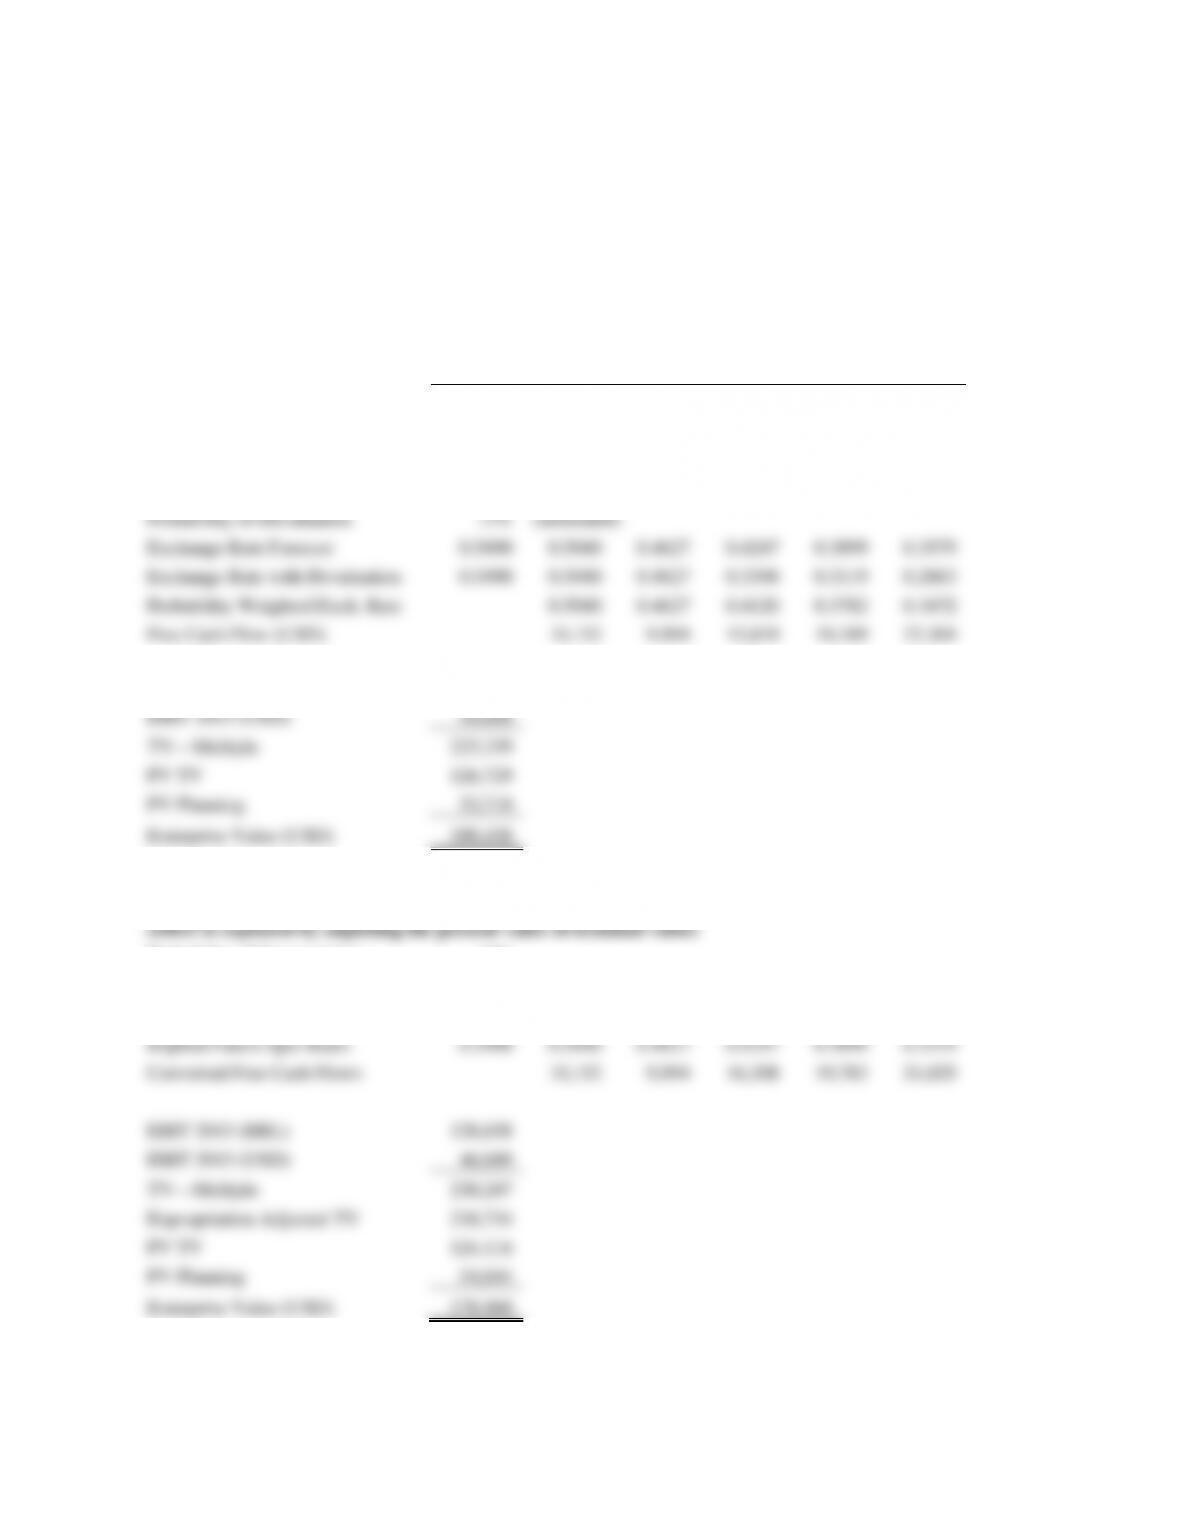
Exhibit TN2
MILAGROL LTDA.
Valuation Analysis—Alternate Exchange Rate Forecasts
(numbers in thousands of USD or BRL)
2010
2011
2012
2013
2014
2015
Free Cash Flow (BRL)
20,144
21,601
38,397
50,739
67,124
Exchange Rates Based on Inflation Rates
BRL Inflation Expectations
6.00%
7.00%
6.00%
5.50%
5.00%
U.S. Inflation Expectation
0.00%
0.50%
1.00%
1.50%
2.00%
Exchange Rate Forecast
0.5490
0.5179
0.4865
0.4635
0.4459
0.4332
Free Cash Flows Converted
10,433
10,508
17,797
22,627
29,078
EBIT 2015 (BRL)
128,658
EBIT 2015 (USD)
55,735
TV—Multiple
278,673
PV TV
158,126
PV Planning
61,240
Enterprise Value (USD)
219,366
Exchange Rates From Econo-Metrics
Exchange Rate Forecast
0.5490
0.5600
0.5400
0.4800
0.4300
0.3900
Free Cash Flows Converted
11,281
11,665
18,430
21,818
26,178
EBIT 2015 (BRL)
128,658
EBIT 2015 (USD)
50,177
TV—Multiple
250,883
PV TV
142,358
PV Planning
61,209
Enterprise Value (USD)
203,567
Exchange Rates from Yield Curve (missing years linearly interpolated)
USD Interest
0.26%
0.73%
1.20%
1.61%
2.01%
BRL Interest
12.00%
12.19%
12.38%
12.38%
12.37%
Exchange Rate Forecast
0.5490
0.4915
0.4413
0.3974
0.3593
0.3261
Free Cash Flows Converted
9,900
9,532
15,257
18,229
21,892
EBIT 2015 (BRL)
128,658
EBIT 2015 (USD)
41,962
TV—Multiple
209,808
PV TV
119,051
PV Planning
51,305
Enterprise Value (USD)
170,355
Source: Created by case writer.
-5- UVA-F-1578TN
Exhibit TN3
MILAGROL LTDA.
Valuation Analysis—Political Risk, Sovereign Spread Adjustment
(numbers in thousands of USD or BRL)
2010
2011
2012
2013
2014
2015
Free Cash Flow (BRL)
20,144
21,601
38,397
50,739
67,124
Sovereign Spread Adjustment of the Discount Rate
Sovereign Spread
1.63%
Adjusted Discount Rate
13.63%
(Sum of discount rate and spread)
Exchange Rate Forecast
0.5490
0.5040
0.4627
0.4247
0.3899
0.3579
Free Cash Flow (USD)
10,152
9,994
16,308
19,783
24,025
Note: Cash flows same as forecast with interest rate-based exchange rates (Exhibit TN1)
EBIT 2015 (BRL)
128,658
EBIT 2015 (USD)
46,049
TV—Multiple
230,247
PV TV
121,543
PV Planning
52,339
Enterprise Value (USD)
173,881
Source: Created by case writer.
-6- UVA-F-1578TN
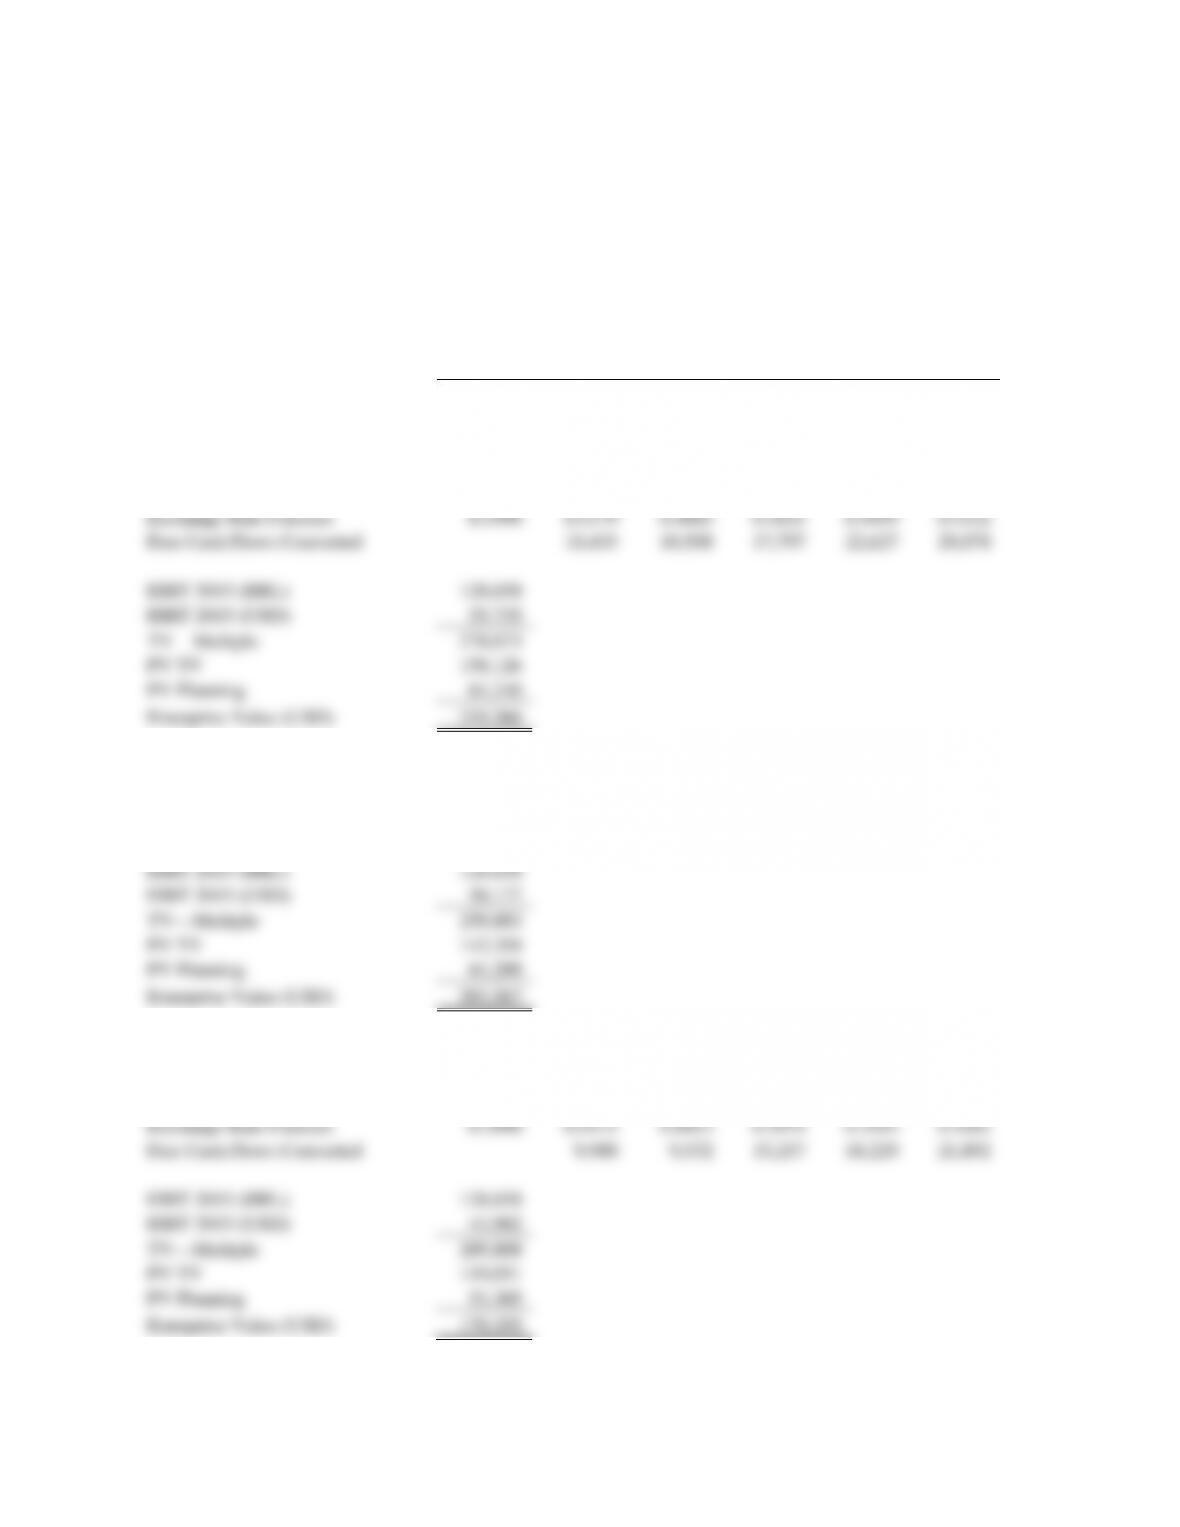
Exhibit TN4
MILAGROL LTDA.
Valuation Analysis—Political Risk, Devaluation or Expropriation
(numbers in thousands of USD or BRL)
2010
2011
2012
2013
2014
2015
Free Cash Flow (BRL)
20,144
21,601
38,397
50,739
67,124
Major Devaluation in 2013
Amount of Devaluation
20%
(assumed)
Probability of Devaluation
15%
(assumed)
Exchange Rate Forecast
0.5490
0.5040
0.4627
0.4247
0.3899
0.3579
Exchange Rate with Devaluation
0.5490
0.5040
0.4627
0.3398
0.3119
0.2863
Probability Weighted Exch. Rate
0.5040
0.4627
0.4120
0.3782
0.3472
Free Cash Flow (USD)
10,152
9,994
15,819
19,189
23,304
EBIT 2015 (BRL)
128,658
EBIT 2015 (USD)
44,668
TV—Multiple
223,339
PV TV
126,729
PV Planning
53,710
Enterprise Value (USD)
180,438
Serious Expropriation of Terminal Value
(effect is captured by adjusting the present value of terminal value)
Probability of Expropriation
10%
Proportion Expropriated
50%
Implied Future Spot Rates
0.5490
0.5040
0.4627
0.4247
0.3899
0.3579
Converted Free Cash Flows
10,152
9,994
16,308
19,783
24,025
EBIT 2015 (BRL)
128,658
EBIT 2015 (USD)
46,049
TV—Multiple
230,247
Expropriation Adjusted TV
218,734
PV TV
124,116
PV Planning
54,844
Enterprise Value (USD)
178,960
Source: Created by case writer.
-7- UVA-F-1578TN
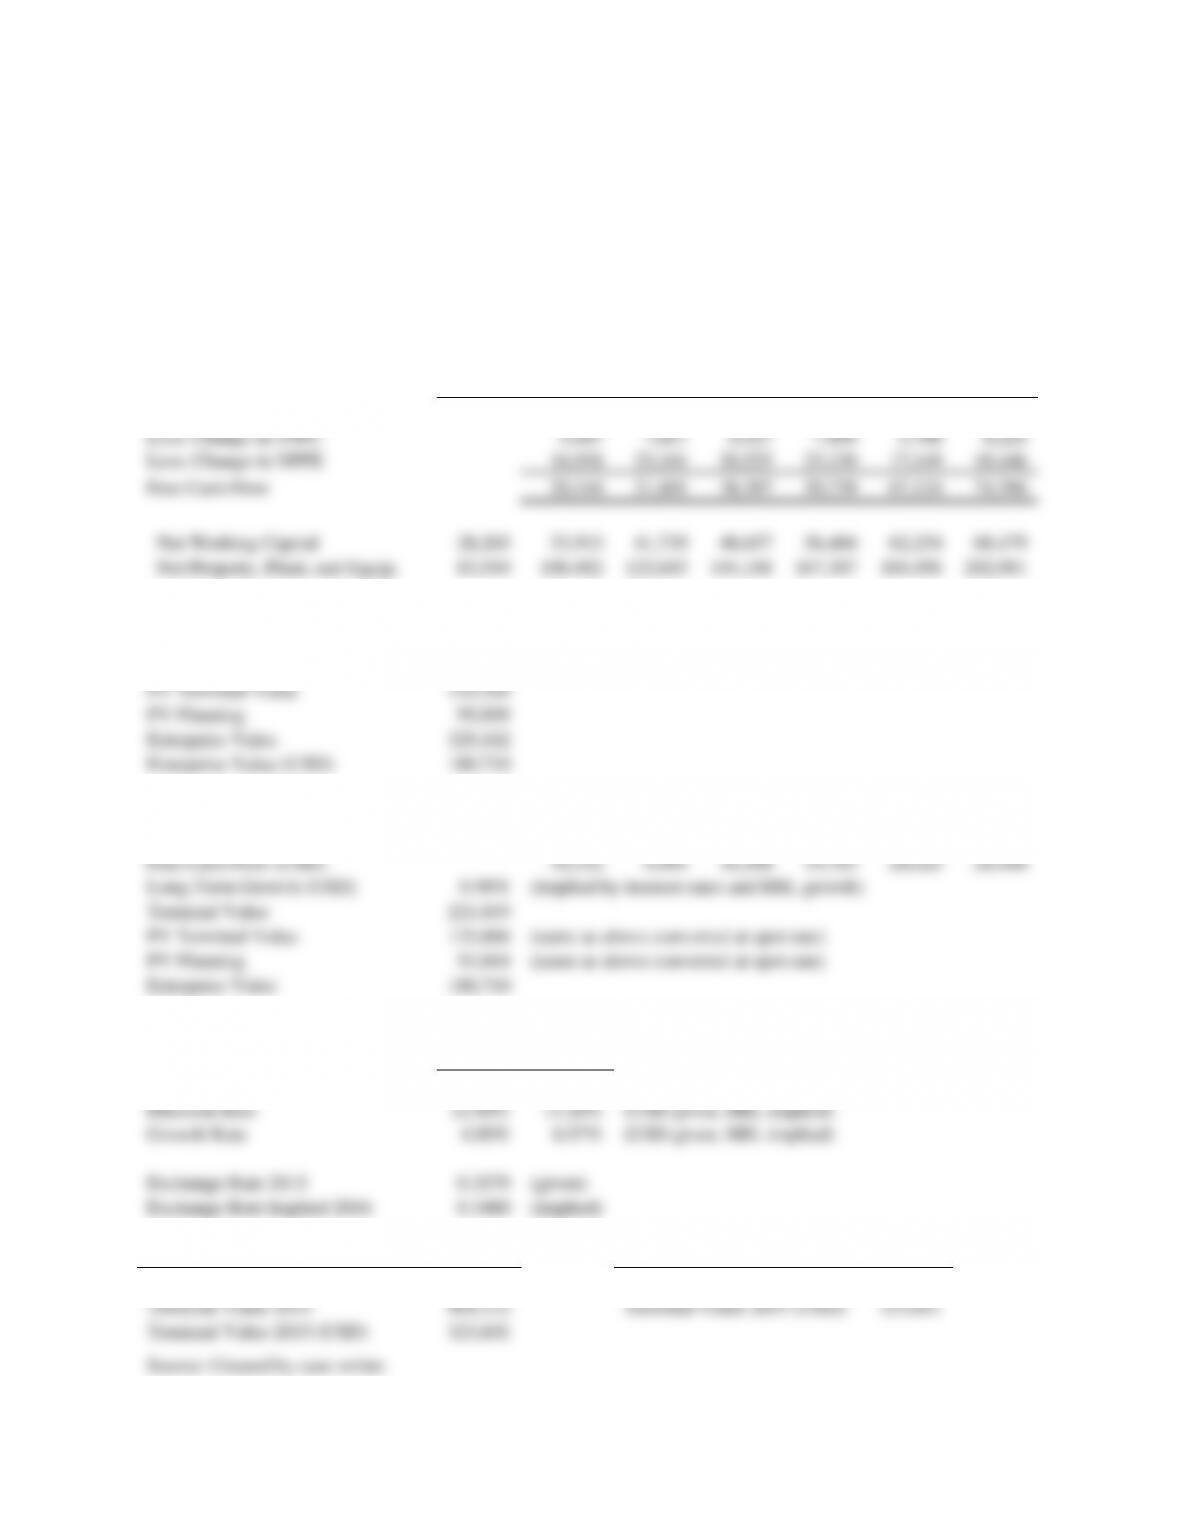
Exhibit TN5
MILAGROL LTDA.
Valuation Analysis—Political Risk, Devaluation
(numbers in thousands of USD or BRL)
Long-Term Growth (BRL)
8.00%
2010
2011
2012
2013
2014
2015
2016
Net Operating Profit after Tax (BRL)
42,730
52,579
65,849
81,687
90,060
99,066
Less: Change in NWC
5,647
7,817
6,927
7,809
5,788
6,225
Less: Change in NPPE
16,938
23,161
20,525
23,139
17,149
18,446
Free Cash Flow
20,144
21,601
38,397
50,739
67,124
74,396
Net Working Capital
28,265
33,913
41,730
48,657
56,466
62,254
68,479
Net Property, Plant, and Equip.
83,544
100,482
123,643
144,168
167,307
184,456
202,901
BRL Discount Rate
Discount Rate
22.00%
Terminal Value (BRL)
619,743
PV Terminal Value
229,264
PV Planning
99,898
Enterprise Value
329,162
Enterprise Value (USD)
180,710
USD Discount Rate
Exchange Rate
0.5040
0.4627
0.4247
0.3899
0.3579
0.3286
Free Cash Flow (USD)
10,152
9,994
16,308
19,783
24,025
24,444
Long-Term Growth (USD)
0.98%
(implied by interest rates and BRL growth)
Terminal Value
221,819
PV Terminal Value
125,866
(same as above converted at spot rate)
PV Planning
54,844
(same as above converted at spot rate)
Enterprise Value
180,710
Alternate Consistent Assumptions for Terminal Value
USD
BRL
Typical 10-Year Interest
5.00%
8.00%
(both given)
Discount Rate
12.00%
15.20%
(USD given, BRL implied)
Growth Rate
4.00%
6.97%
(USD given, BRL implied)
Exchange Rate 2015
0.3579
(given)
Exchange Rate Implied 2016
0.3480
(implied)
Analysis BRL
Analysis USD
Free Cash Flow 2016 (BRL)
74,396
Free Cash Flow 2016 (USD)
25,888
Terminal Value 2015
904,112
Terminal Value 2015 (USD)
323,601
Terminal Value 2015 (USD)
323,601
Source: Created by case writer.
-8- UVA-F-1578TN
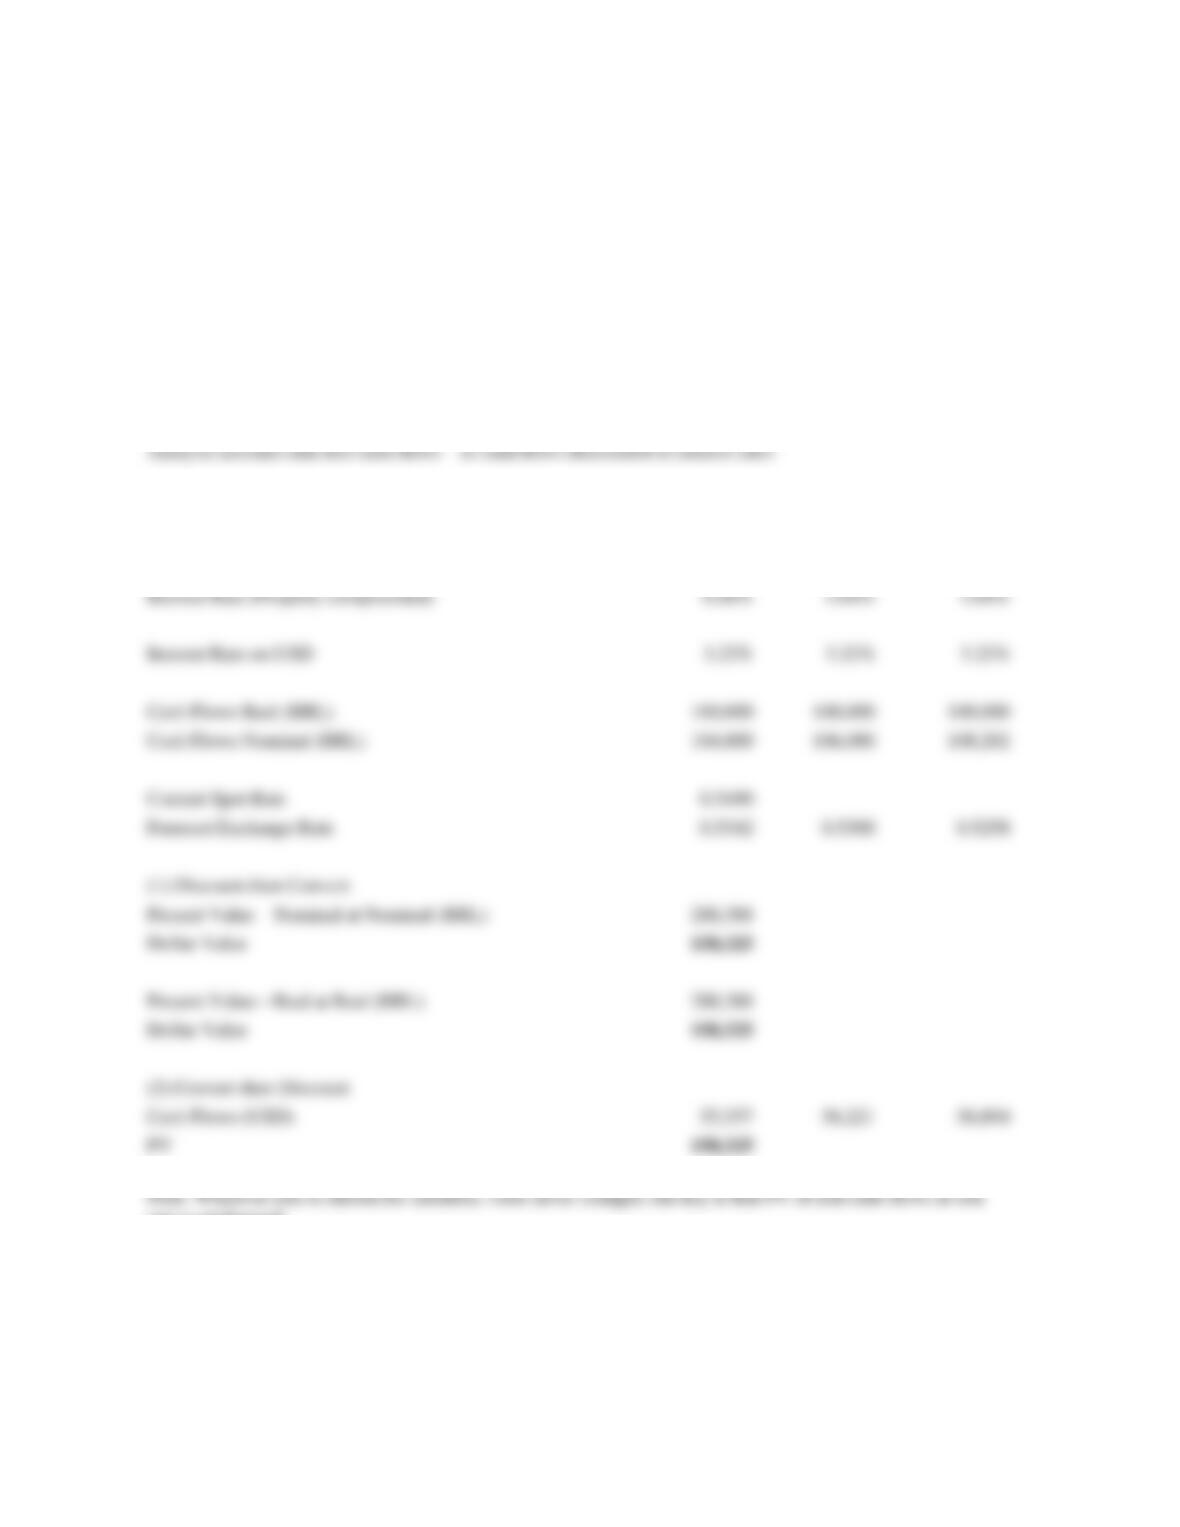
Exhibit TN6
MILAGROL LTDA.
Valuation Analysis—Irrelevance of Inflation When Markets Are in Parity
(numbers in thousands of USD or BRL)
Choose Inflation First Year
4%
Analysis assumes BRL inflation declines 2% in 2012
Analysis assumes risk-free cash flows—so cash flows discounted at interest rates
2011
2012
2013
Inflation BRL
4.00%
2.00%
2.00%
Real Rate of Return
2.00%
2.00%
2.00%
Interest Rate (Properly compounded)
6.08%
4.04%
4.04%
Interest Rate on USD
3.22%
3.22%
3.22%
Cash Flows Real (BRL)
100,000
100,000
100,000
Cash Flows Nominal (BRL)
104,000
106,080
108,202
Current Spot Rate
0.5490
Forecast Exchange Rate
0.5342
0.5300
0.5258
(1) Discount then Convert
Present Value—Nominal at Nominal (BRL)
288,388
Dollar Value
158,325
Present Value—Real at Real (BRL)
288,388
Dollar Value
158,325
(2) Convert then Discount
Cash Flows (USD)
55,557
56,221
56,894
PV
158,325
Note: Whatever rate is chosen for inflation, value never changes; the key is that PV of real cash flows at real
rate is unchanged.
Source: Created by case writer.