
The CASE Journal Volume 5, Issue 2 (Spring 2009)
admonishes firms to have the “discipline needed to set priorities for which markets to serve with
which benefits and features” (p. 11). Day also points out the importance of a customer focus.
Krill and her staff spent time with the ANN customers in 2005 when she was spearheading the
brand book development. (See Case Section 6: Ann Taylor’s Brand Identity.) How much time is
being spent with the customers now?
AS AN OPTIONAL ASSIGNMENT OR IN-CLASS EXERCISE: Although not mentioned in
the case, ANN’s Q1 2008 earnings conference call in May 2008, available for students to read at
http://seekingalpha.com/article/78473-ann-taylor-stores-corp-q1-2008-earnings-call-transcript,
and listen to at http://investor.anntaylor.com, is informative because Krill admits that ANN had
lost touch with its customer, especially the AT client.
What should Krill do as of mid-2008? There is no right or wrong answer to this final question.
Hence, the only difference between better and average students in terms of their content will lie
in their ability to make inferential leaps and propose reasonable recommendations for future
action.
Some of those recommendations might include the following:
• Discontinue the beauty business (this becomes a hard trade-off if the fragrance line is
working).
• Combine both LOFT and AT merchandise in one Factory concept store, marketed as
“off-the-rack” discounted items (saves on the need for investment in exterior architecture
differentiation, store display, and signage).
• Remove the Ann Taylor name from LOFT (like GAP did with Old Navy and Banana
Republic).
• Don’t spend time and resources on the separate “older women” concept. Instead, spend
time keeping close watch on customer trends, and include a wide range of boomer
fashions as part of the AT and LOFT merchandise offerings.
• Hire creative and capable merchandising managers and delegate appropriately so Krill
isn’t spread so thin.
• Revere the roots of the original Ann Taylor concept: the original brand is the most
valuable resource the company has. Position AT as the premier destination. Pursue
market penetration as the growth strategy.
• Remember, differentiation is all about hard choices and creating a value proposition that
targeted customers can’t ignore. ANN may currently be “stuck in the middle”, trying to
do too many things in too many markets with too few appropriate resources and
capabilities (especially in the human resource area). It seems that specialty retailers try to
follow each other’s lead too much. If someone can break from the crowd, that firm might
grab the lion’s share of the market.
TCJ05-02-02TN
31
For use in conjunction with Strategic Management 13E, Pearce & Robinson. Expiry date 2015.

The CASE Journal Volume 5, Issue 2 (Spring 2009)
SELECTED EXHIBITS/HANDOUTS
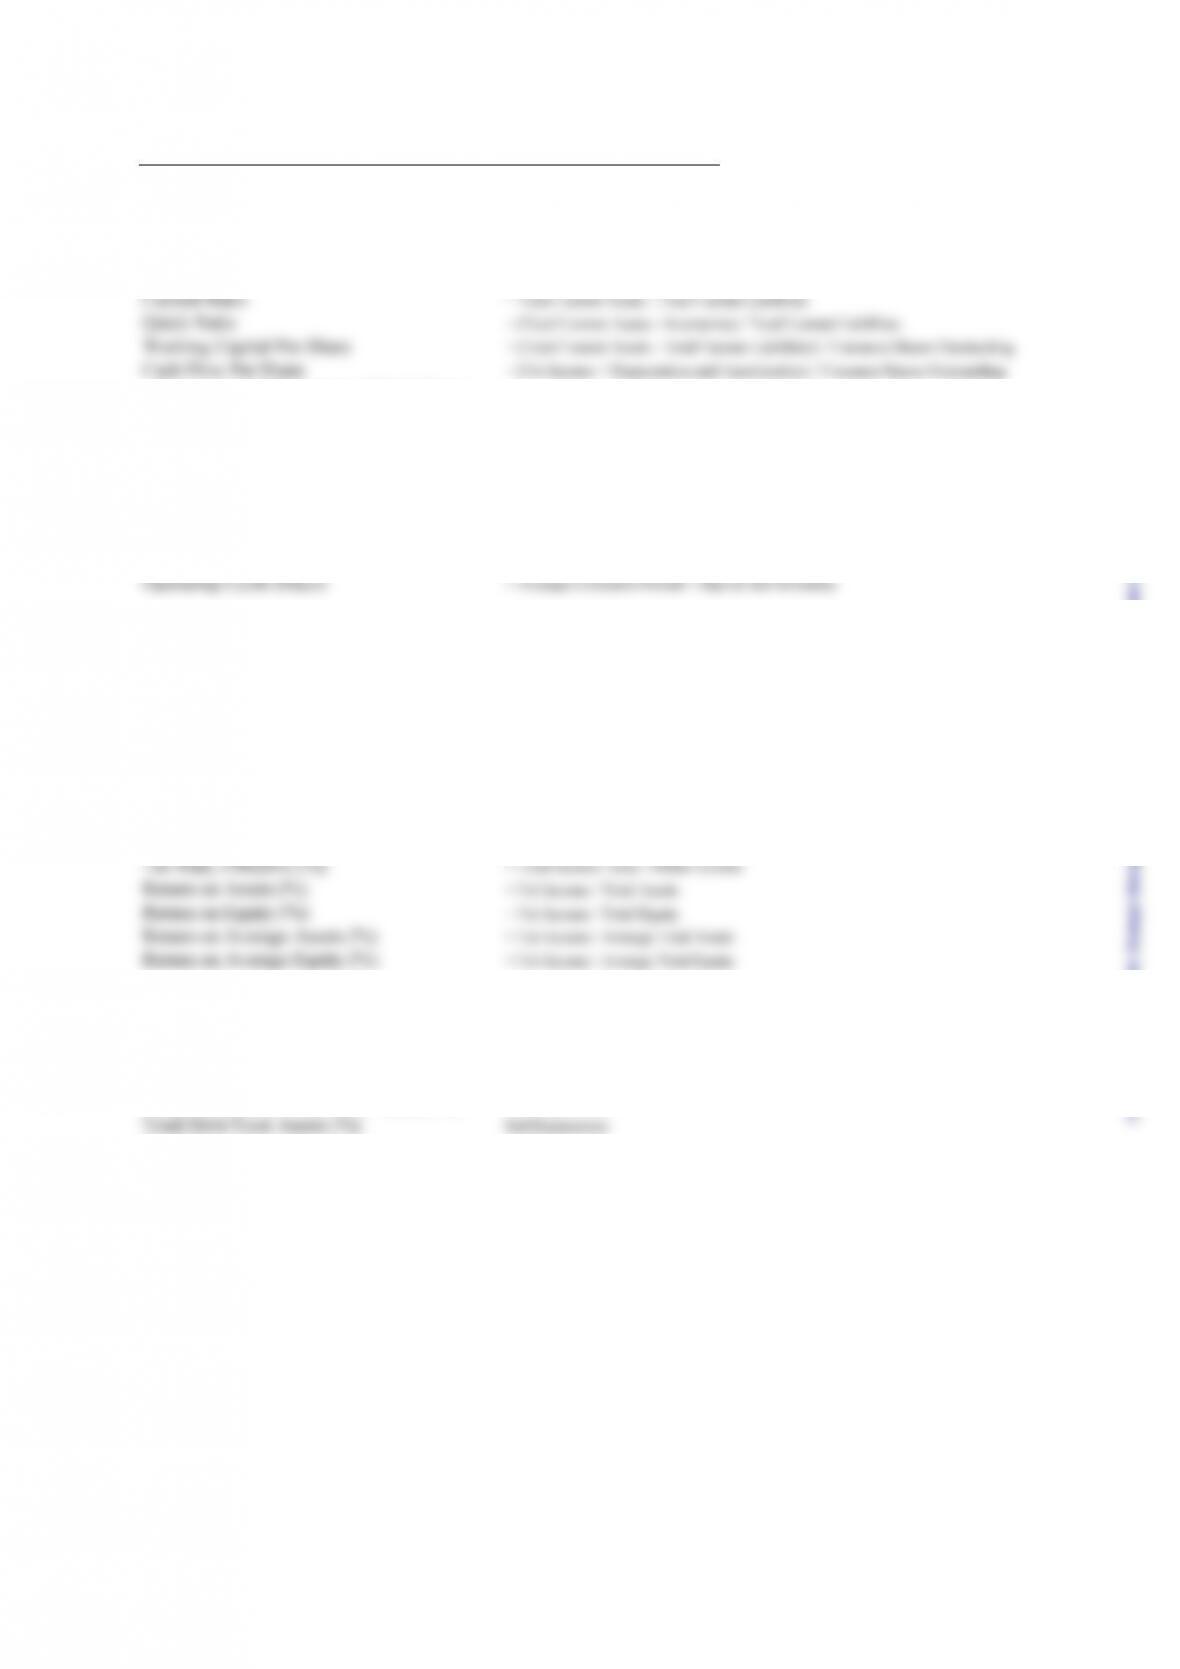
Exhibit A: Ann Taylor Stores Corp.
Selected Ratio Analysis for Fiscal Year Ended
LIQUIDITY Jan08 Jan07 Jan06 Jan05 Jan04
Current Ratio 1.62 2.31 2.63 2.41 3.57
Quick Ratio 0.51 1.26 1.54 1.10 2.16
Working Capital Per Share 3.20 5.64 5.77 4.86 6.11
Cash Flow Per Share 3.52 3.59 2.42 2.01 2.24
(Using Annual Statement of Cash Flows)
ACTIVITY
Inventory Turnover 4.25 4.47 4.26 4.12 N/A
Receivables Turnover 143.36 139.54 139.78 148.00 N/A
Total Asset Turnover 1.62 1.53 1.47 1.50 N/A
Average Collection Period (Days) 2.51 2.58 2.58 2.43 N/A
Days to Sell Inventory (Days) 84.76 80.47 84.55 87.30 N/A
Operating Cycle (Days) 87.27 83.05 87.13 89.73 N/A
PERFORMANCE
Sales/Net Property, Plant & Equipment 4.27 4.27 4.15 4.04 4.27
Sales/Stockholder Equity 2.85 2.85 2.23 2.00 2.00
PROFITABILITY
Operating Margin Before Depr 12.70 14.07 11.62 9.91 14.08
or EBITDA Margin (%)
Operating Margin After Depr (%) 7.83 9.55 7.09 5.66 10.81
Pretax Profit Margin (%) 6.72 10.19 6.67 5.74 10.60
Net Profit Margin (%) 4.06 6.10 3.95 3.41 6.36
Tax Rate, Effective (%) 39.62 40.12 40.78 40.50 40.02
Return on Assets (%) 6.98 9.12 5.48 4.77 8.76
Return on Equity (%) 11.58 13.62 7.91 6.83 12.15
Return on Average Assets (%) 6.56 9.34 5.81 5.10 17.53
Return on Average Equity (%) 10.29 13.72 8.35 7.20 24.30
LEVERAGE
Interest Coverage Before Tax 75.14 108.08 67.38 30.21 26.25
Interest Coverage After Tax 45.77 65.12 40.30 18.38 16.15
Long-Term Debt/Common Equity (%) 0.00 0.00 0.00 0.00 0.15
Long-Term Debt/Shareholder Equity (%) 0.00 0.00 0.00 0.00 0.15
Total Debt/Total Assets (%) 0.00 0.00 0.00 0.00 0.11
Total Assets/Common Equity 1.66 1.49 1.44 1.43 1.39
DIVIDENDS
Dividend Payout (%) 0.00 0.00 0.00 0.00 0.00
Source: Standard & Poor’s
TCJ05-02-02TN
32
For use in conjunction with Strategic Management 13E, Pearce & Robinson. Expiry date 2015.
The CASE Journal Volume 5, Issue 2 (Spring 2009)
Exhibit B: Definitions of Ratio Analysis Calculations
LIQUIDITY DEFINITION
(Using Annual Statement of Cash Flows)
ACTIVITY
Inventory Turnover = COGS / Average Inventory*
Receivables Turnover = Sales / Average Total Receivables
Total Asset Turnover = Sales / Average Total Assets
Average Collection Period (Days) = 360 / Receivables Turnover
Days to Sell Inventory (Days) = 360 / Inventory Turnover
PERFORMANCE
Sales/Net Property, Plant & Equipment Self Explanatory
Sales/Stockholder Equity Self Explanatory
PROFITABILITY
Operating Margin Before Depr = (Operating Income + Depreciation, Amortization & Depletion) / Sales
or EBITDA Margin (%)
Operating Margin After Depr (%) = Operating Income / Sales
Pretax Profit Margin (%) = Pretax Income / Sales
Net Profit Margin (%) = Net Income / Sales
LEVERAGE
Interest Coverage Before Tax = (Pretax Income + Interest Expense) / Interest Expense
Interest Coverage After Tax = (Net Income + Interest Expense) / Interest Expense
Long-Term Debt/Common Equity (%) Self Explanatory
Long-Term Debt/Shareholder Equity (%) Self Explanatory
Total Debt/Total Assets (%) Self Explanatory
Total Assets/Common Equity Self Explanatory
TCJ05-02-02TN
33
The CASE Journal Volume 5, Issue 2 (Spring 2009)
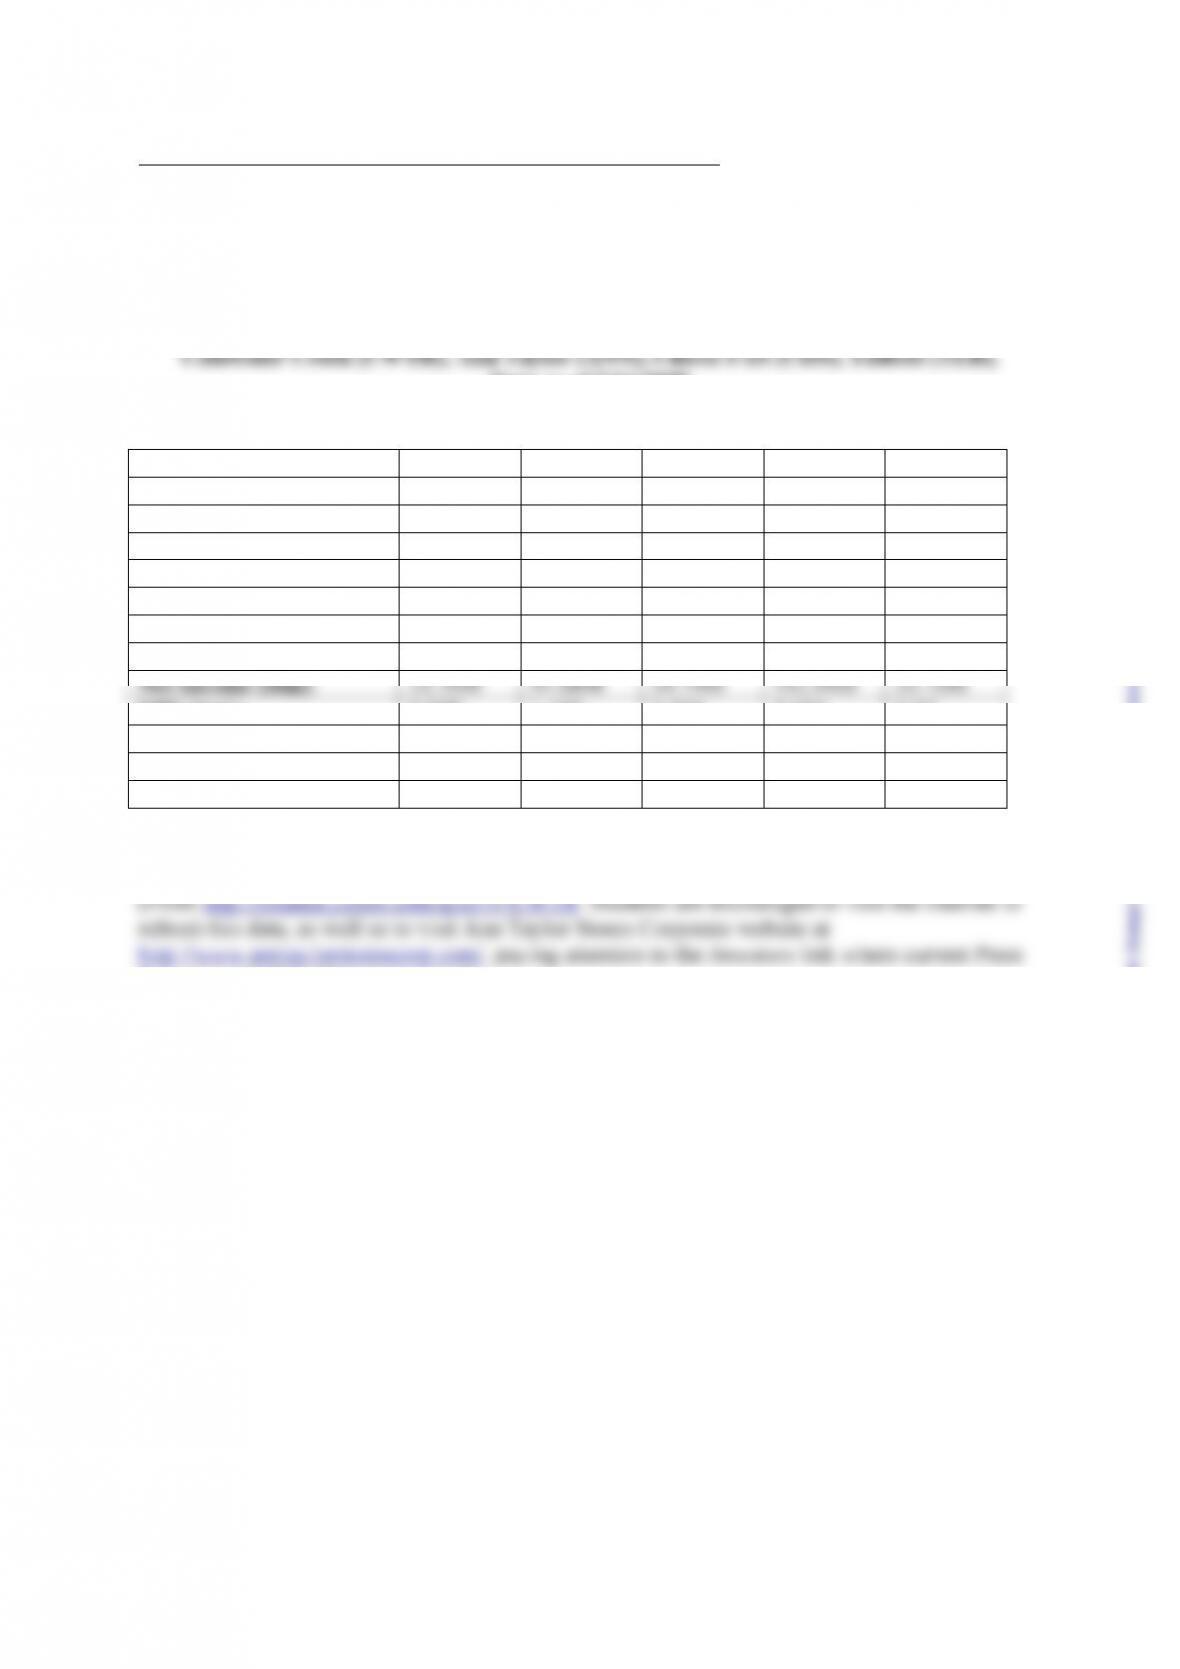
Handout A: Selected Financial Data: Current Competitor Comparison
Selected Financial Data: Current Competitor Comparison
Data as of 7/11/2008
CWTR ANN CHS TLB Industry
Market Cap: 441.83M 1.24B 859.27M 591.88M 400.65M
Key Employees: 3,394 5,500 5,720 6,300 3.14K
Qtrly Rev Growth (yoy): 3.60% 2.00% 9.60% 5.40% 5.10%
Revenue (ttm): 1.14B 2.41B 1.67B 2.26B 1.48B
Gross Margin (ttm): 36.32% 52.13% 54.95% 40.01% 31.68%
EBITDA (ttm): 12.29M 302.01M 159.38M 127.11M 70.97M
Oper Margins (ttm): 3.81% 7.60% 3.80% 0.24% 2.39%
EPS (ttm): 0.258 1.495 0.309 3.624 0.54
P/E (ttm): N/A 14.05 15.76 N/A 15.04
PEG (5 yr expected): N/A 0.8 0.98 0.79 0.91
P/S (ttm): 0.38 0.52 0.50 0.26 0.39
Industry = Apparel Stores.
Releases and SEC filings are posted.)
TCJ05-02-02TN
34
For use in conjunction with Strategic Management 13E, Pearce & Robinson. Expiry date 2015.
The CASE Journal Volume 5, Issue 2 (Spring 2009)
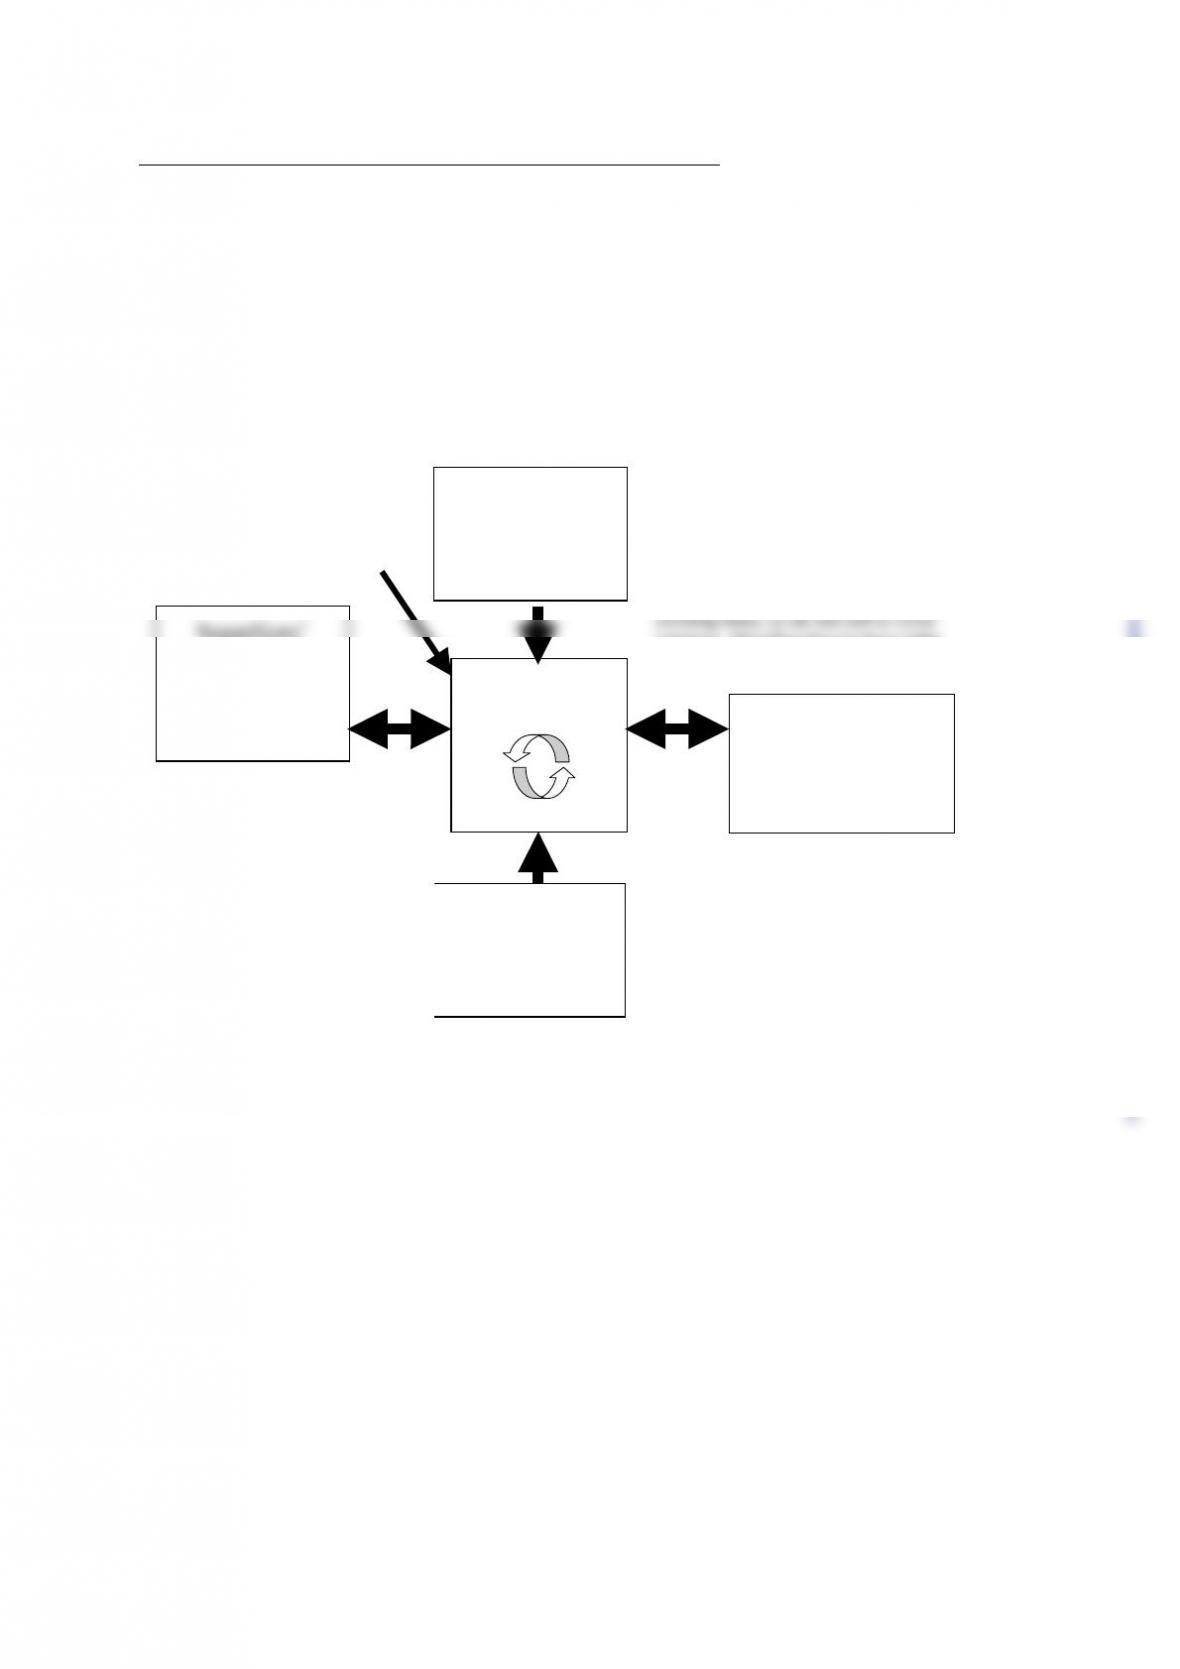
Handout B: Porter’s Five Forces Analysis
Porter’s Five Forces Analysis
Rivalry
High
Threat of
Substitutes
Low
Buyers’
Bargaining
Power
Low
Threat of
New Entrants
Med-High
Suppliers’
Bargaining
Power
Low
Suggested: There are no real substitutes
for a woman’s career wardrobe.
Suggested: The industry has low
concentration with many rivals
competing for market share. Some
p
roduct differentiation exists, but
a lack of switching costs means
firms will compete to steal
customers.
Suggested: Retail Buyers have many
choices of retailers and clothing lines.
However many women’s specialty
stores design their own private label
retailers. Therefore buyers have little
p
ower.
Suggested: At the regional level, entry
is not difficult as a retailer can enter as
small scale with little capital and be
able to find raw materials/suppliers
and target consumers. Likely entry is
from expansion of existing
competitors (similar to what ANN did
with LOFT). However, at a national
level, entry is more difficult.
Suggested: Given that there are
many supplier firms and that there
is a lack of differentiation between
them, their power is lowered. Some
switching costs may exist if the
clothing buyer changes suppliers,
but the costs are manageable. Lots
of capacity exists in Asia and
suppliers have few alternative
markets in which to sell their
p
roducts, reducing their power.
TCJ05-02-02TN
35
The CASE Journal Volume 5, Issue 2 (Spring 2009)
TEACHING NOTE REFERENCES
(and possible additional assigned readings)
Aaker, D.A. 2007. Strategic Market Management, 8th edition, Wiley & Sons.
Marketing, 54(1): 27-41.
Ansoff, H.I. 1957. “Strategies for diversification”. Harvard Business Review, 35(5): 113-124.
Barney, J. 1991. “Firm resources and sustained competitive advantage”, Journal of Management,
17(1): 99-120.
14.
Grant, R.M. 1991. “The resource-based theory of competitive advantage: Implications for
strategy formulation”, California Management Review, 33(3): 114-135.
O’Riordan, C. 2006. “Using the VRIO framework in practicing firms taking the resource-based
view (RBV)”, Accountancy Ireland, 38(3): 42-44.
Porter, M.E. 1985. Competitive Advantage: Creating and sustaining superior performance. New
York: The Free Press. (Republished with a new introduction, 1998.)
Porter, M.E. 1996. “What is strategy?”, Harvard Business Review, 74(6): 61-78.
Porter, M.E. 2008. “The five competitive forces that shape strategy”, Harvard Business
Review,86(1): 78-93.
Prahalad, C.K. & Hamel, G. 1990. “The core competence of the corporation”, Harvard Business
Review, 68(3): 79-91
TCJ05-02-02TN
36

The CASE Journal Volume 5, Issue 2 (Spring 2009)
i Letter to Shareholders, ANN 2007 Annual Report, at
http://investor.anntaylor.com/phoenix.zhtml?c=78167&p=irol-reportsAnnual
ii This article is also available in the Handbook of Niche Marketing, by Tevfik Dalgic, published in 2006 by Haworth
Press, with a preview at
TCJ05-02-02TN
37
For use in conjunction with Strategic Management 13E, Pearce & Robinson. Expiry date 2015.