PA7–5
Req. 1
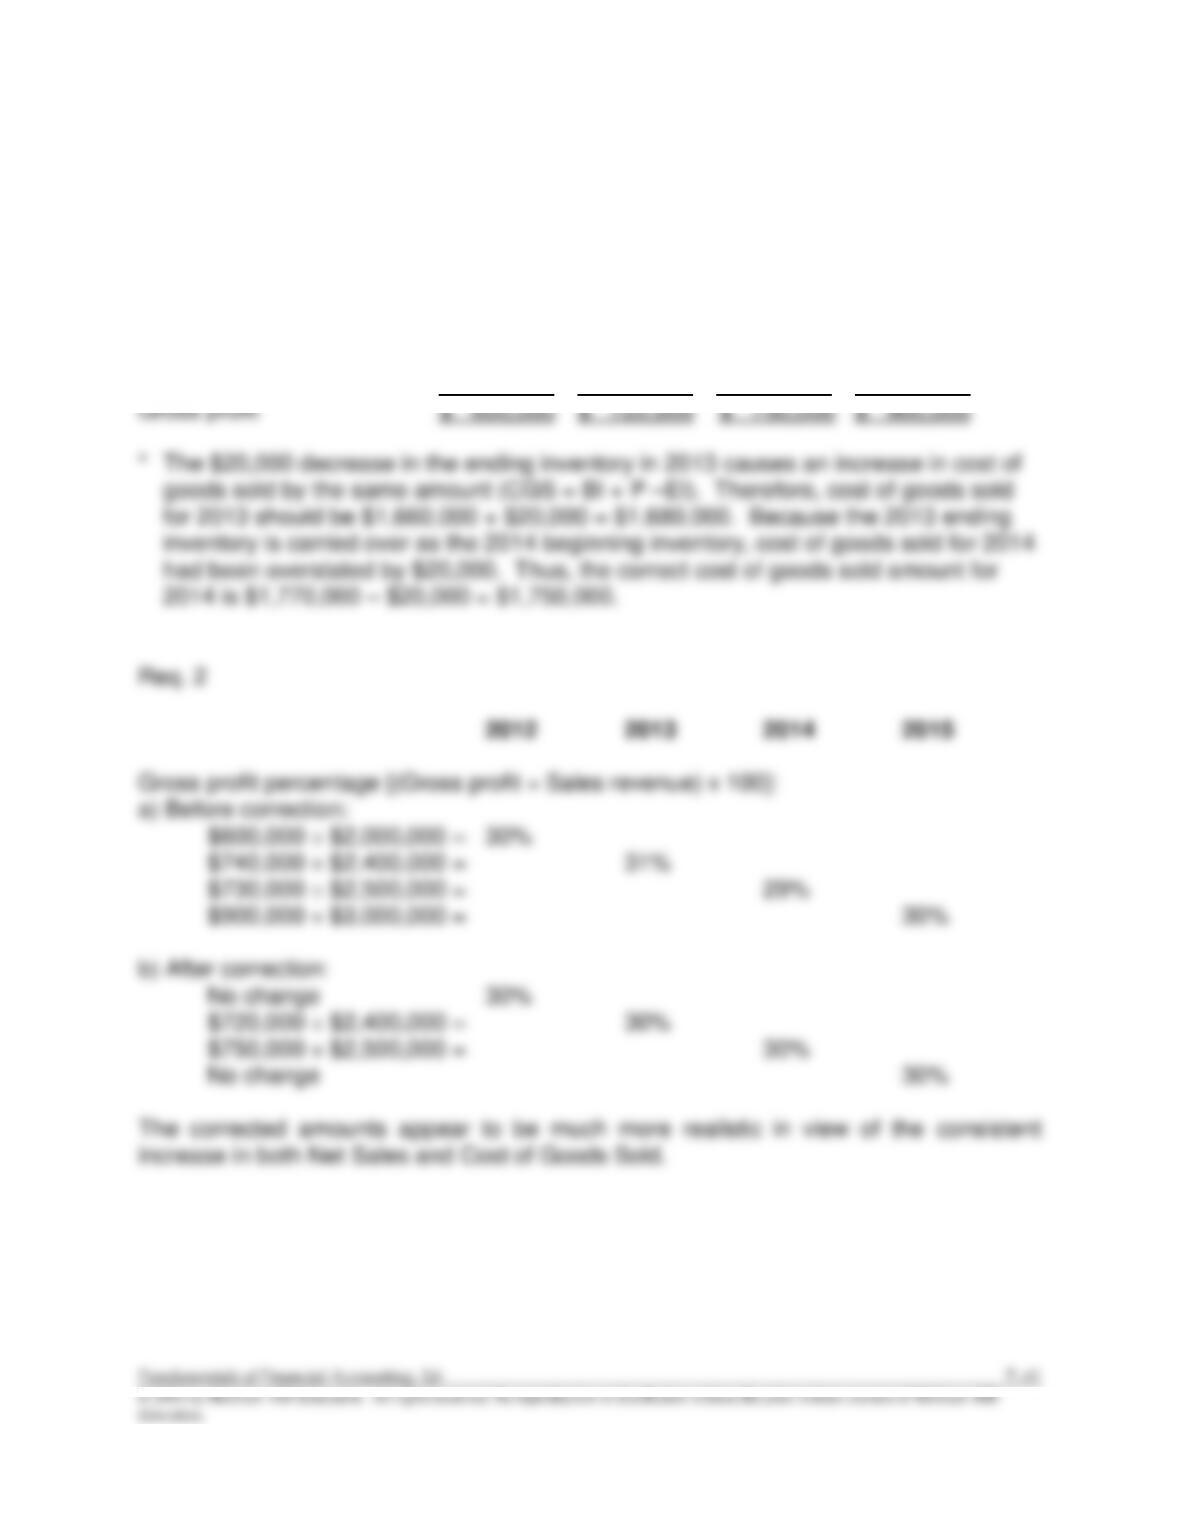
Sherwood Company
Income Statements (Corrected)
2012 2013 2014 2015
Net Sales $2,000,000 $2,400,000 $2,500,000 $3,000,000
Cost of goods sold 1,400,000 1,680,000* 1,750,000* 2,100,000
7–42 Solutions Manual
© 2016 by McGraw–Hill Education. All rights reserved. No reproduction or distribution without the prior written consent of McGraw-Hill
Education.
ANSWERS TO GROUP B PROBLEMS
PB7–1
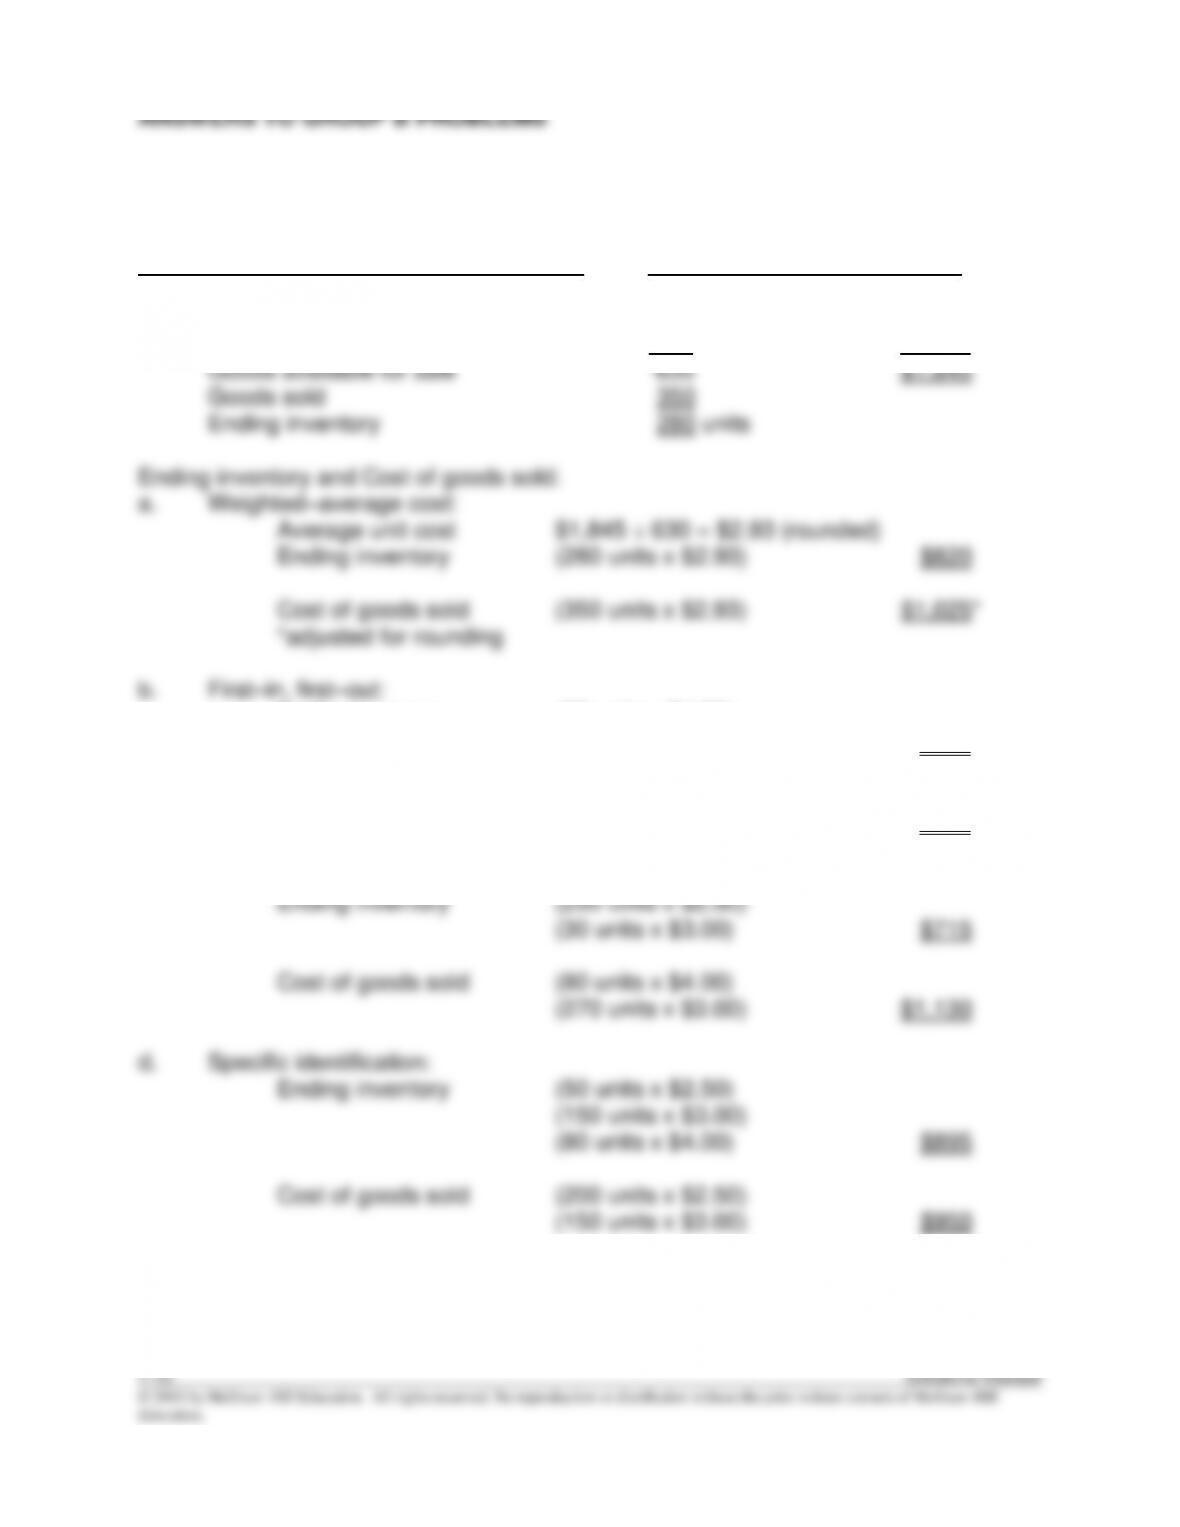
Req. 1 Unit Total
Goods available for sale for all methods: Units Cost Cost
Beginning inventory, January 1 250 $2.50 $625
Purchase, January 12 300 3.00 900
Purchase, January 26 80 4.00 320
Ending inventory (80 units x $4.00)
(200 units x $3.00) $920
Cost of goods sold (250 units x $2.50)
(100 units x $3.00) $925
c. Last–in, first–out:
PB7–1 (continued)
Req. 2
PB7–2
Req. 1
MONDETTA CLOTHING
Income Statement (LCM basis)
For the Year Ended December 31
Net Sales $420,000
Original
Replacement
LCM
Item
Unit Cost
Cost (Market)
per Unit
Quantity
LCM Valuation
A
$4.50
$6.00
$4.50
x
3,000
$13,500
B
6.00
3.00
3.00
x
1,500
4,500
C
3.00
6.00
3.00
x
7,000
21,000
D
7.50
4.50
4.50
x
3,000
13,500
LCM Inventory Valuation
$52,500
PB7–2 (continued)
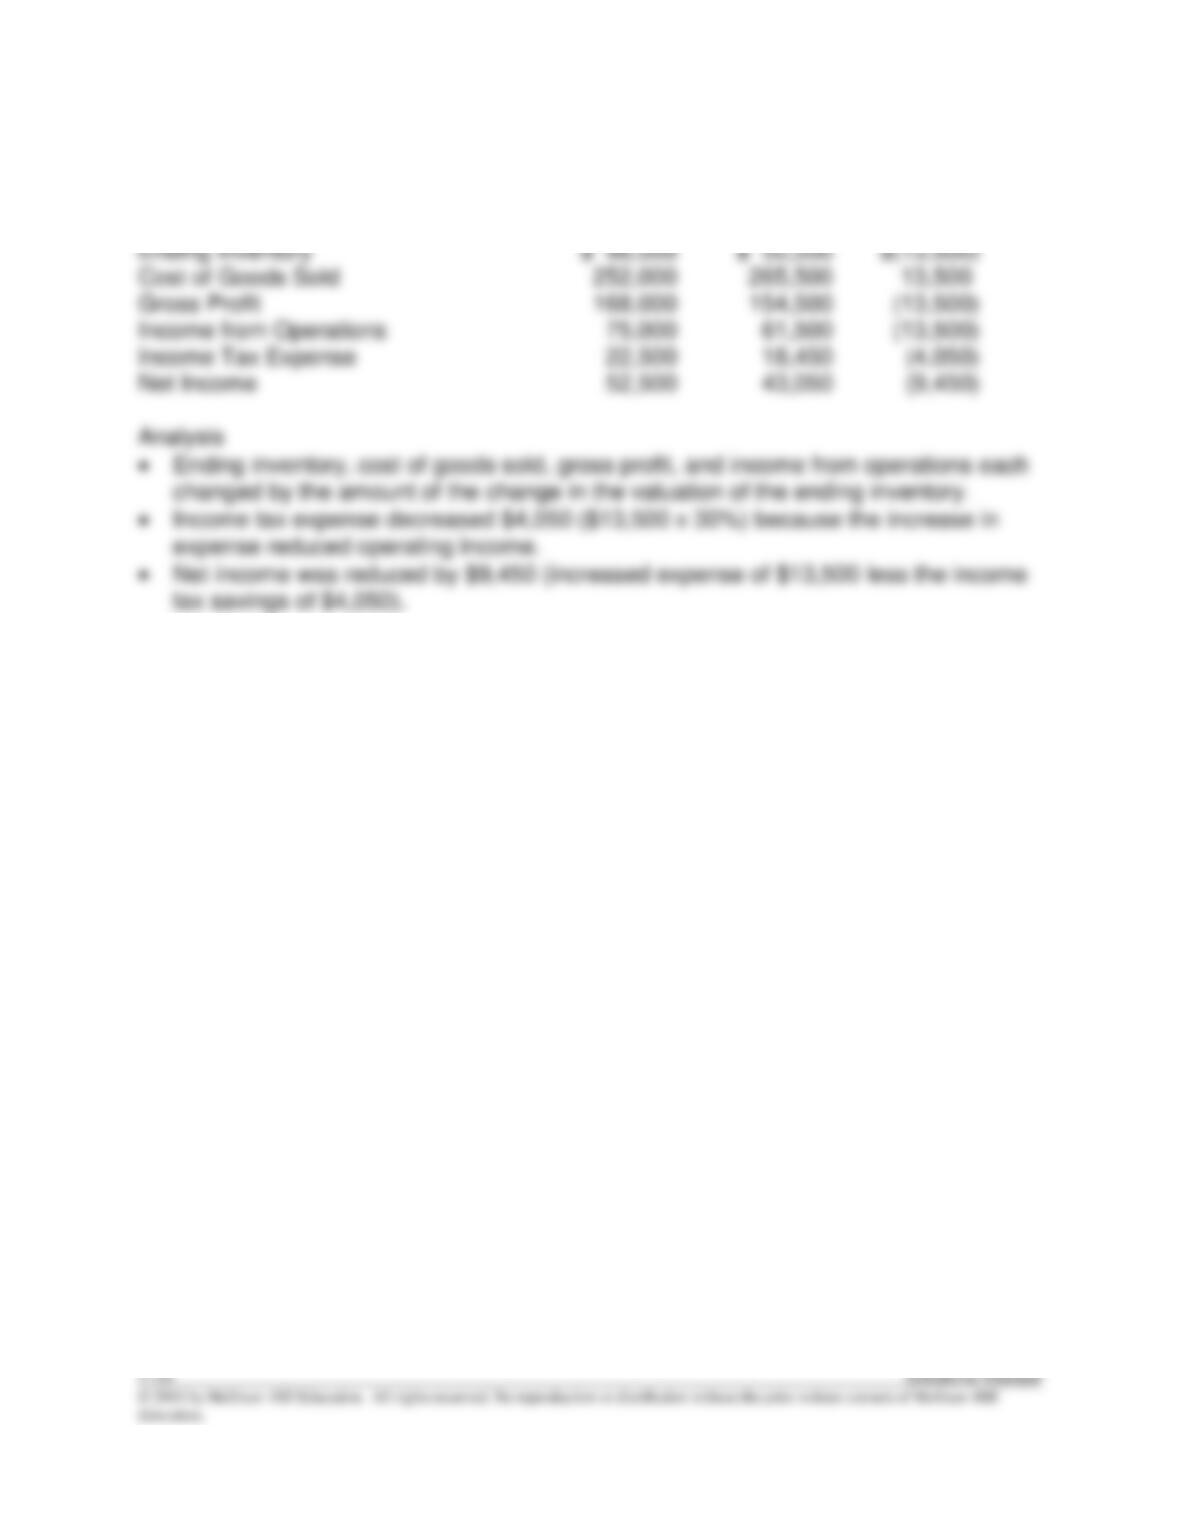
Req. 2 Amount of
FIFO LCM Increase
Item Changed Cost Basis Basis (Decrease)
PB7–3
Req. 1
2012
2011
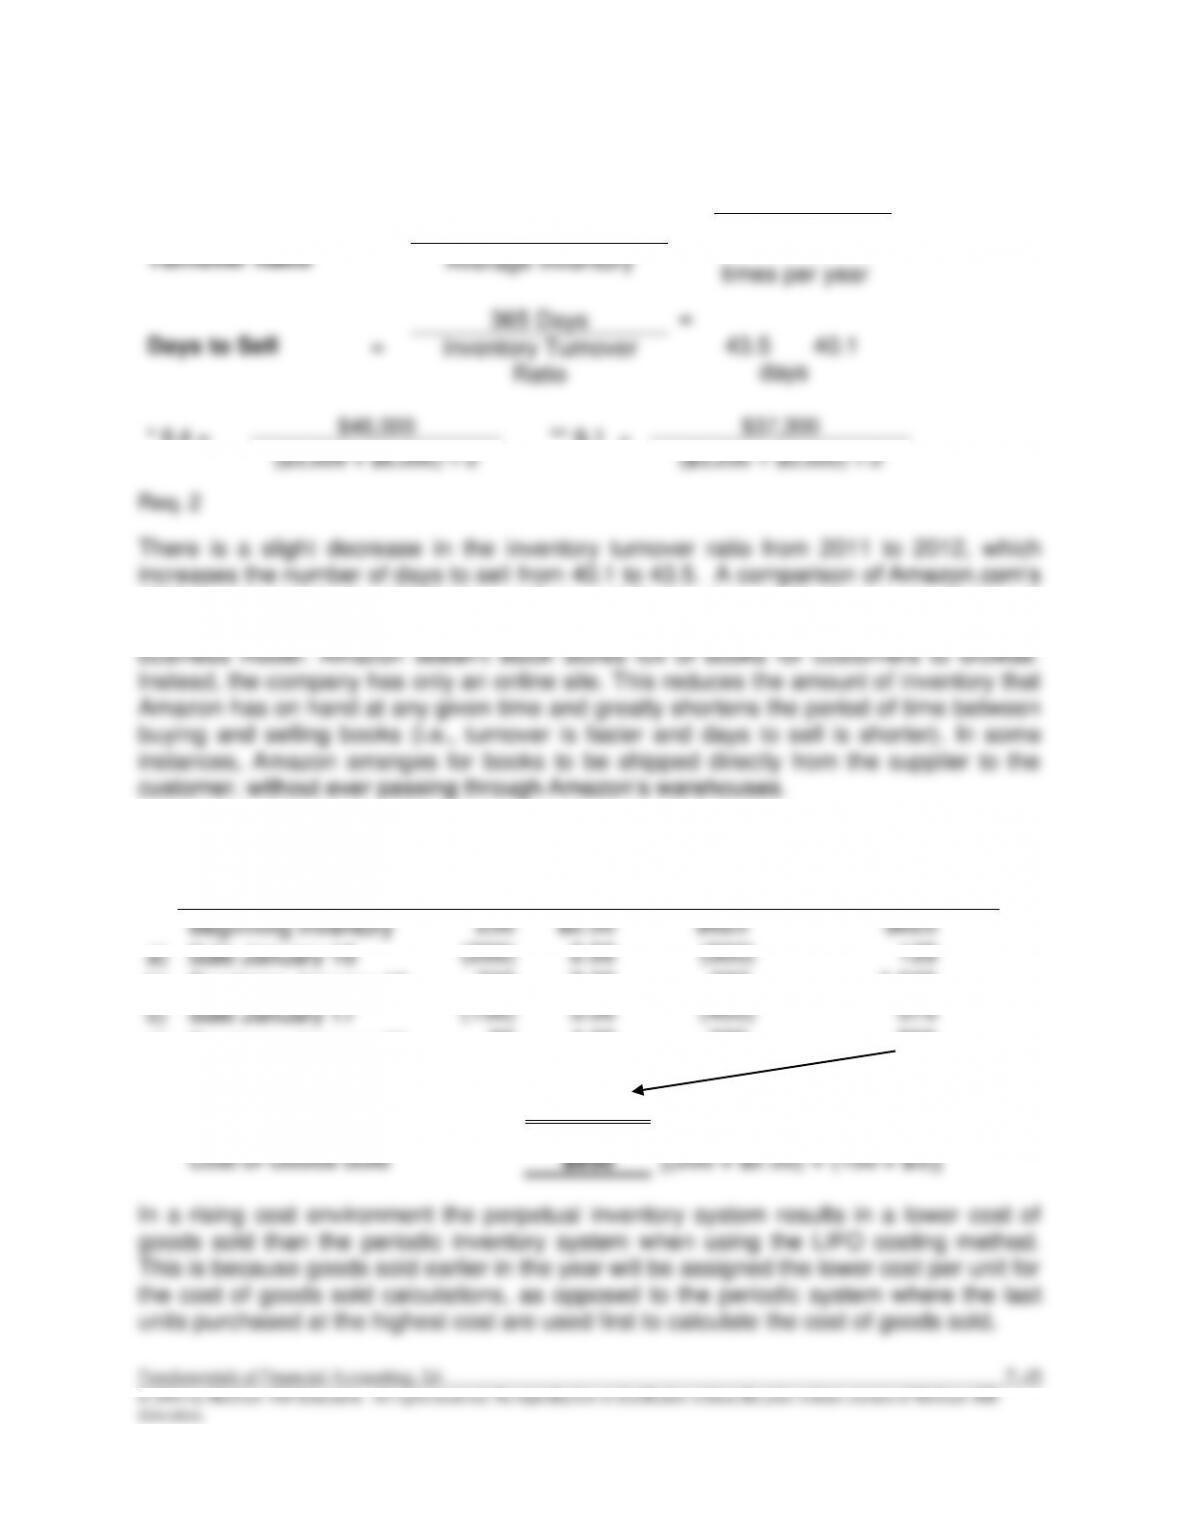
Inventory
Turnover Ratio
=
Cost of Goods Sold
=
8.4*
9.1**
Average Inventory
Days to Sell
=
365 Days
=
43.5
40.1
Inventory Turnover
Ratio
* 8.4 =
$46,000
** 9.1 =
$37,300
($5,000 + $6,000) ÷ 2
($3,200 + $5,000) ÷ 2
Req. 2
There is a slight decrease in the inventory turnover ratio from 2011 to 2012, which
increases the number of days to sell from 40.1 to 43.5. A comparison of Amazon.com’s
43.5 days to sell to the 104.3 days at Barnes & Noble, Inc., really does make Barnes &
Noble seem like a library. This dramatic difference is caused by Amazon.com’s
PB7–4
Remaining
Perpetual LIFO
Units
Unit Cost
Total Cost
Inventory Value
Beginning Inventory
250
$2.50
$625
$625
a)
Sale January 10
(200)
2.50
(500)
125
b)
Purchase January 12
300
3.00
900
1,025
c)
Sale January 17
(150)
3.00
(450)
575
d)
Purchase January 26
80
4.00
320
895
Ending Inventory
$895
[(50 x $2.50) + (150 x $3) + (80 x $4)]
Cost of Goods Sold
$950
[(200 x $2.50) + (150 x $3)]
In a rising cost environment the perpetual inventory system results in a lower cost of
goods sold than the periodic inventory system when using the LIFO costing method.
This is because goods sold earlier in the year will be assigned the lower cost per unit for
the cost of goods sold calculations, as opposed to the periodic system where the last
units purchased at the highest cost are used first to calculate the cost of goods sold.
times per year
days
PB7–5
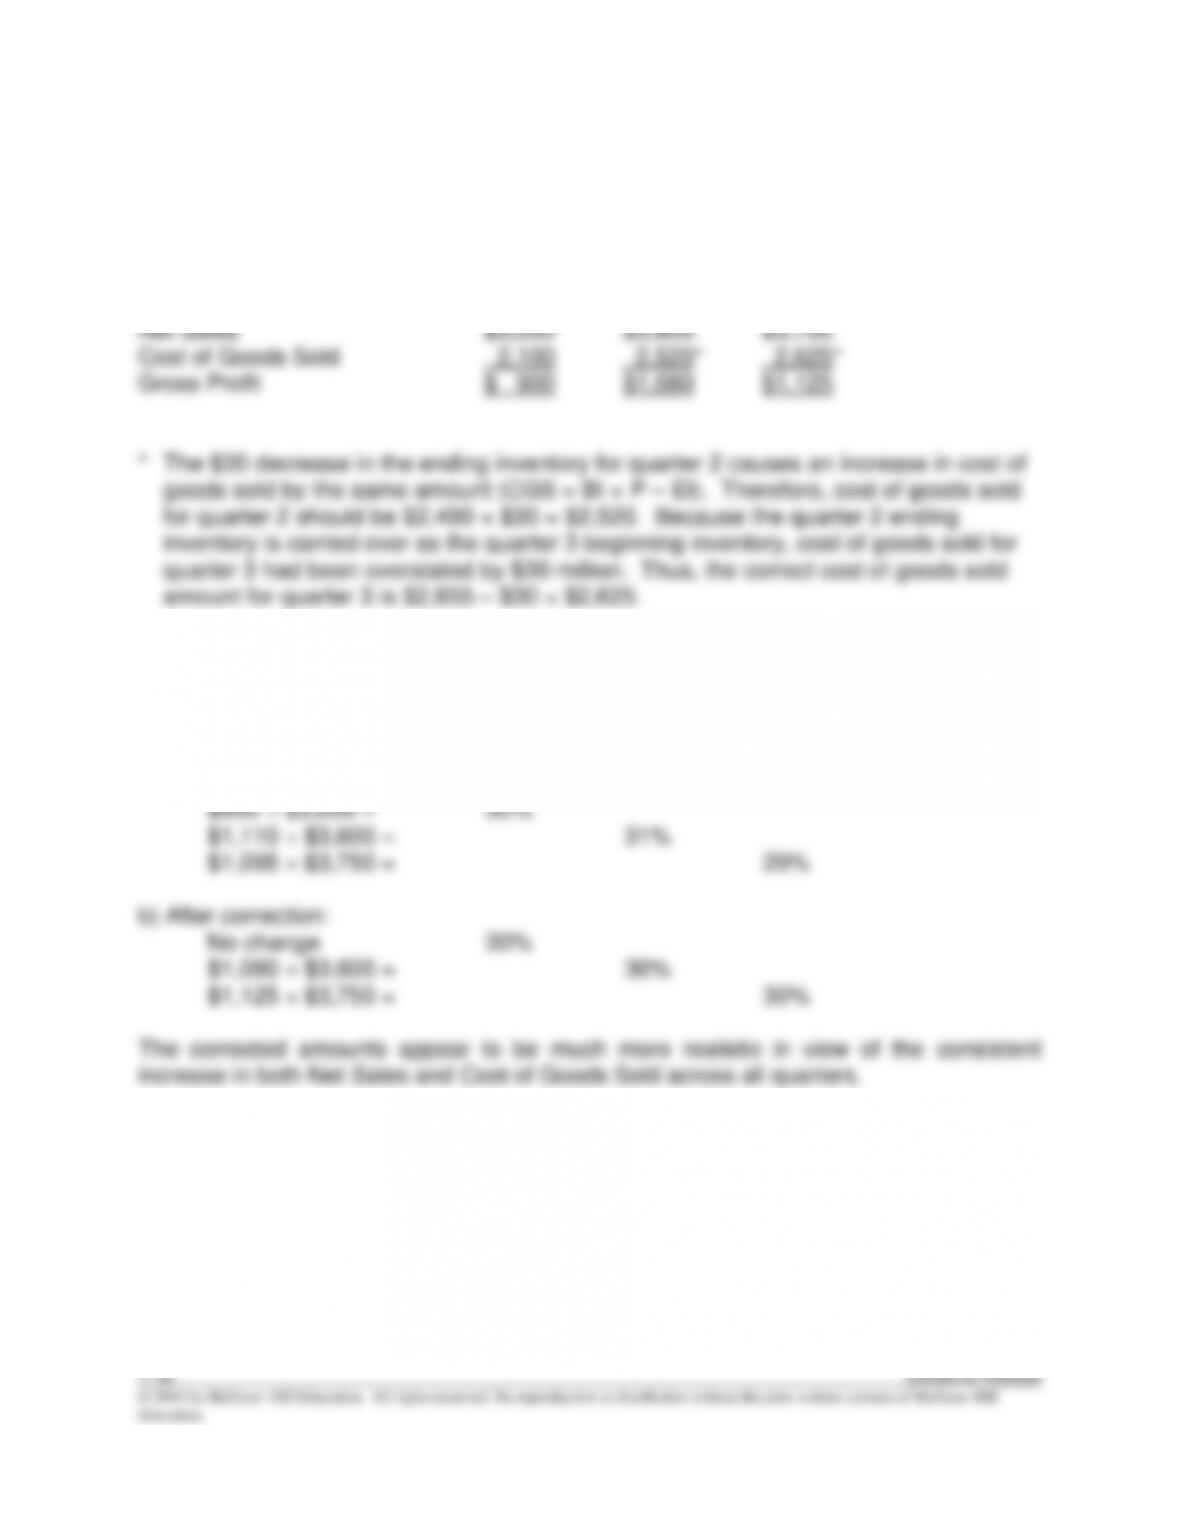
Req. 1 Spears & Cantrell Company
Income Statements (Corrected)
Q1 Q2 Q3
PB7–5 (continued)
Req. 2
Q1 Q2 Q3
Gross profit percentage [(Gross profit ÷ Sales revenue) x 100]:
a) Before correction:
ANSWER TO COMPREHENSIVE PROBLEMS
C7–1
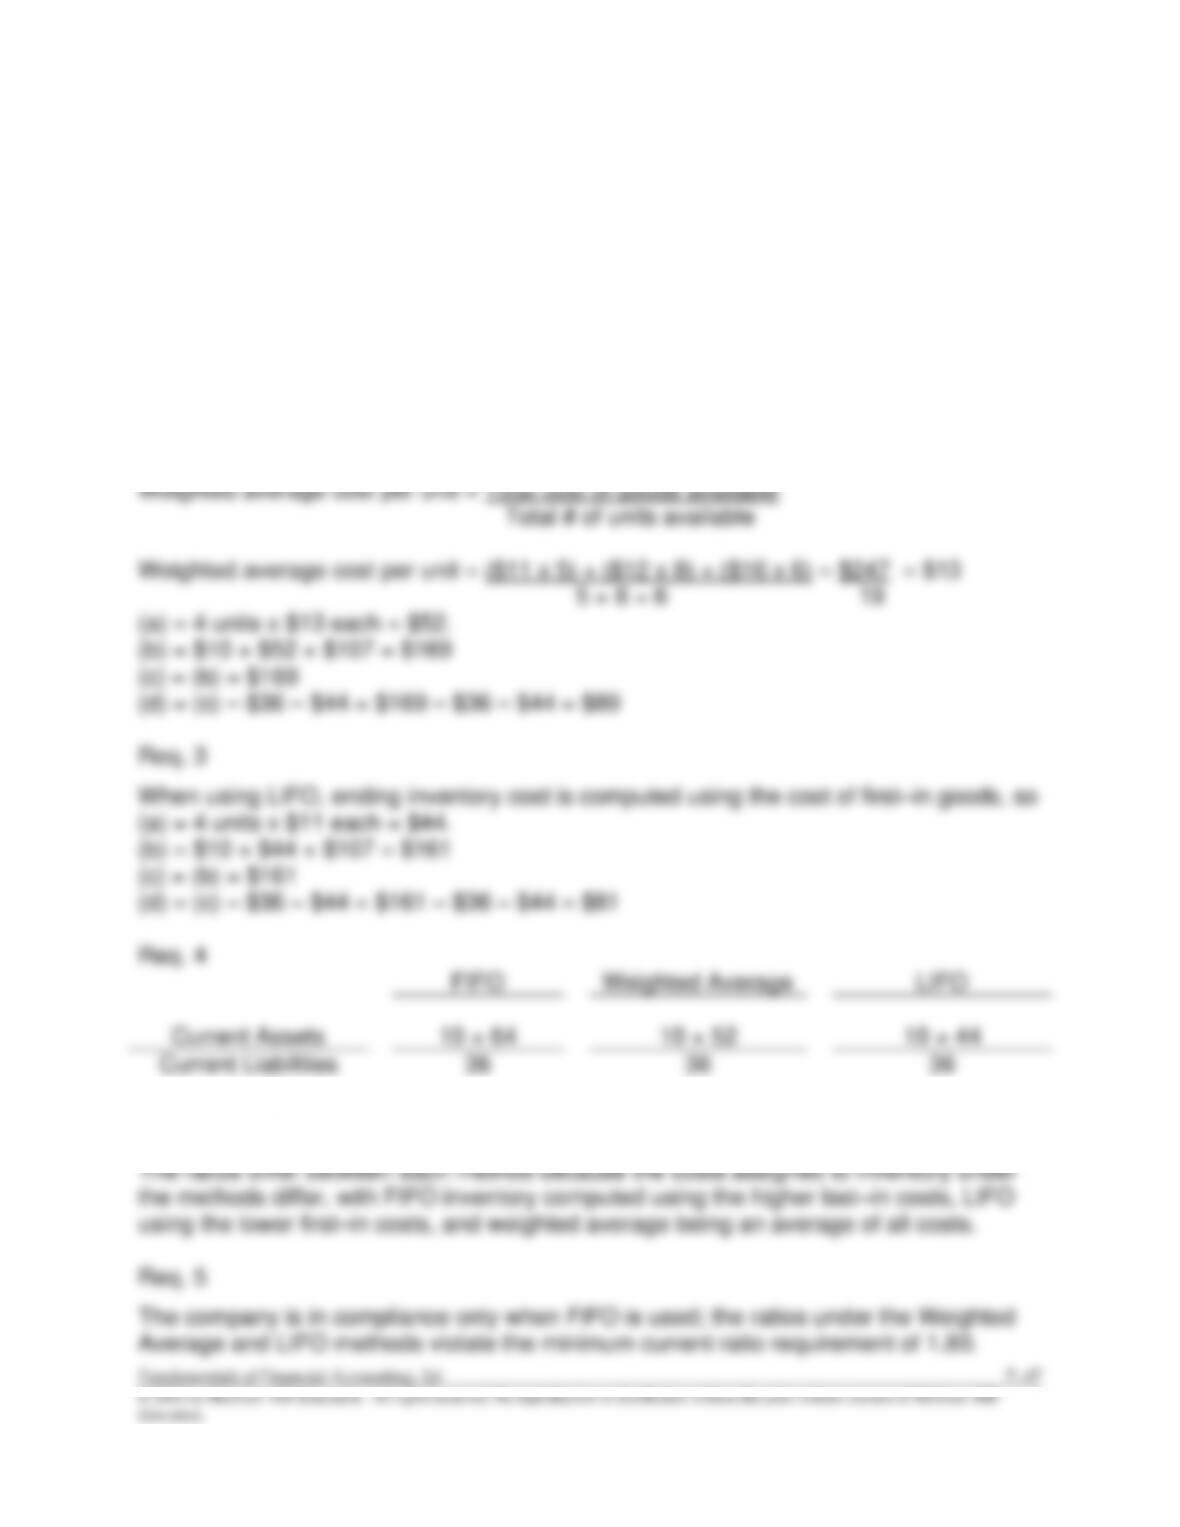
Req. 1
When using FIFO, ending inventory cost is computed using the cost of last–in goods, so
(a) = 4 units x $16 each = $64.
(b) = $10 + $64 + $107 = $181
(c) = (b) = $181
(d) = (c) – $36 – $44 = $181 – $36 – $44 = $101
Req. 2
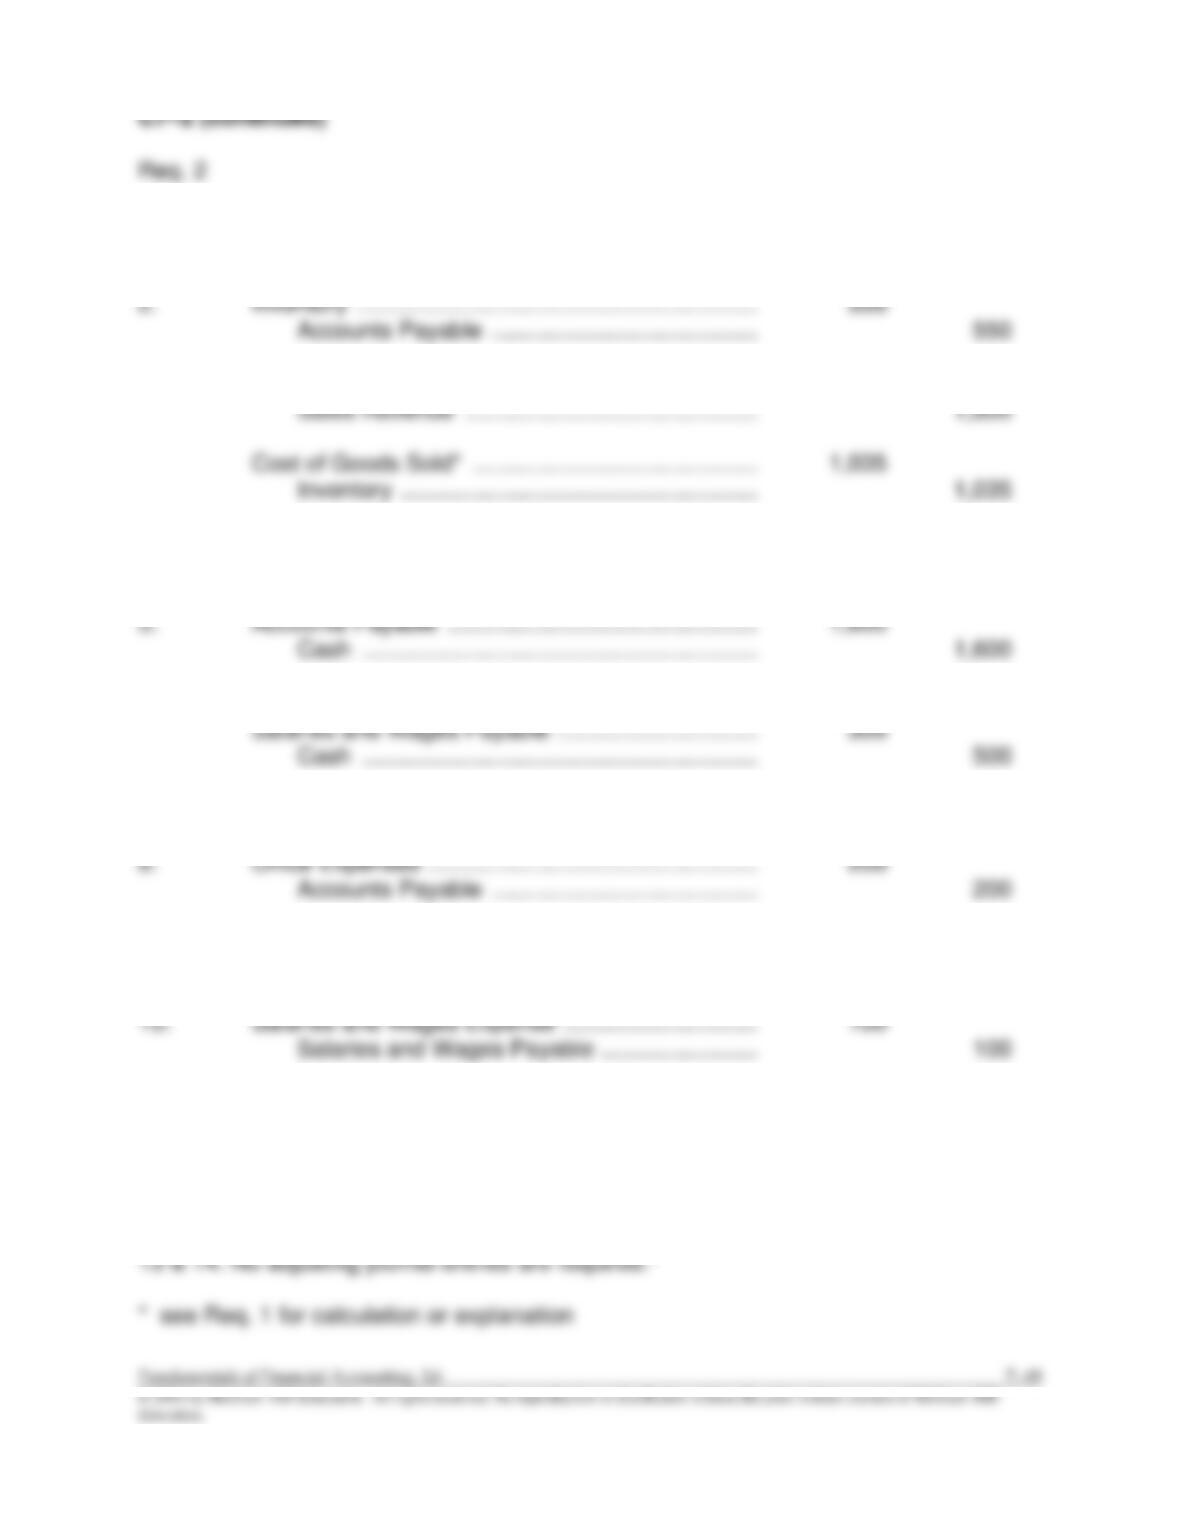
C7–2
Req. 1
Assets
=
Liabilities
+
Stockholders’ Equity
1.
Inventory
+260
Accounts
Payable
+260
2.
Inventory
+550
Accounts
Payable
+550
3.
Accounts
Receivable
Inventory
+1,800
–1,035*
Sales
Revenue
Cost of Goods
Sold *
+1,800
–1,035
4.
Cash
Accounts
Receivable
+1,000
–1,000
5.
Cash
–1,600
Accounts
Payable
–1,600
6.
Cash
–500
Salaries
and
Wages
Payable
–300
Salaries and
Wages
Expense
–200
7.
NE**
NE
NE
8.
Accounts
Payable
+200
Office
Expenses
–200
9.
Acc. Dep.
–10
Depn. Expense
–10
10.
Salaries
and
Wages
Payable
+100
Salaries and
Wages
Expense
–100
11.
Prepaid
Rent
–100
Rent Expense
–100
12.
Inc. Tax
Payable
+789
Income Tax
Expense
–789
13.
NE***
NE
NE
14.
NE****
NE
NE
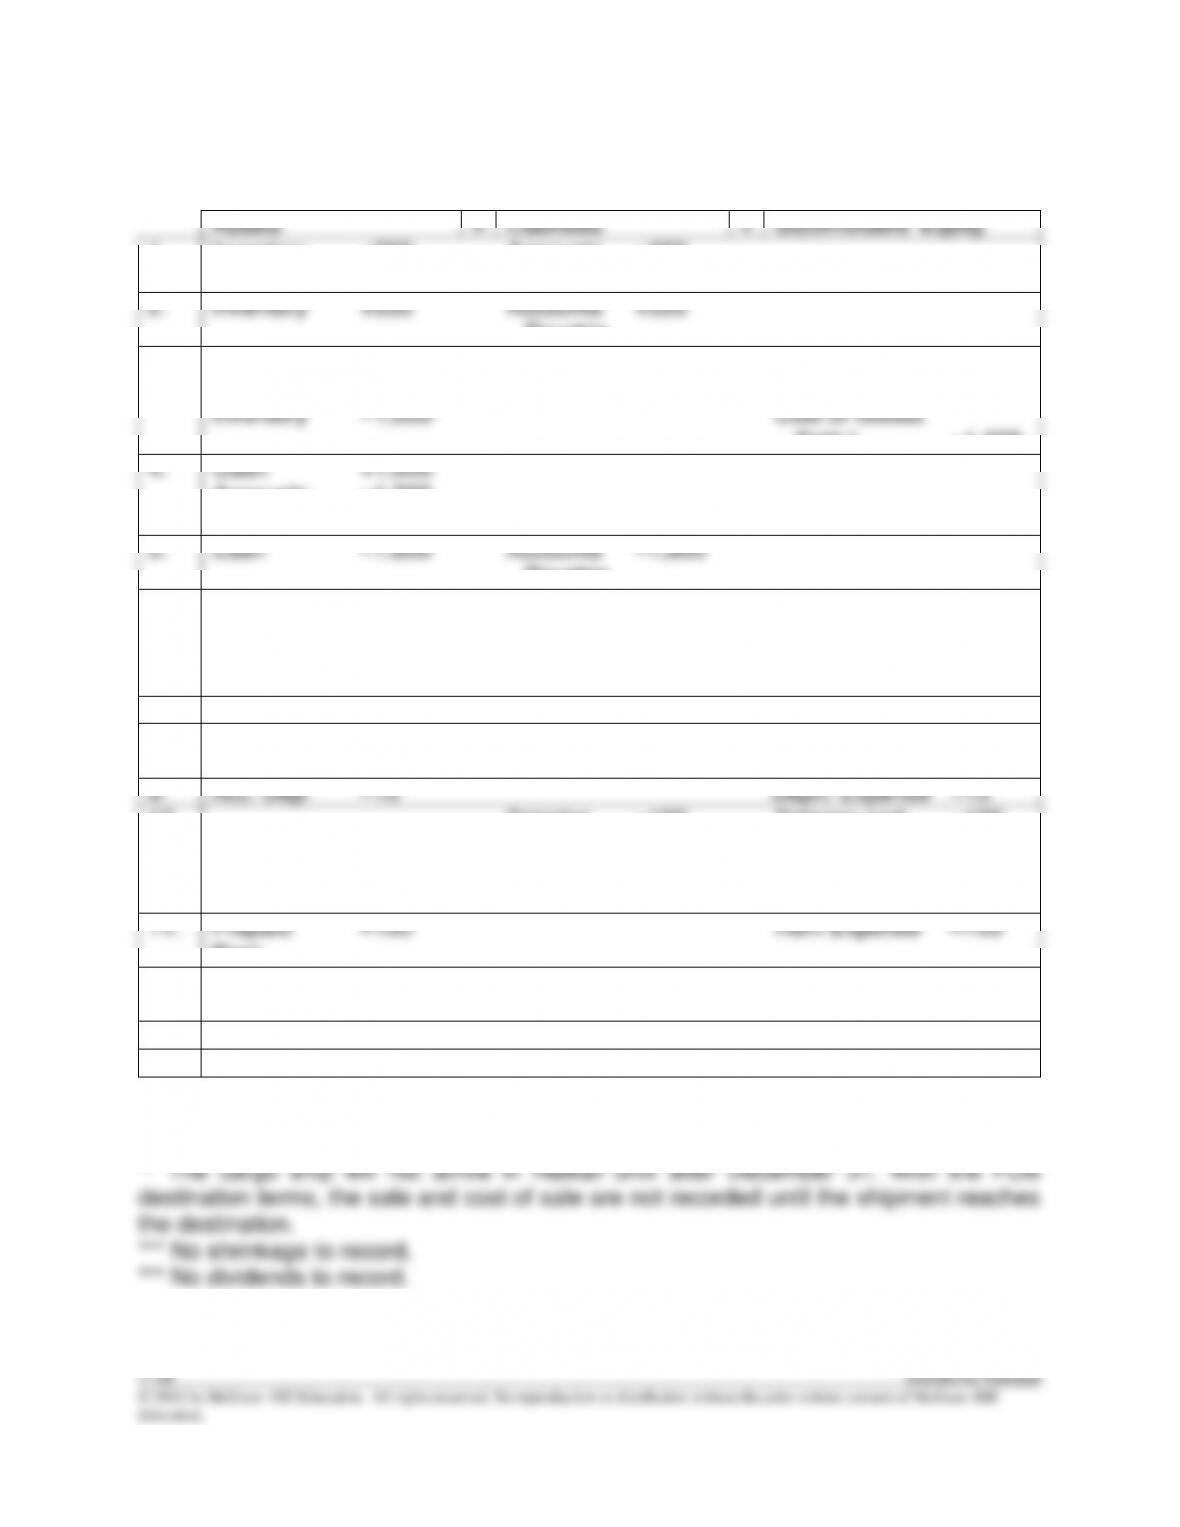
* Cost of goods sold = (1,000 units x $0.50) + (500 units x $0.52) + (500 units x $0.55)
= $1,035
Fundamentals of Financial Accounting, 5/e 7–49
© 2016 by McGraw–Hill Education. All rights reserved. No reproduction or distribution without the prior written consent of McGraw-Hill
Education.
C7–2 (continued)
Req. 2
1.
Inventory ……………………………………………………..
260
Accounts Payable …………………………………..
260
2.
Inventory ……………………………………………………..
550
Accounts Payable …………………………………..
550
3.
Accounts Receivable …………………………………….
1,800
Sales Revenue ………………………………………
1,800
Cost of Goods Sold* ……………………………………..
1,035
Inventory ……………………………………………….
1,035
4.
Cash …………………………………………………………..
1,000
Accounts Receivable ………………………………
1,000
5.
Accounts Payable …………………………………………
1,600
Cash …………………………………………………….
1,600
6.
Salaries and Wages Expense …………………………
200
Salaries and Wages Payable ………………………….
300
Cash …………………………………………………….
500
7.
No journal entry because the goods did not arrive at the destination.*
8.
Office Expenses ……………………………………………
200
Accounts Payable …………………………………..
200
9.
Depreciation Expense …………………………..……….
10
Accumulated Depreciation–Equipment ……….
10
10.
Salaries and Wages Expense …………………………
100
Salaries and Wages Payable ……………………
100
11.
Rent Expense ………………………………………………
100
Prepaid Rent …………………………………………
100
12.
Income Tax Expense …………………………………….
789
Income Taxes Payable …………………………...
789
C7–2 (continued)
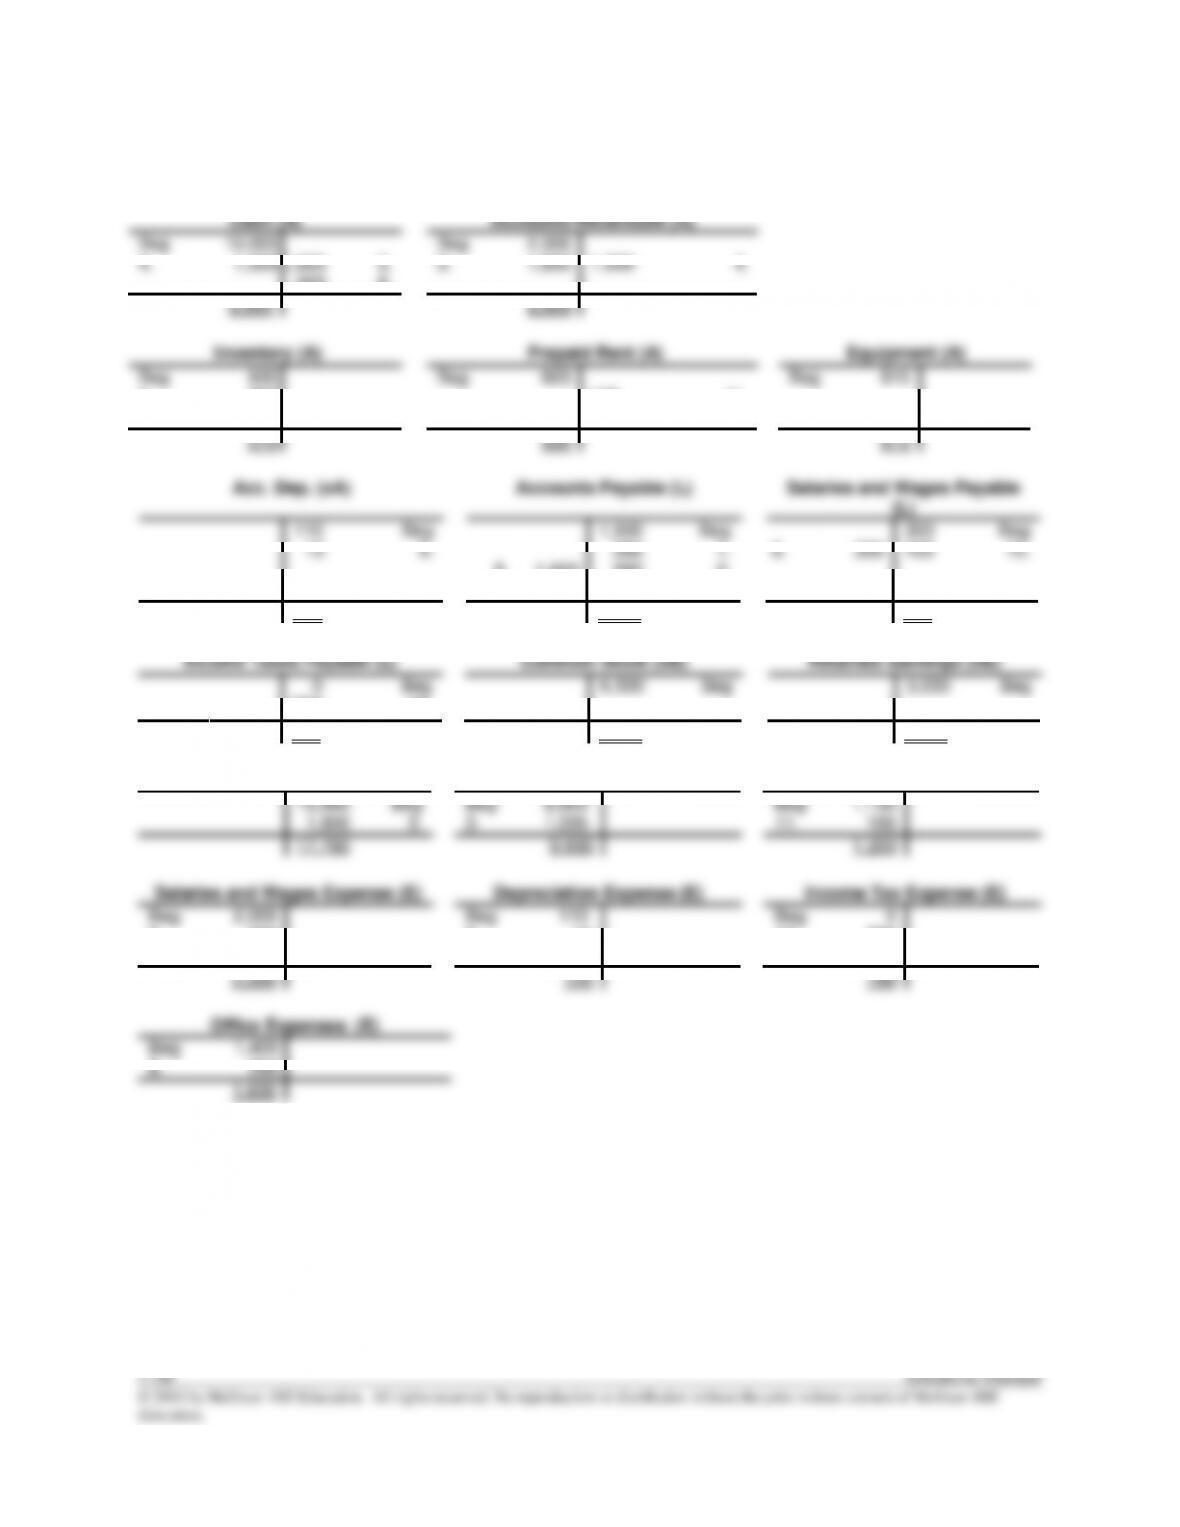
Req. 3
Cash (A)
Accounts Receivable (A)
Beg
4.
10,005
1,000
1,600
500
5.
6.
Beg
3.
2,000
1,800
1,000
4.
8,905
2,800
Inventory (A)
Prepaid Rent (A)
Equipment (A)
Beg
1.
2.
500
260
550
1,035
3.
Beg
600
100
11.
Beg
810
275
500
810
Acc. Dep. (xA)
Accounts Payable (L)
Salaries and Wages Payable
(L)
110
10
Beg
9.
5.
1,600
1,500
260
550
200
Beg
1.
2.
8.
6.
300
300
100
Beg
10.
120
910
100
Income Taxes Payable (L)
Common Stock (SE)
Retained Earnings (SE)
0
789
Beg
12.
6,500
Beg
3,030
Beg
789
6,500
3,030
Sales Revenue (R)
Cost of Goods Sold (E)
Rent Expense (E)–
15,985
1,800
Beg
3.
Beg
3.
8,900
1,035
Beg
11.
1,100
100
17,785
9,935
1,200
Salaries and Wages Expense (E)
Depreciation Expense (E)
Income Tax Expense (E)
Beg
6.
10,
2,000
200
100
Beg
9.
110
10
Beg
12.
0
789
2,300
120
789
Beg
1,600