ANSWERS TO COACHED PROBLEMS
CP7–1
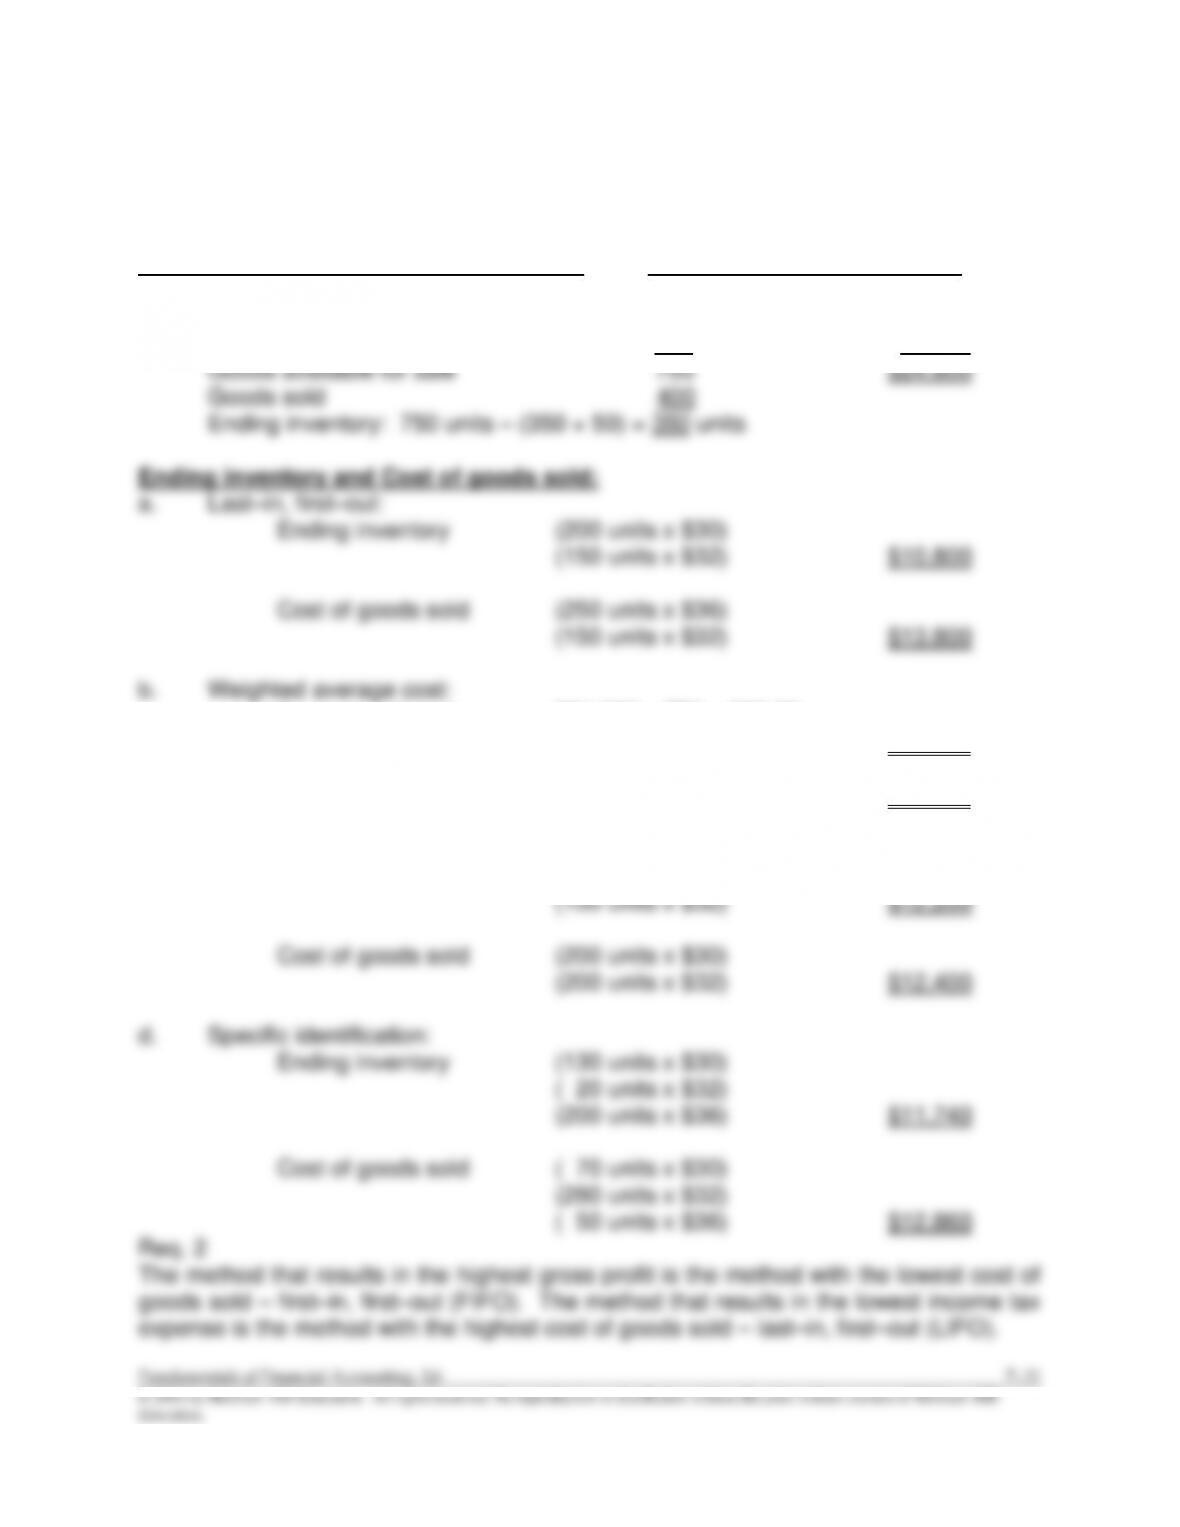
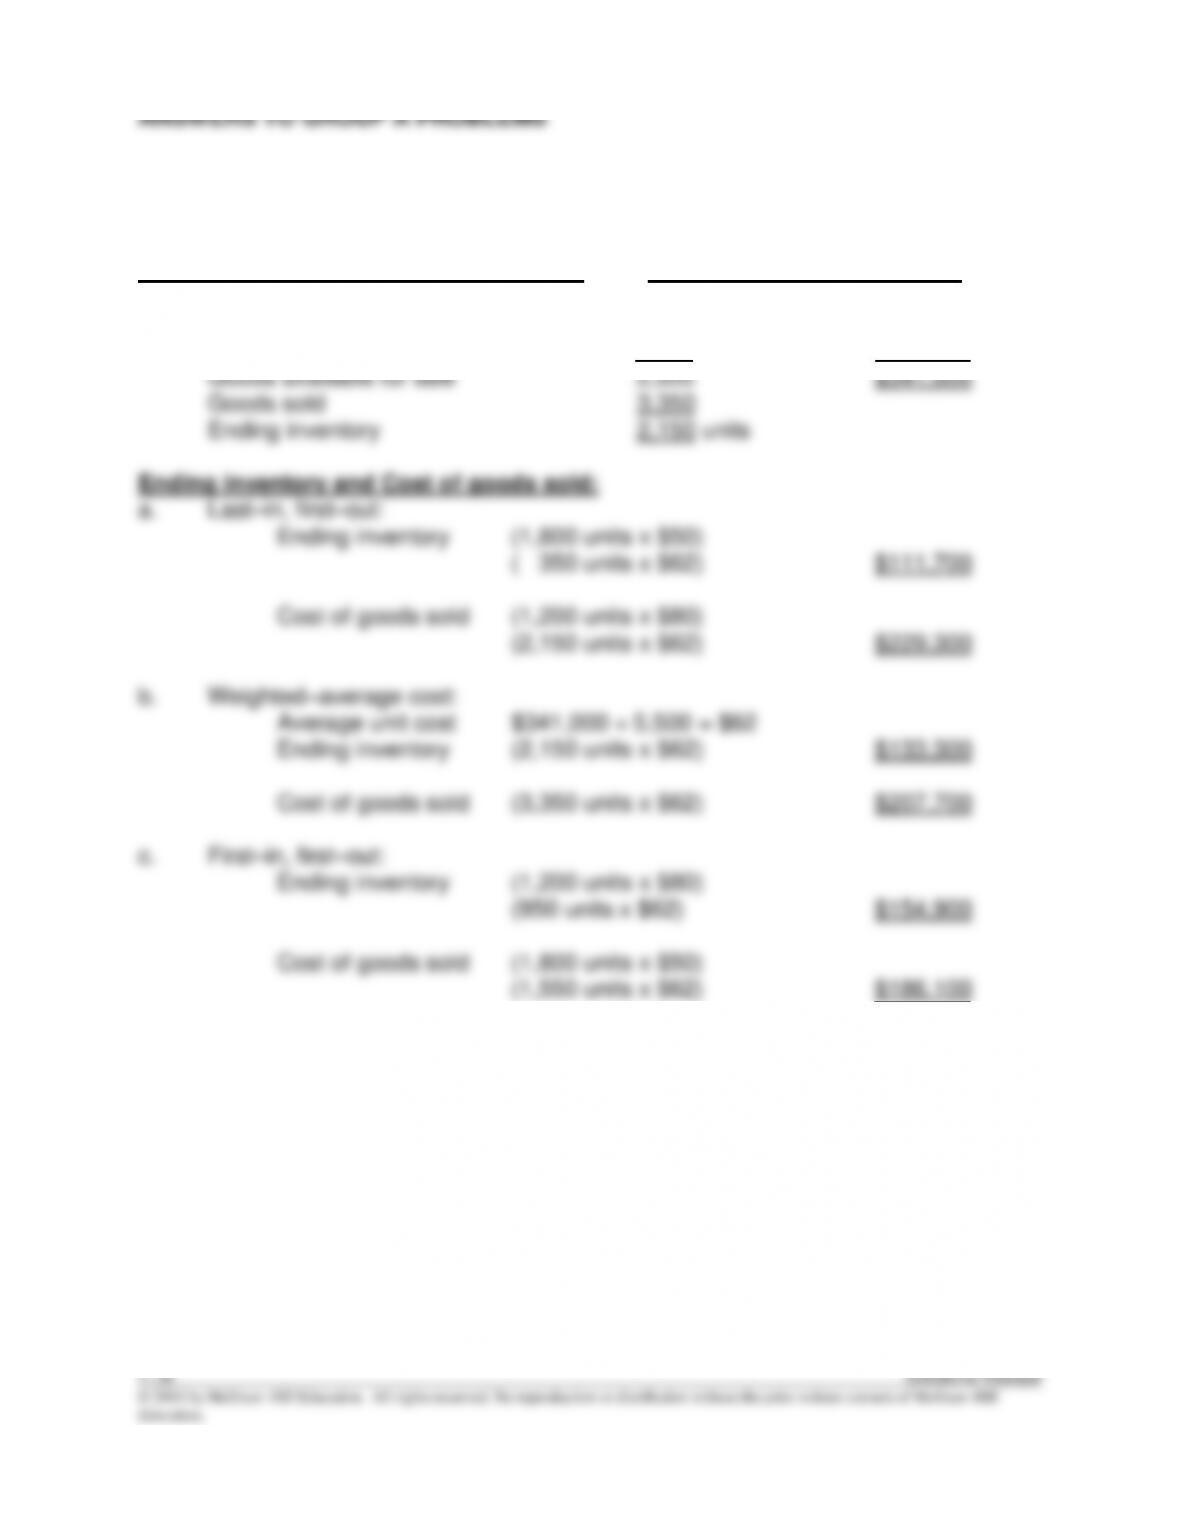
Req. 1 Unit Total
Goods available for sale for all methods: Units Cost Cost
Beginning inventory, January 1 200 $30 $6,000
Purchase, March 2 300 32 9,600
Purchase, June 30 250 36 9,000
Average unit cost $24,600 ÷ 750 = $32.80
Ending inventory (350 units x $32.80) $11,480
Cost of goods sold (400 units x $32.80) $13,120
c. First–in, first–out:
Ending inventory (250 units x $36)
CP7–2
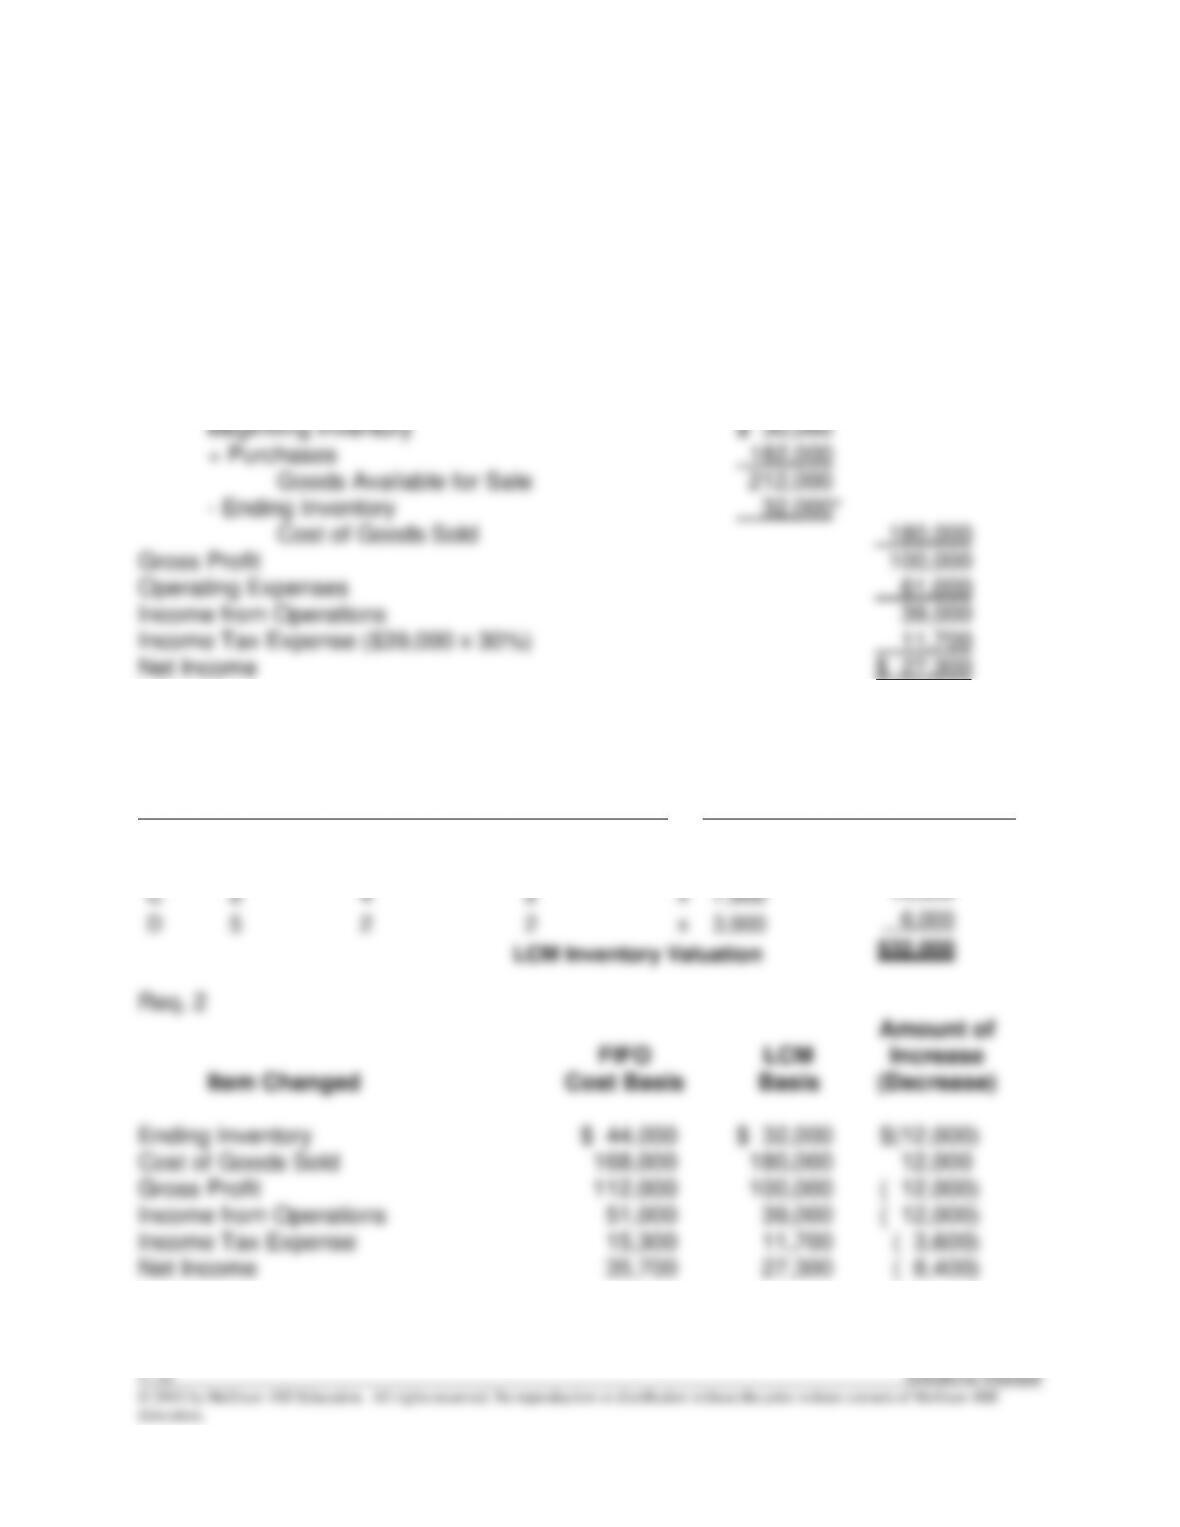
Req. 1
SMART COMPANY
Income Statement (LCM basis)
For the Year Ended December 31
Sales Revenue $280,000
Cost of Goods Sold:
*Computation of ending inventory on LCM basis:
Original
Replacement
Item
Unit Cost
Cost (Market)
LCM per Unit
Quantity
LCM Valuation
A
$3
$4
$3
x
3,000
$ 9,000
B
4
2
2
x
1,500
3,000
C
2
4
2
x
7,000
14,000
D
5
2
2
x
3,000
6,000
LCM Inventory Valuation
$32,000
Req. 2
Amount of
FIFO LCM Increase
Item Changed Cost Basis Basis (Decrease)
Ending Inventory $ 44,000 $ 32,000 $(12,000)
Cost of Goods Sold 168,000 180,000 12,000
Gross Profit 112,000 100,000 ( 12,000)
Income from Operations 51,000 39,000 ( 12,000)
Income Tax Expense 15,300 11,700 ( 3,600)
Net Income 35,700 27,300 ( 8,400)
CP7–2 (continued)
Analysis
Ending inventory, cost of goods sold, gross profit, and operating income each
CP7–3
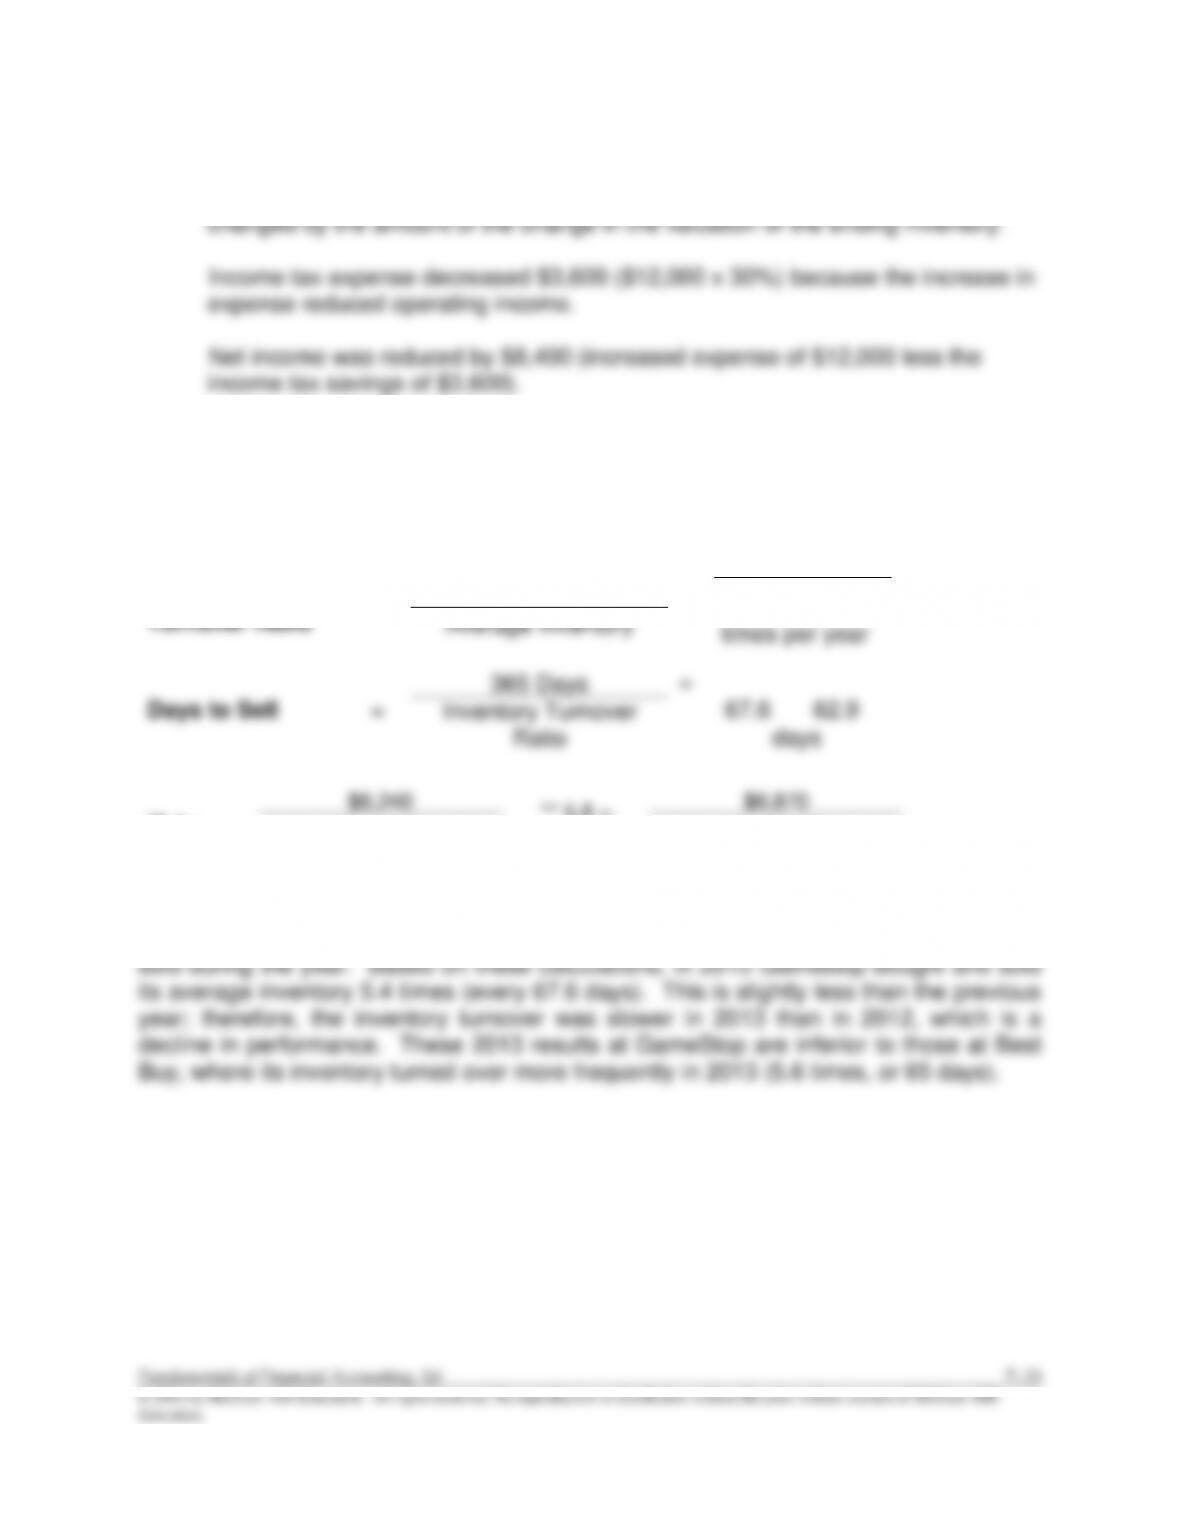
Req. 1
2013
2012
Inventory
Turnover Ratio
=
Cost of Goods Sold
=
5.4*
5.8**
Average Inventory
Days to Sell
=
365 Days
=
67.6
62.9
Inventory Turnover
Ratio
*5.4 =
$6,240
** 5.8 =
$6,870
($1,200+ $1,100) ÷ 2
($1,100+ $1,250) ÷ 2
Req. 2
The inventory turnover ratio reflects how many times average inventory was bought and
times per year
days
CP7–4
LIFO Perpetual
Remaining
Units
Unit Cost
Total Cost
Inventory Value
Beginning Inventory
200
$30
$6,000
$6,000
a)
Purchase March 2
300
32
9,600
15,600
b)
Sale April 1
(300)
32
(9,600)
(50)
30
(1,500)
4,500
c)
Purchase June 30
250
36
9,000
13,500
d)
Sale August 1
(50)
36
(1,800)
11,700
Ending Inventory
=
$11,700
[(150 x $30) + (200 x $36)]
Cost of Goods Sold
=
$12,900
[(300 x $32) + (50 x $30) + (50 x $36)]
CP7–5
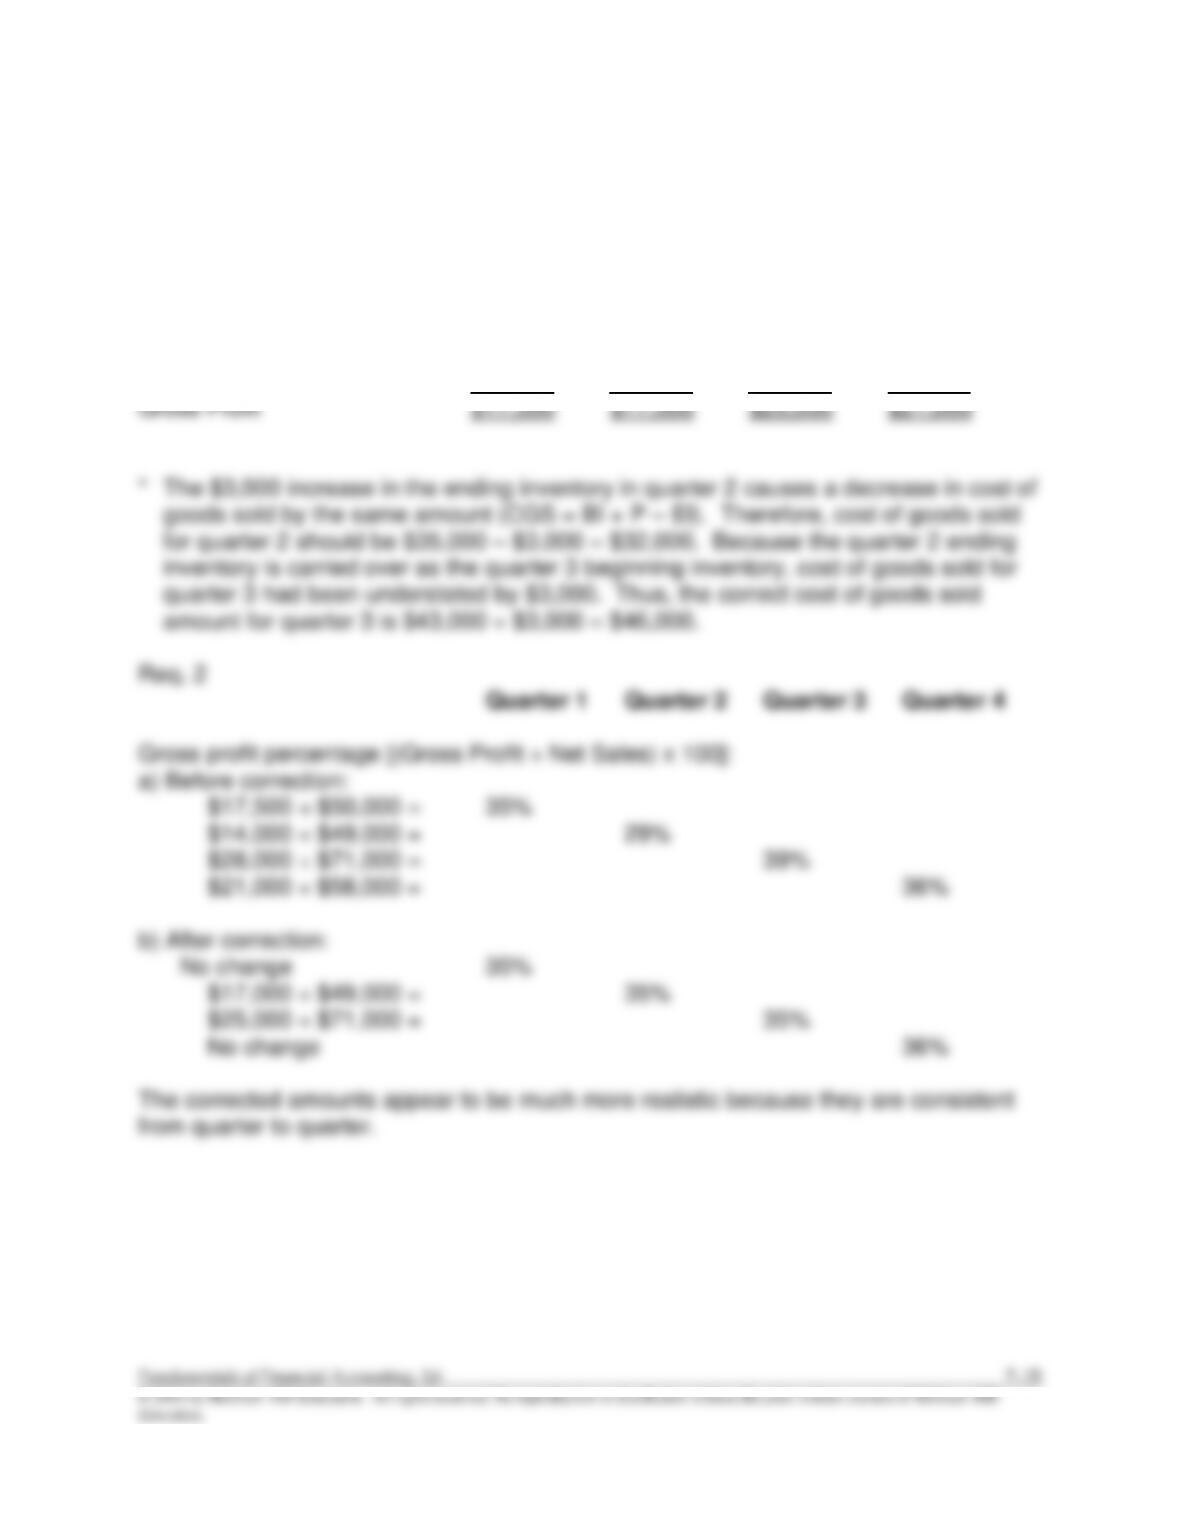
Req. 1
Murphy & Murphy Company
Income Statements (Corrected)
Quarter 1 Quarter 2 Quarter 3 Quarter 4
Net Sales $50,000 $49,000 $71,000 $58,000
Cost of Goods Sold 32,500 32,000* 46,000* 37,000
7–36 Solutions Manual
© 2016 by McGraw–Hill Education. All rights reserved. No reproduction or distribution without the prior written consent of McGraw-Hill
Education.
ANSWERS TO GROUP A PROBLEMS
PA7–1
Req. 1
Unit Total
Goods available for sale for all methods: Units Cost Cost
Beginning inventory, January 1 1,800 $50 $ 90,000
Purchase, January 30 2,500 62 155,000
Purchase, May 1 1,200 80 96,000
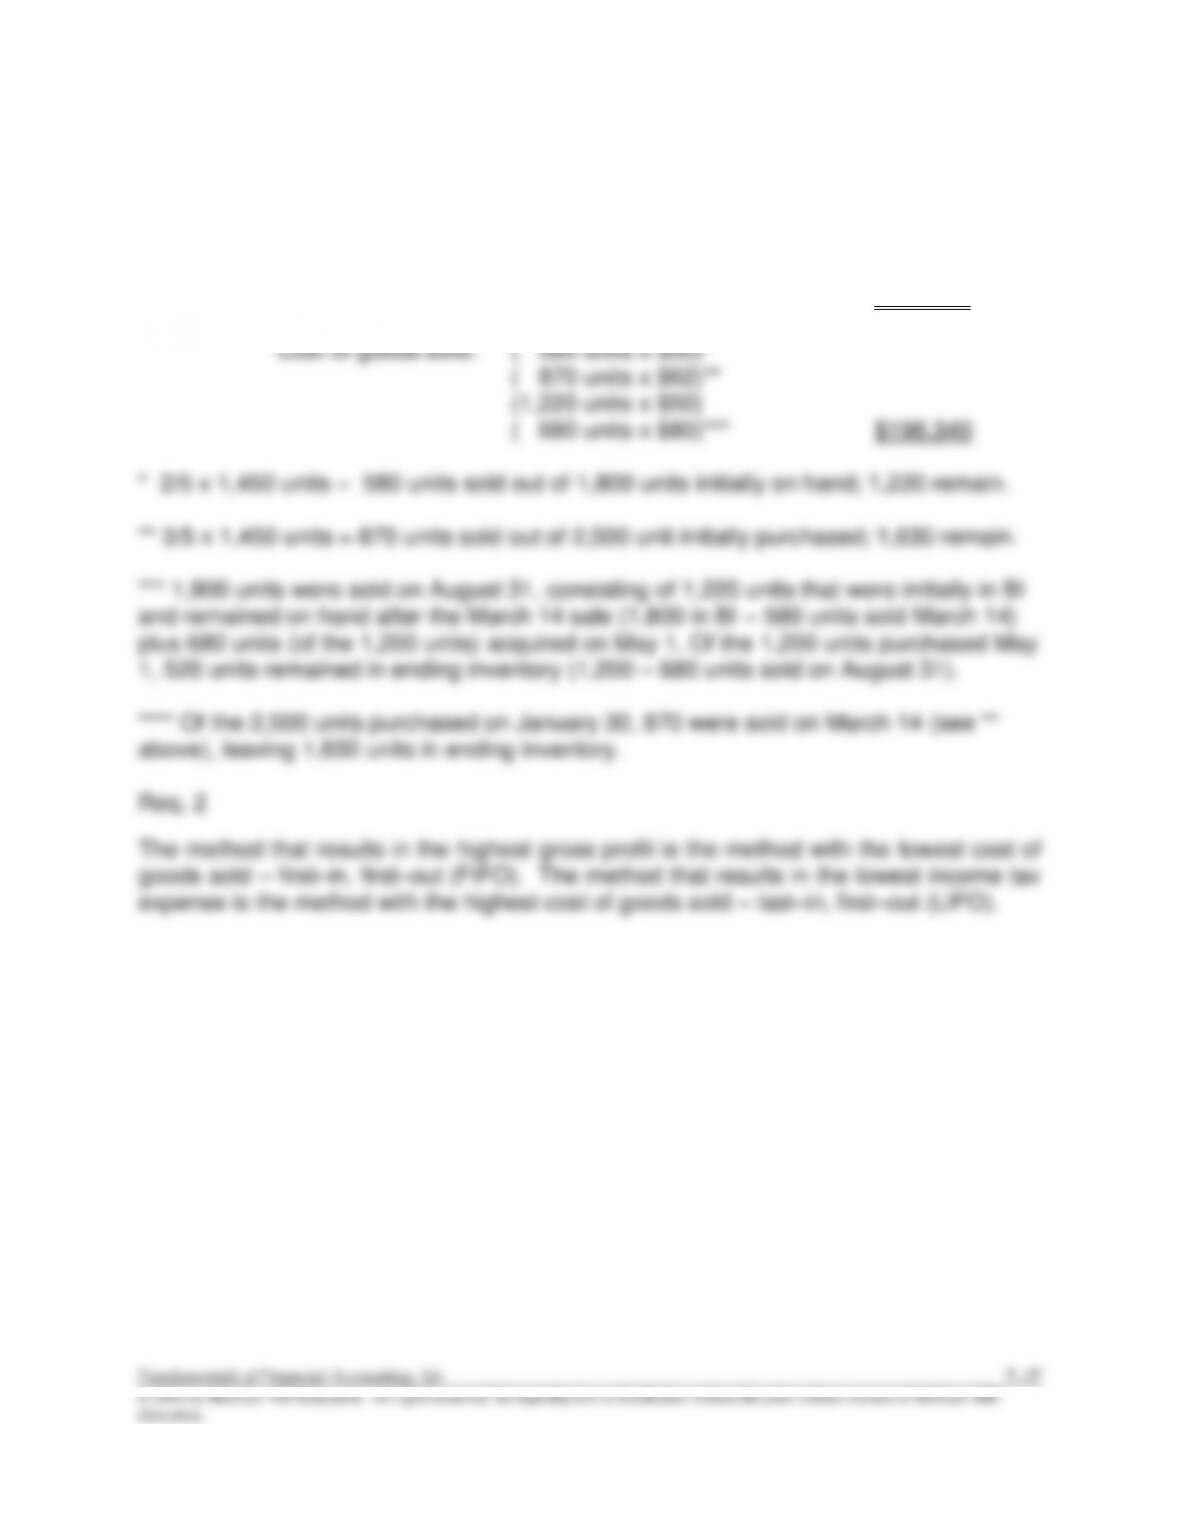
PA7–1 (continued)
Req. 1 (continued)
d. Specific identification:
Ending inventory ( 520 units x $80)***
(1,630 units x $62)**** $142,660
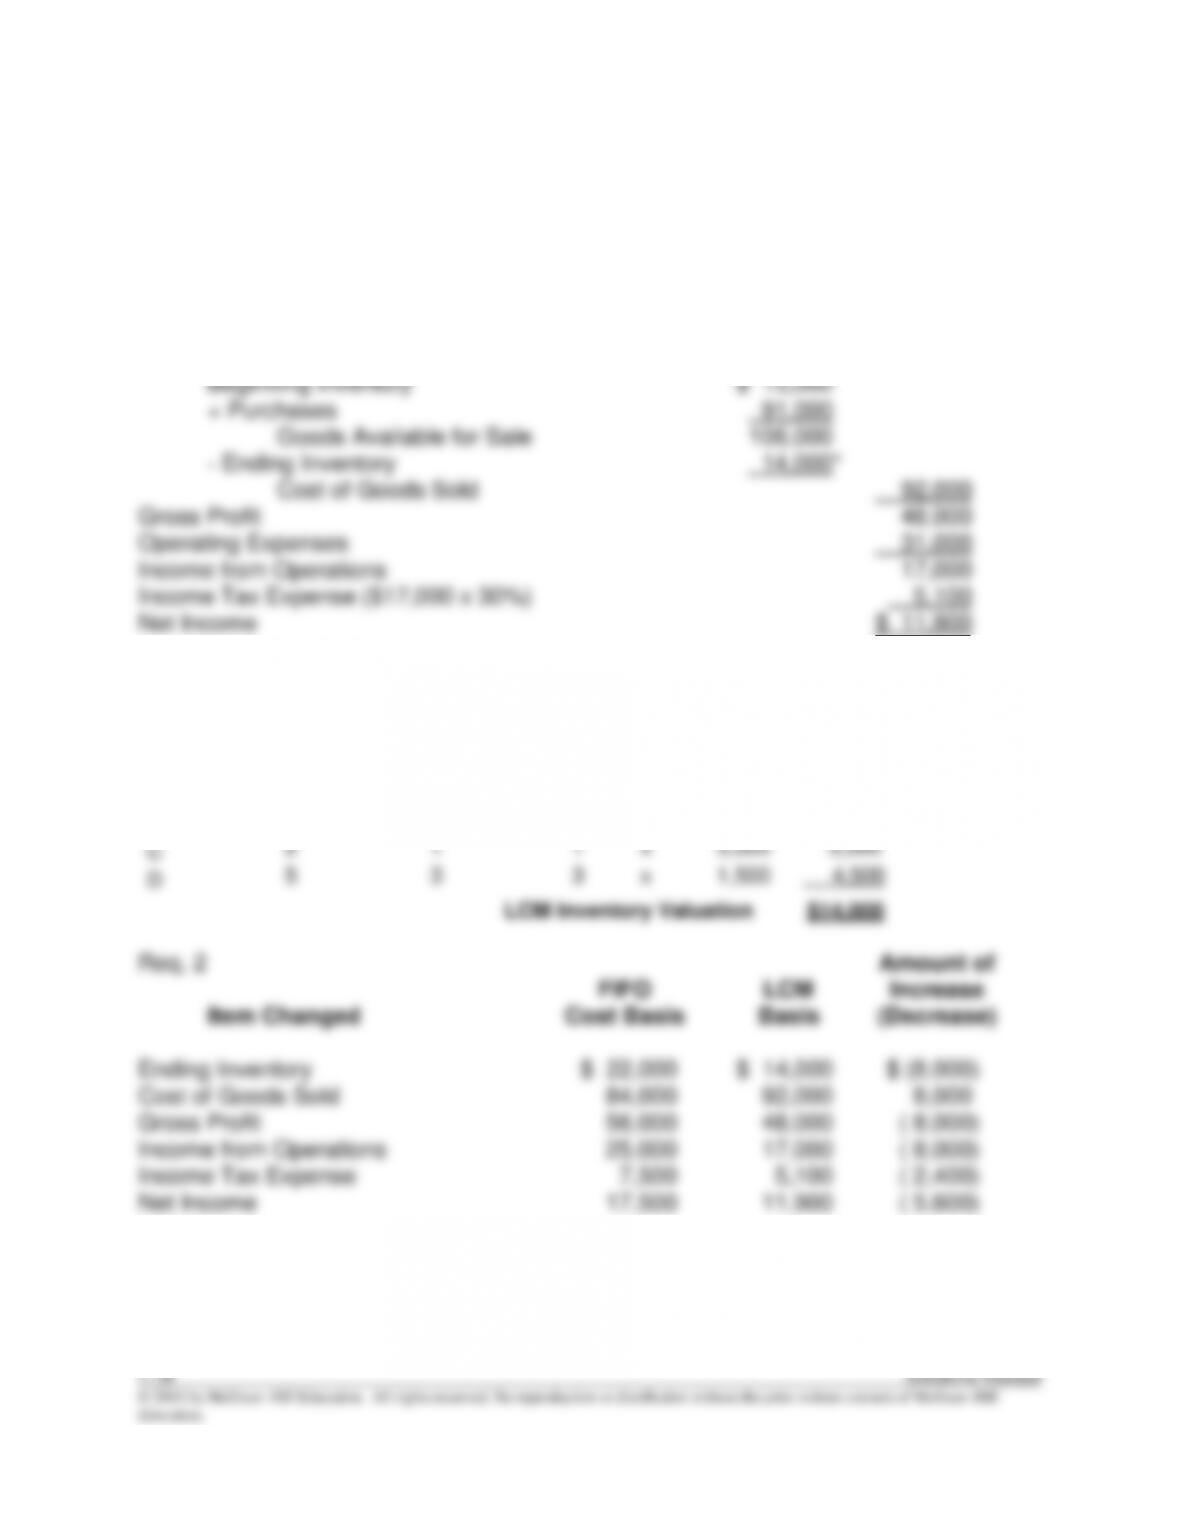
PA7–2
Req. 1
SPRINGER ANDERSON GYMNASTICS
Income Statement (LCM basis)
For the Year Ended December 31
Sales Revenue $140,000
Cost of Goods Sold:
*Computation of ending inventory on LCM basis:
Original
Replacement
LCM
Item
Unit Cost
Cost (Market)
per Unit
Quantity
LCM Valuation
A
$3
$4
$3
x
1,500
$4,500
B
4
2
2
x
750
1,500
C
2
1
1
x
3,500
3,500
D
5
3
3
x
1,500
4,500
LCM Inventory Valuation
$14,000
Req. 2 Amount of
FIFO LCM Increase
Item Changed Cost Basis Basis (Decrease)
Ending Inventory $ 22,000 $ 14,000 $ (8,000)
Cost of Goods Sold 84,000 92,000 8,000
Gross Profit 56,000 48,000 ( 8,000)
Income from Operations 25,000 17,000 ( 8,000)
Income Tax Expense 7,500 5,100 ( 2,400)
Net Income 17,500 11,900 ( 5,600)
PA7–2 (continued)
Analysis
Ending inventory, cost of goods sold, gross profit, and operating income each
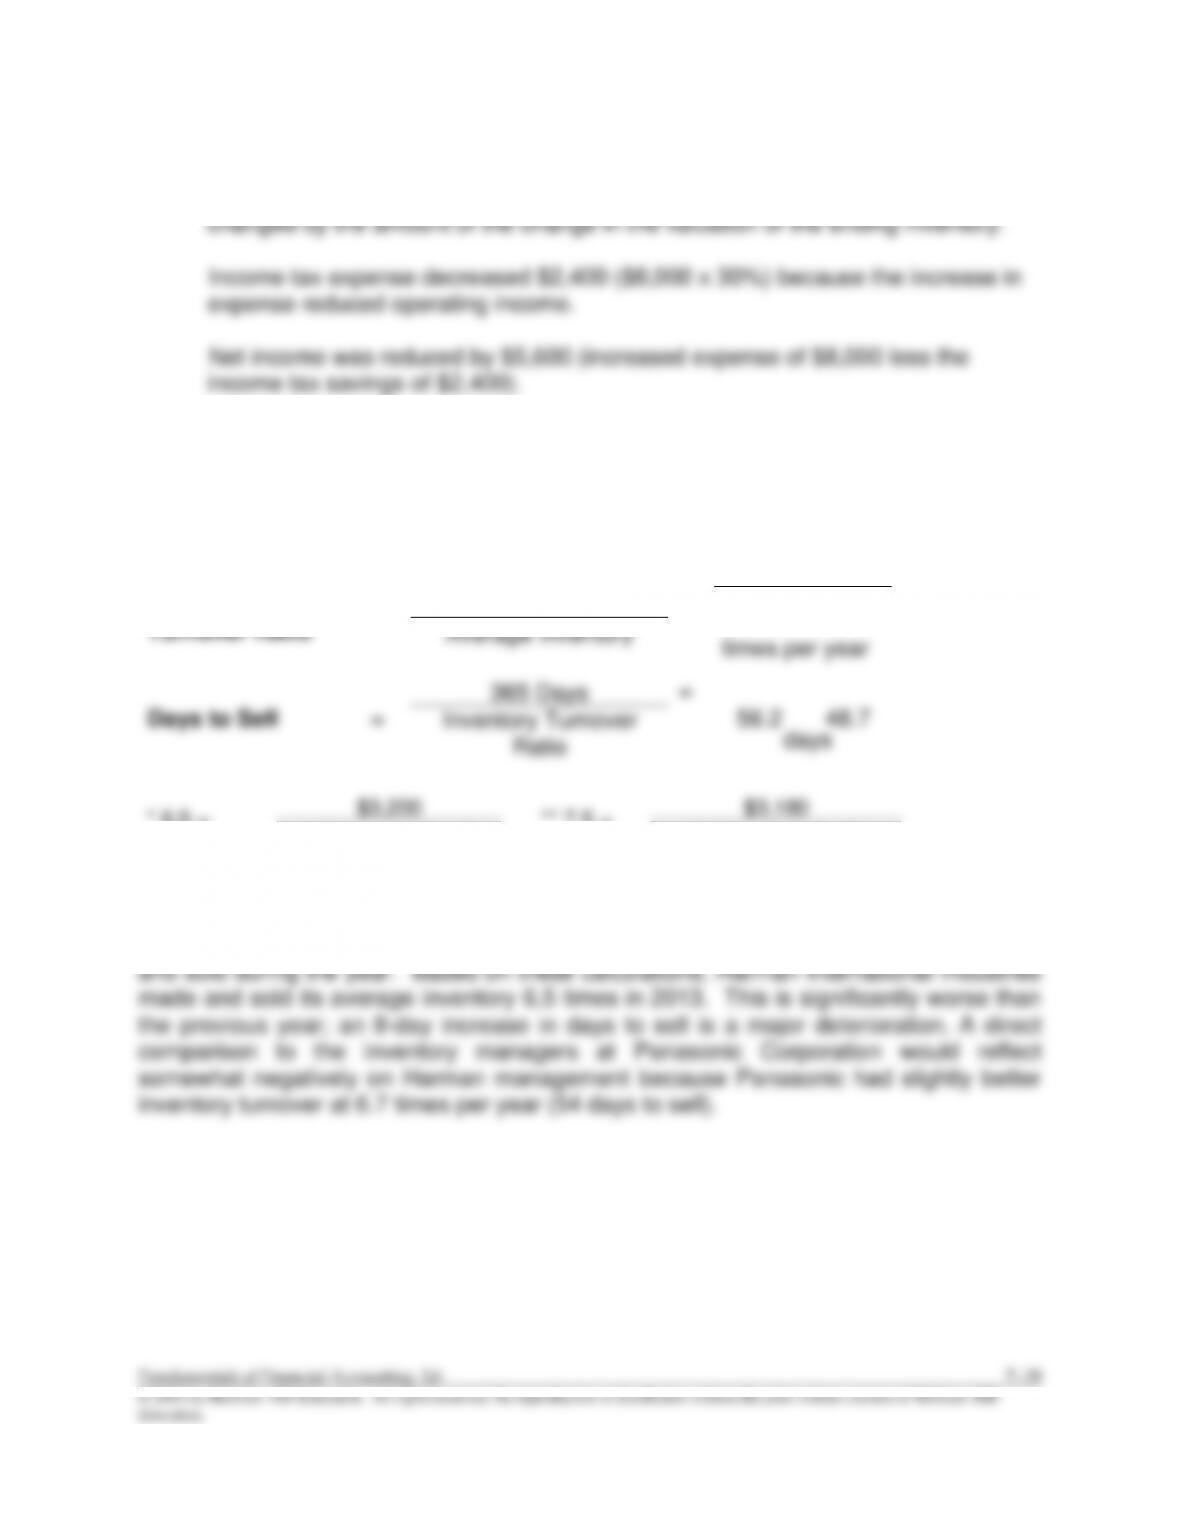
PA7–3
Req. 1
2013
2012
Inventory
Turnover Ratio
=
Cost of Goods Sold
=
6.5*
7.5**
Average Inventory
Days to Sell
=
365 Days
=
56.2
48.7
Inventory Turnover
Ratio
* 6.5 =
$3,200
** 7.5 =
$3,180
($430 + $550) ÷ 2
($420 + $430) ÷ 2
Req. 2
The inventory turnover ratio reflects how many times average inventory was acquired
times per year
days
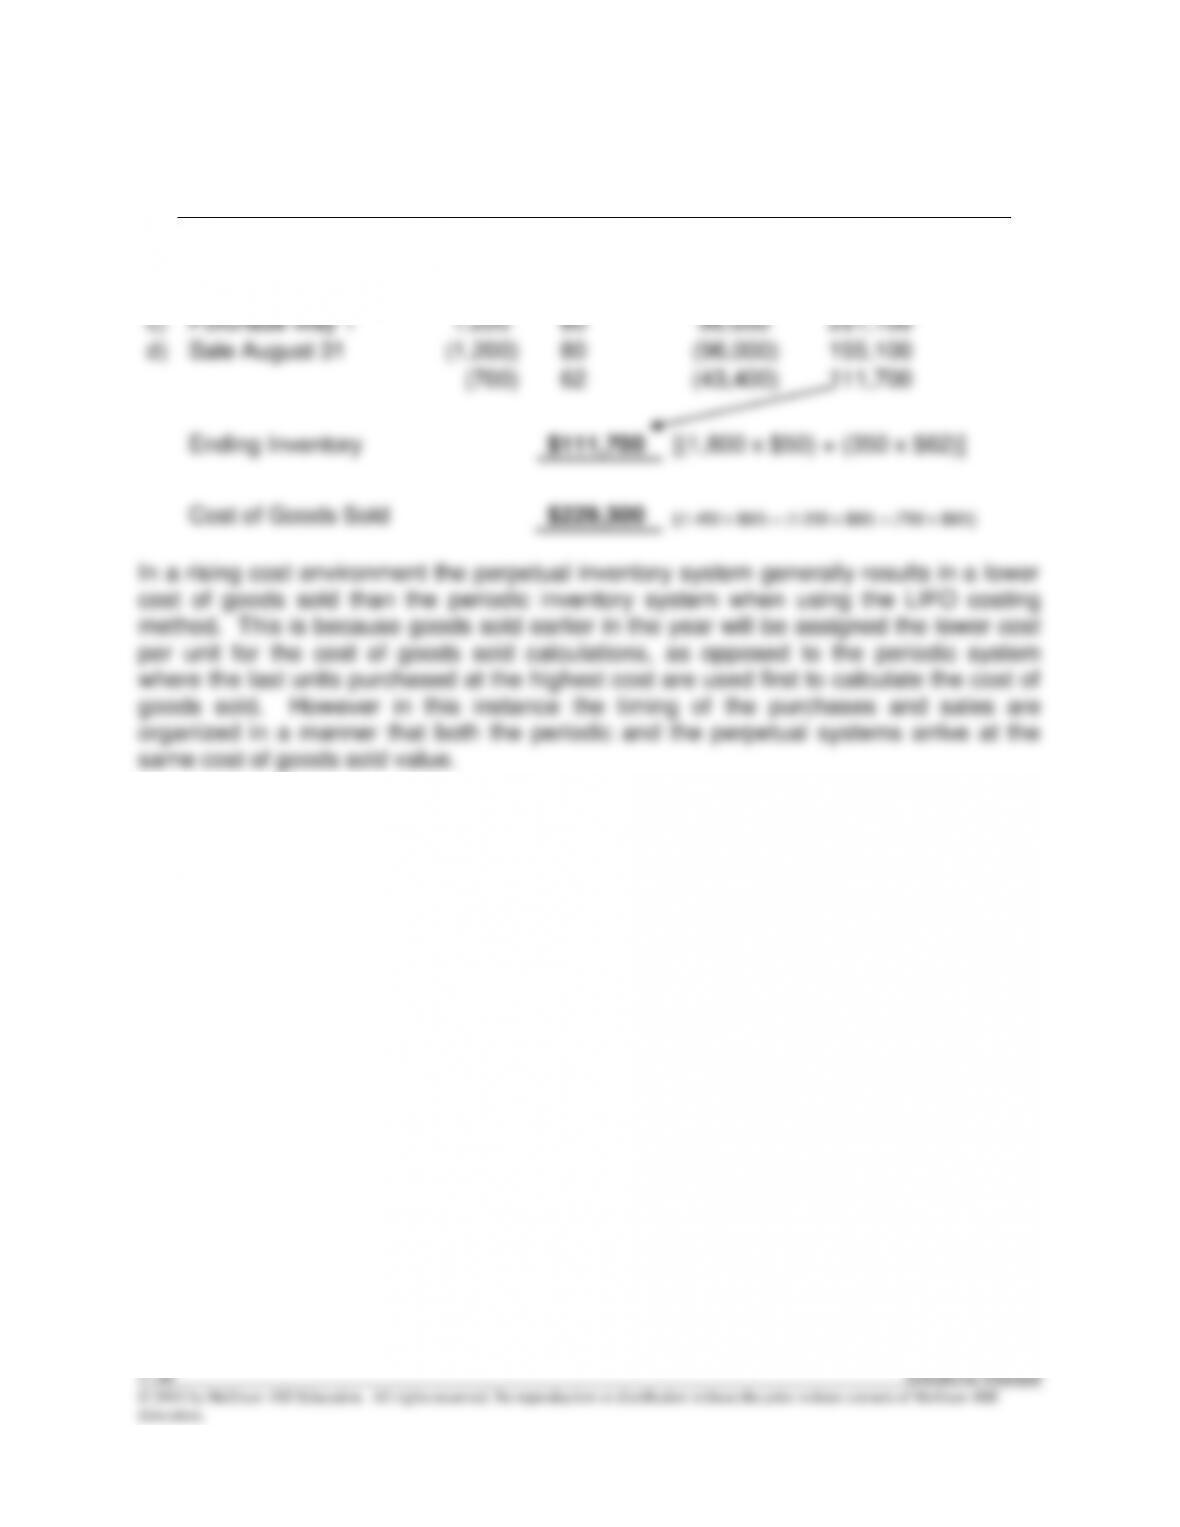
PA7–4
Remaining
Perpetual LIFO
Units
Unit Cost
Total Cost
Inventory Value
Beginning Inventory
1,800
$50
$ 90,000
$ 90,000
a)
Purchase January 30
2,500
62
155,000
245,000
b)
Sale March 14
(1,450)
62
(89,900)
155,100
c)
Purchase May 1
1,200
80
96,000
251,100
d)
Sale August 31
(1,200)
80
(96,000)
155,100
(700)
62
(43,400)
111,700
Ending Inventory
$111,700
[(1,800 x $50) + (350 x $62)]
Cost of Goods Sold
$229,300
[(1,450 x $62) + (1,200 x $80) + (700 x $62)]
In a rising cost environment the perpetual inventory system generally results in a lower
cost of goods sold than the periodic inventory system when using the LIFO costing
method. This is because goods sold earlier in the year will be assigned the lower cost
per unit for the cost of goods sold calculations, as opposed to the periodic system
where the last units purchased at the highest cost are used first to calculate the cost of
goods sold. However in this instance the timing of the purchases and sales are
organized in a manner that both the periodic and the perpetual systems arrive at the
same cost of goods sold value.