E7–8
Req. 1
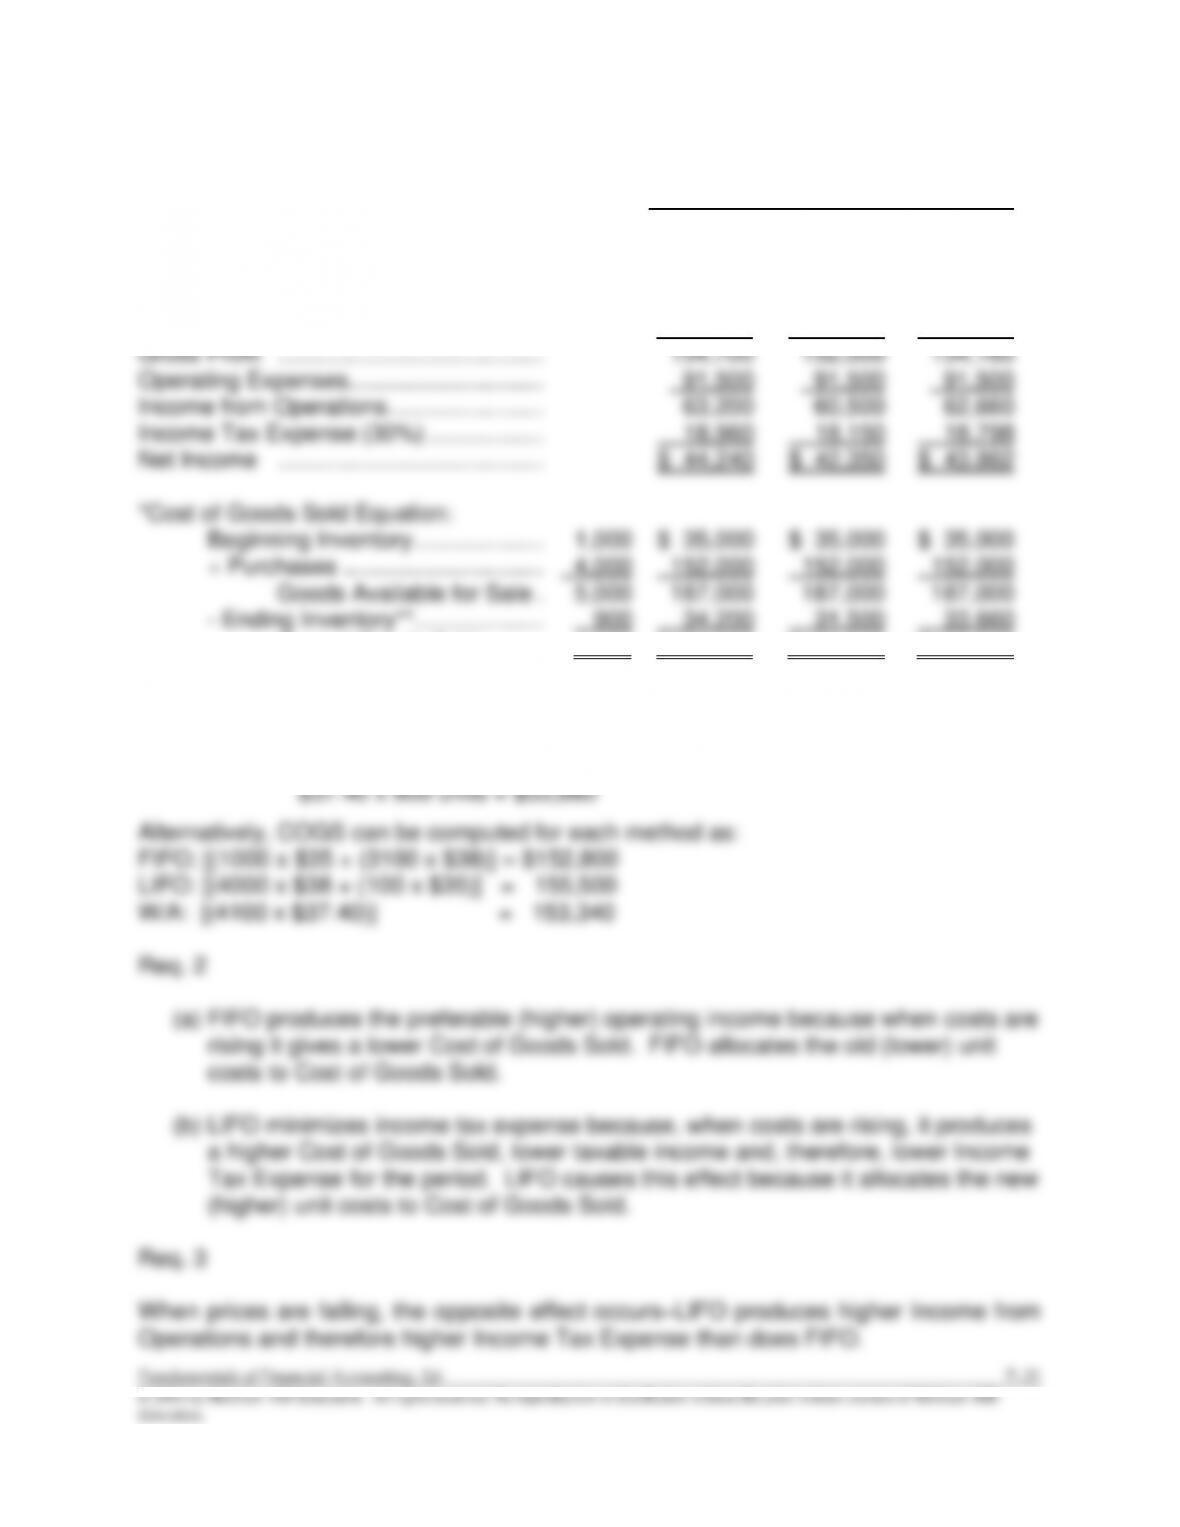
Inventory Costing Method
Weighted
Income Statement Units FIFO LIFO Average
Sales Revenue ……………………………….. 4,100 $307,500 $307,500 $307,500
Cost of Goods Sold* ………………………… 4,100 152,800 155,500 153,340
Cost of Goods Sold ………. 4,100 $152,800 $155,500 $153,340
**Inventory computations:
FIFO: 900 units @ $38 = $34,200
LIFO: 900 units @ $35 = $31,500
Average: [(1,000 units @ $35) + (4,000 units @ $38)] ÷ 5,000 units = $37.40
E7–9
Req. 1
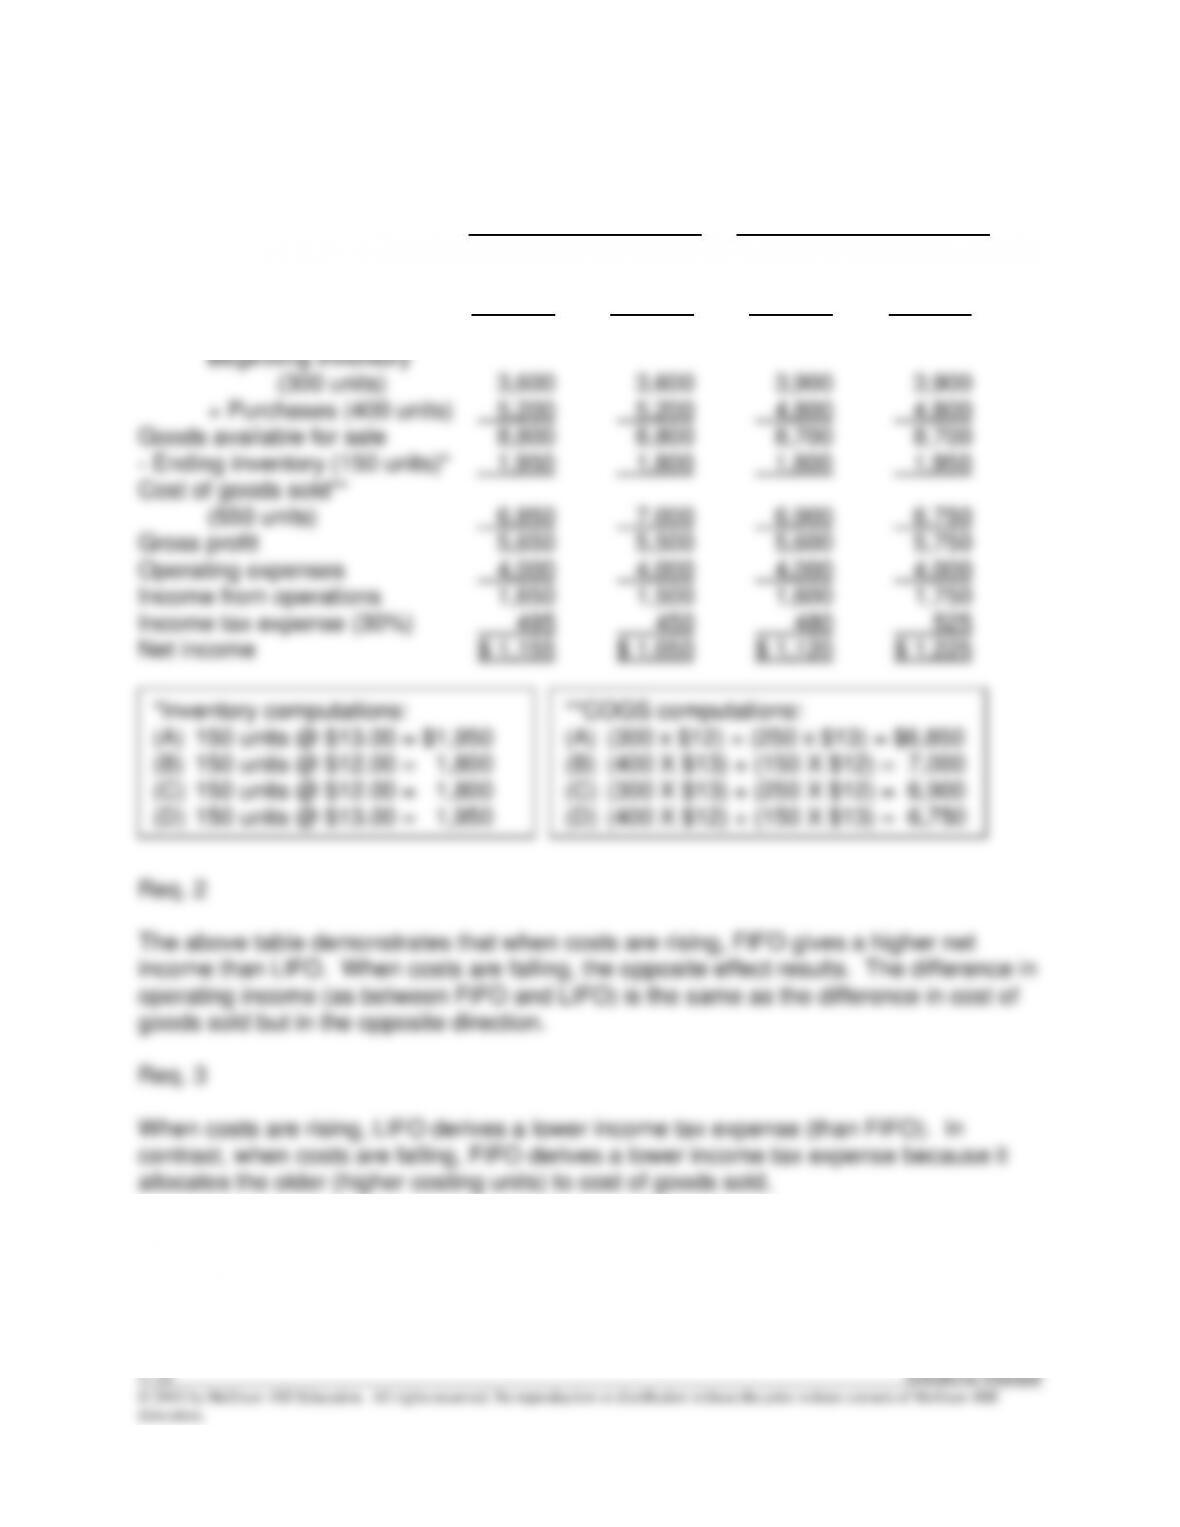
Costs Rising Costs Falling
FIFO LIFO FIFO LIFO
(A) (B) (C) (D)
Sales revenue (550 units) $12,500 $12,500 $12,500 $12,500
Cost of goods sold:
E7–10
Req. 1
Item
Quantity
Total Cost
Total Market
LCM
Per Item
LCM
Valuation
Alligator
50
x
$30
=
$1,500
x
$24
=
$1,200
$ 24
$1,200
Bear
75
x
40
=
3,000
x
40
=
3,000
40
3,000
Cougar
10
x
50
=
500
x
52
=
520
50
500
Dingo
30
x
30
=
900
x
30
=
900
30
900
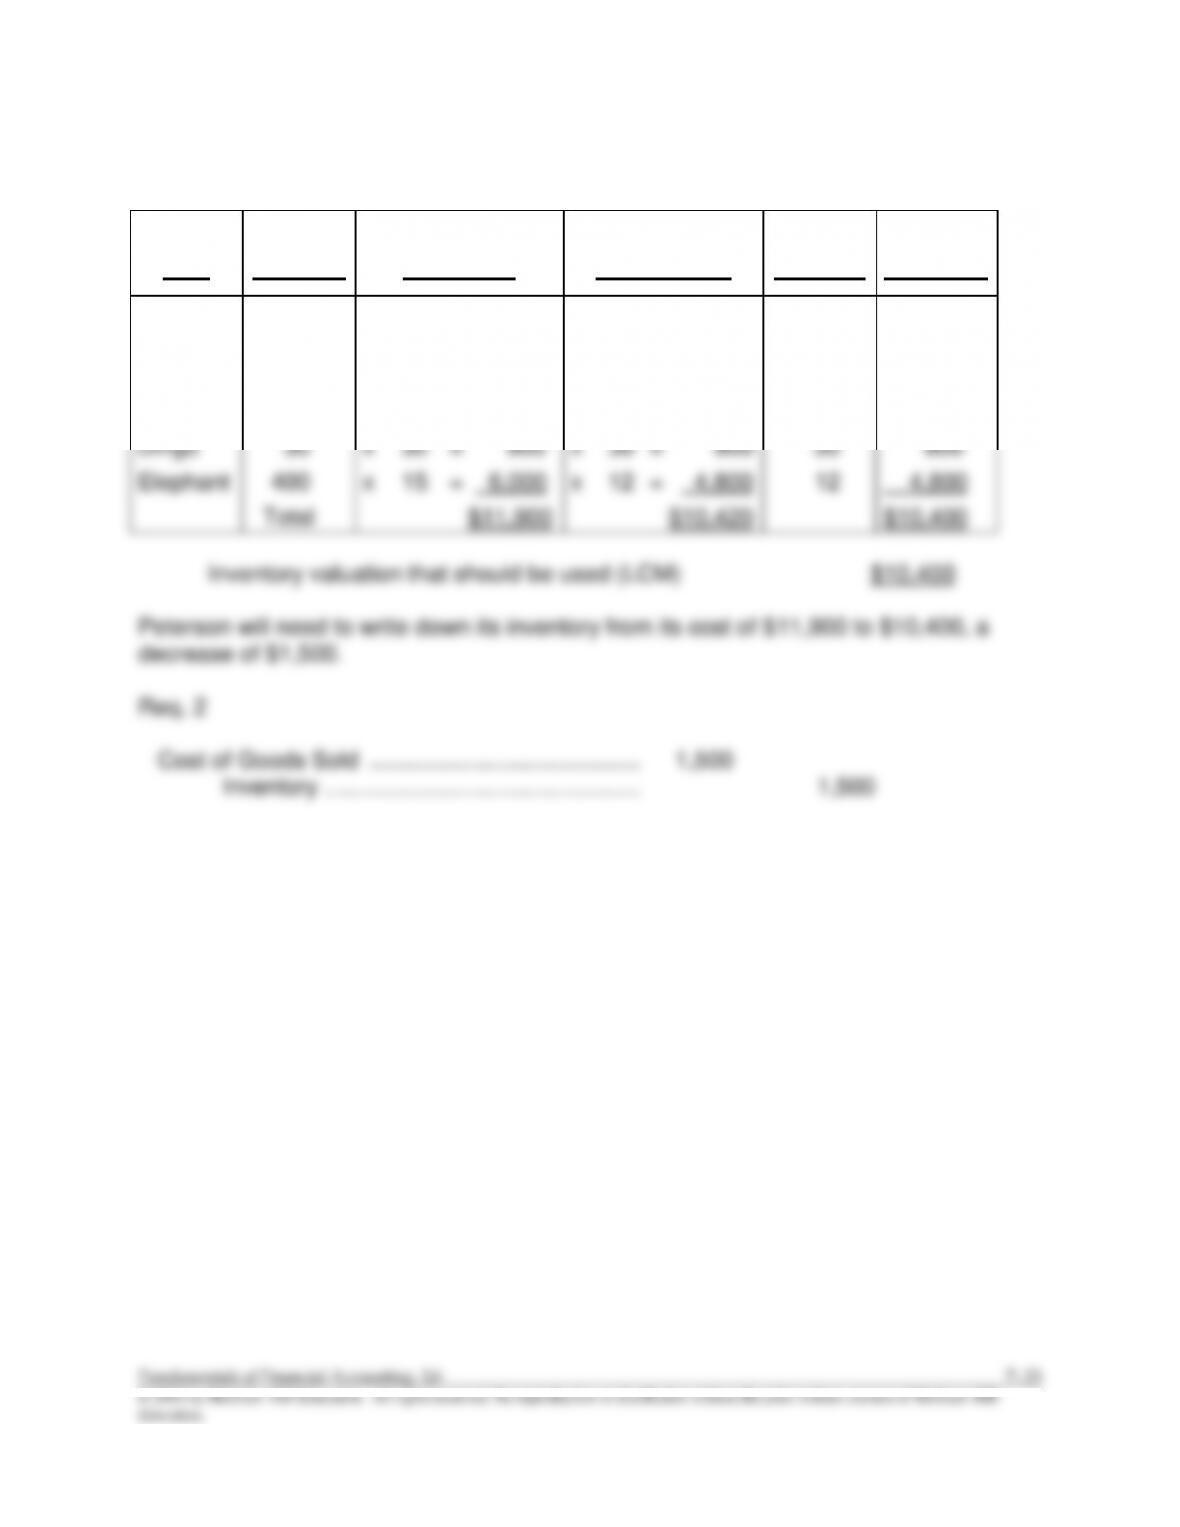
Elephant
400
x
15
=
6,000
x
12
=
4,800
12
4,800
Total
$11,900
$10,420
$10,400
Inventory valuation that should be used (LCM) $10,400
Peterson will need to write down its inventory from its cost of $11,900 to $10,400, a
decrease of $1,500.
Req. 2
Cost of Goods Sold ……………………………………
1,500
Inventory ………………………………………….
1,500
E7–11
Req. 1
Item
Quantity
Total Cost
Total Market
LCM
Valuation
Air Flow
20
x
$12
=
$ 240
x
$14
=
$ 280
$ 240
B Buster
75
x
40
=
3,000
x
38
=
2,850
2,850
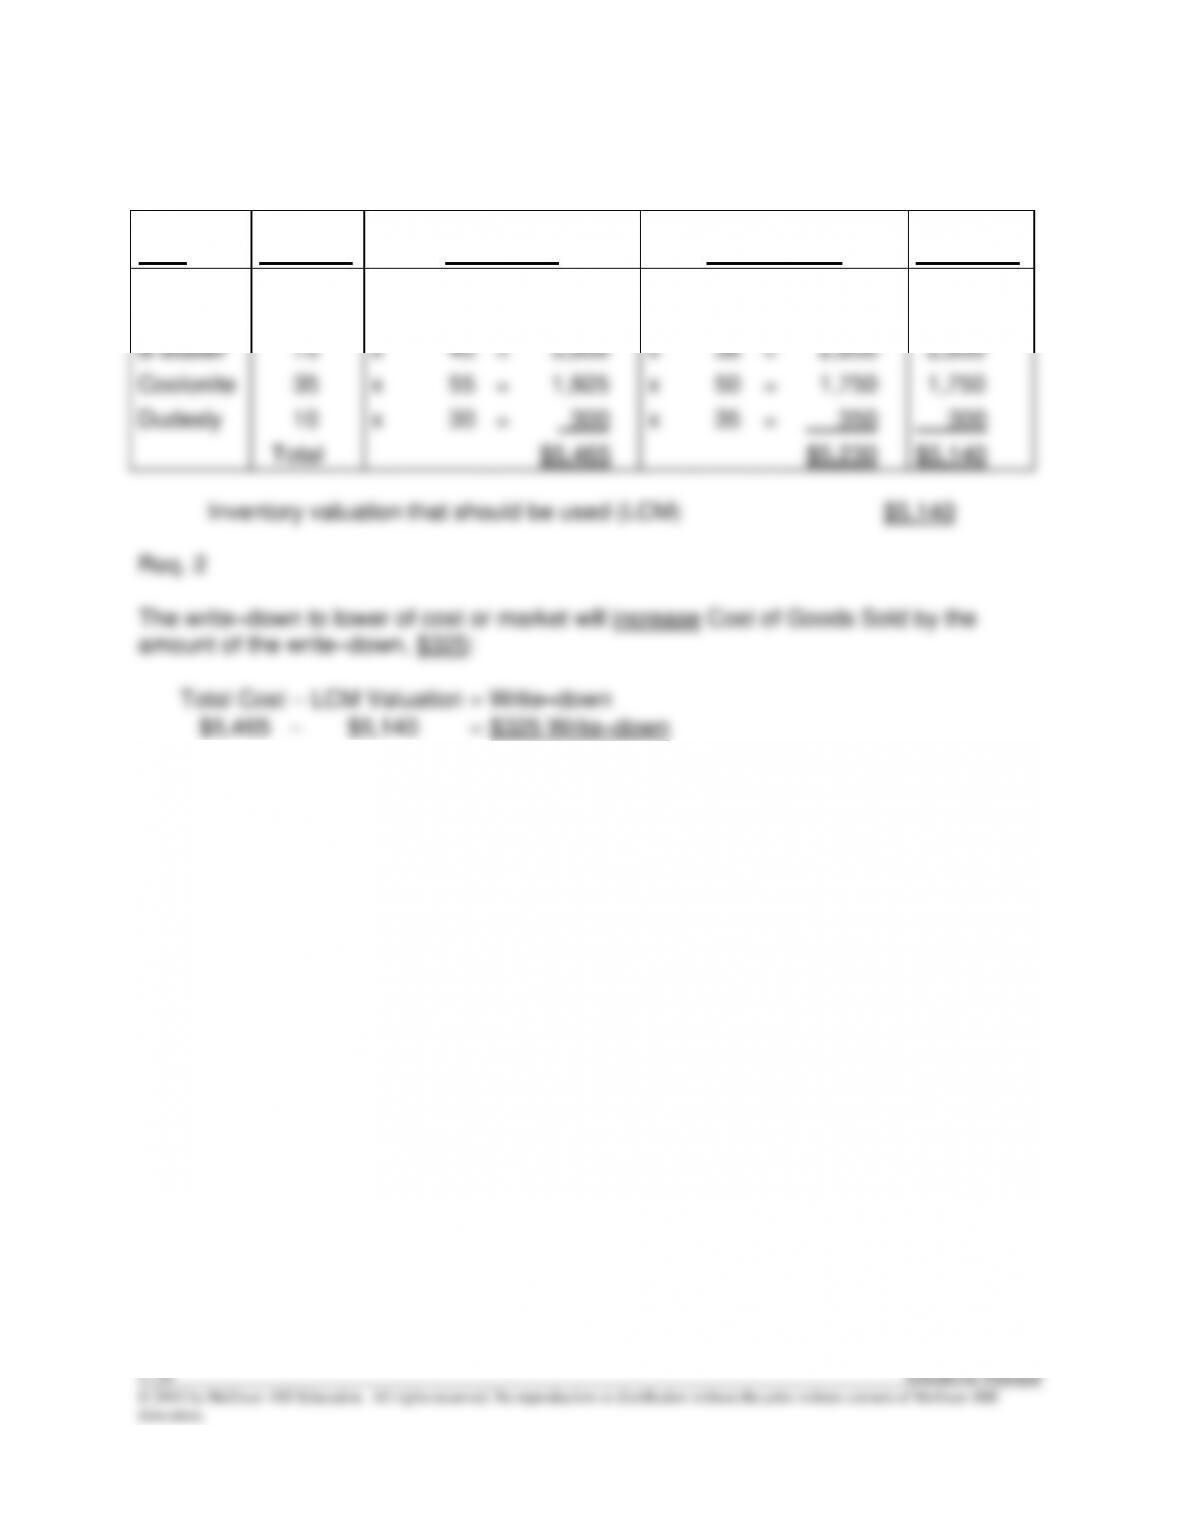
Coolonite
35
x
55
=
1,925
x
50
=
1,750
1,750
Dudesly
10
x
30
=
300
x
35
=
350
300
Total
$5,465
$5,230
$5,140
Inventory valuation that should be used (LCM) $5,140
Req. 2
The write–down to lower of cost or market will increase Cost of Goods Sold by the
amount of the write–down, $325:
Total Cost − LCM Valuation = Write–down
$5,465 − $5,140 = $325 Write–down
E7–12
Req. 1
Assets =
Liabilities
+ Stockholders’ Equity
Inventory –18 million
Cost of Goods Sold (+E) –18 million
Cost of Goods Sold …………………………..……………….. 18 million
Inventory ……………………………………………………… 18 million
Req. 2
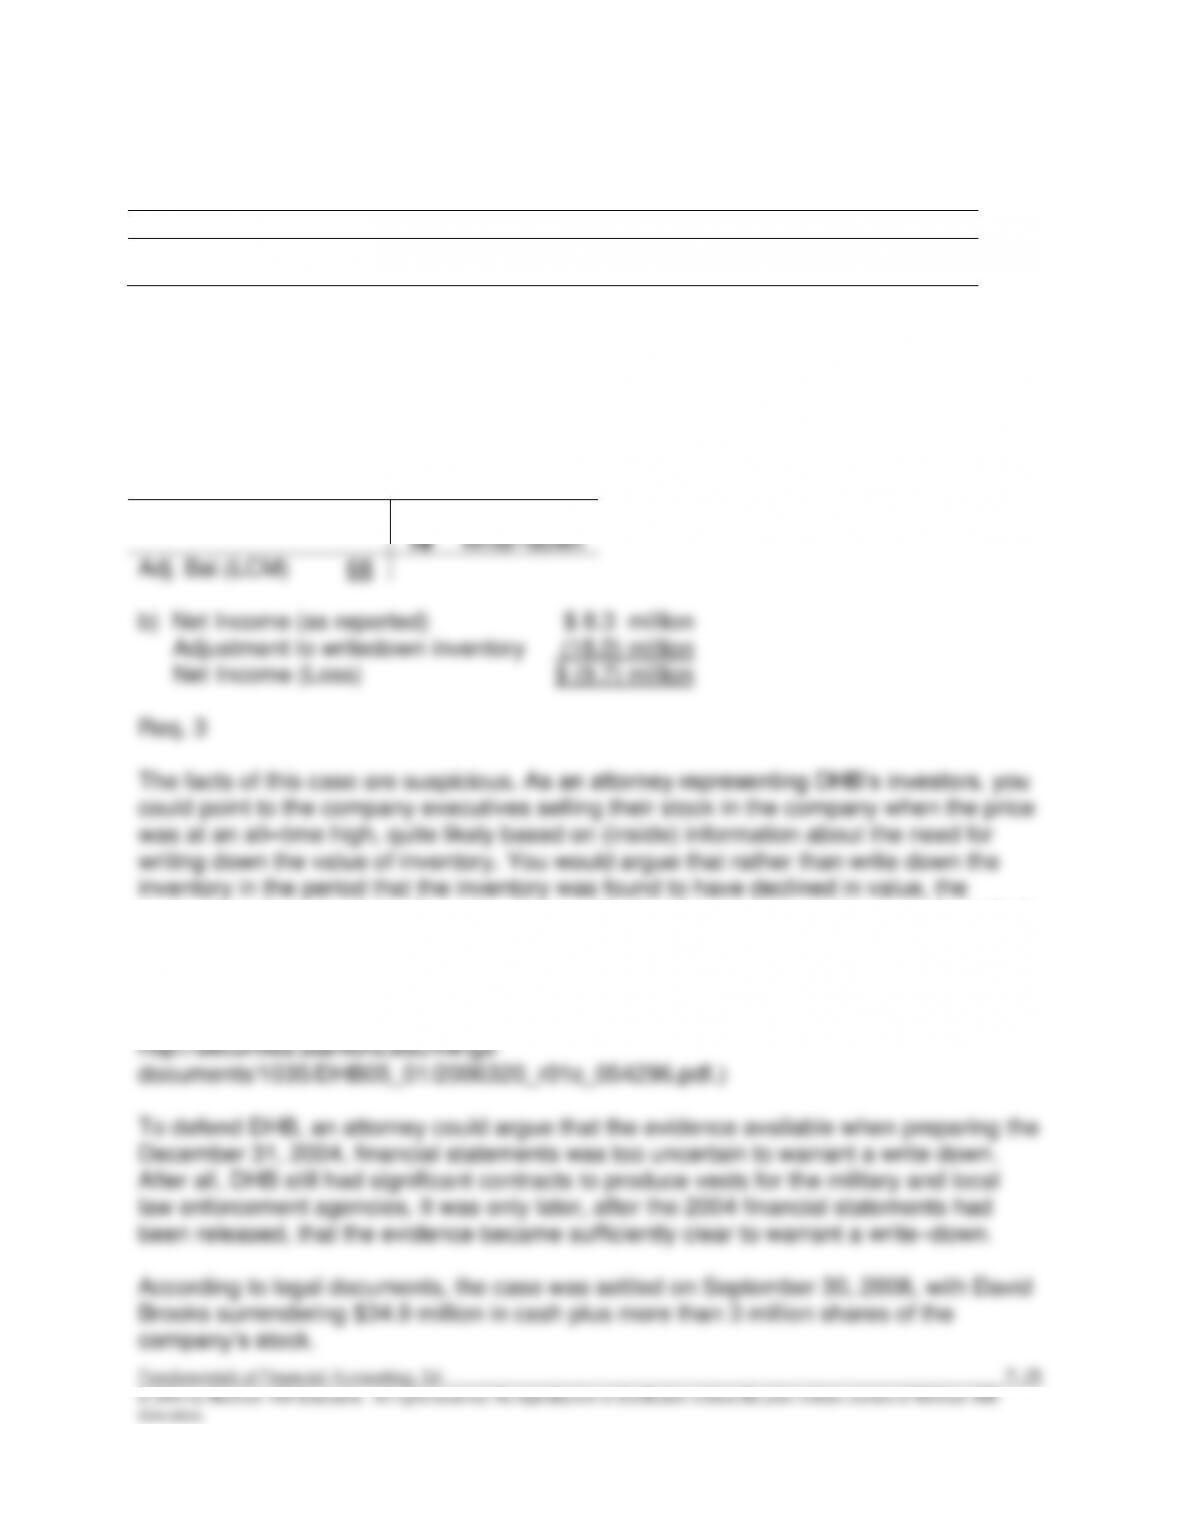
a)
Inventory
Unadj. Bal.
86
18
Write–down
Adj. Bal.(LCM)
68
executives chose to delay the write–down until after they had been able to cash–in their
own personal stock at a higher stock price. You would argue that the failure of Second
Chance was evidence that the market value of Zylon and Zylon–based inventories were
less than their cost. (Interesting enough, these are the precise claims made in a class
action lawsuit filed on March 20, 2006. A copy of that complaint is posted online at
E7–13
Req. 1
2012
2011
2010
Inventory
Turnover Ratio
=
Cost of Goods Sold
=
7.1*
7.0**
7.0***
Average Inventory
Days to Sell
=
365 Days
=
51.4
52.1
52.1
Inventory Turnover
Ratio
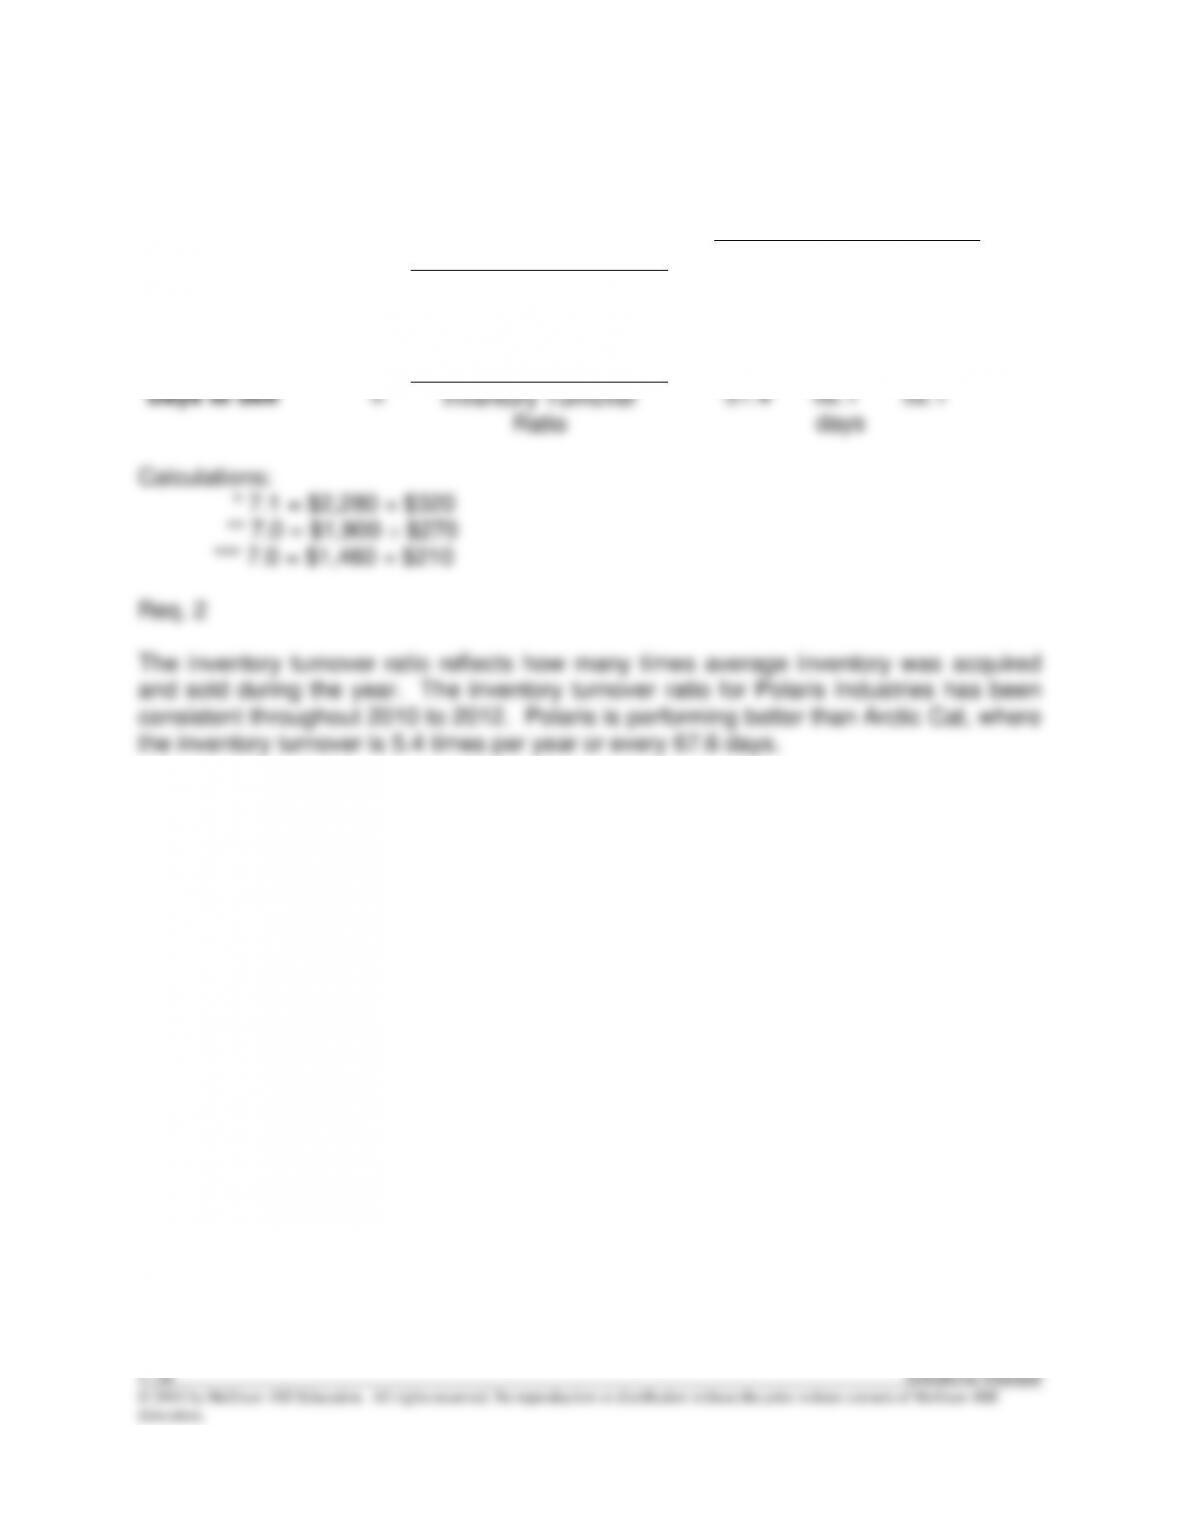
Calculations:
* 7.1 = $2,280 ÷ $320
** 7.0 = $1,900 ÷ $270
*** 7.0 = $1,460 ÷ $210
Req. 2
The inventory turnover ratio reflects how many times average inventory was acquired
and sold during the year. The inventory turnover ratio for Polaris Industries has been
consistent throughout 2010 to 2012. Polaris is performing better than Arctic Cat, where
the inventory turnover is 5.4 times per year or every 67.6 days.
times per year
days
E7–14
Req. 1
Units Sold = 80 + 56 = 136.
Ending Inventory Units = Units Available – Units Sold = 188 – 136 = 52 units.
FIFO
Beginning Inventory
38 units x $ 14
$ 532
+ Purchase
50 units x $ 15
750
+ Purchase
100 units x $ 16
1,600
Goods Available for Sale
188 units
2,882
– Ending Inventory (LIST) (52 × $16)
832
Cost of Goods Sold (FIFO) (38 x $14)+(50 × $15)+(48 x $16)
$ 2,050
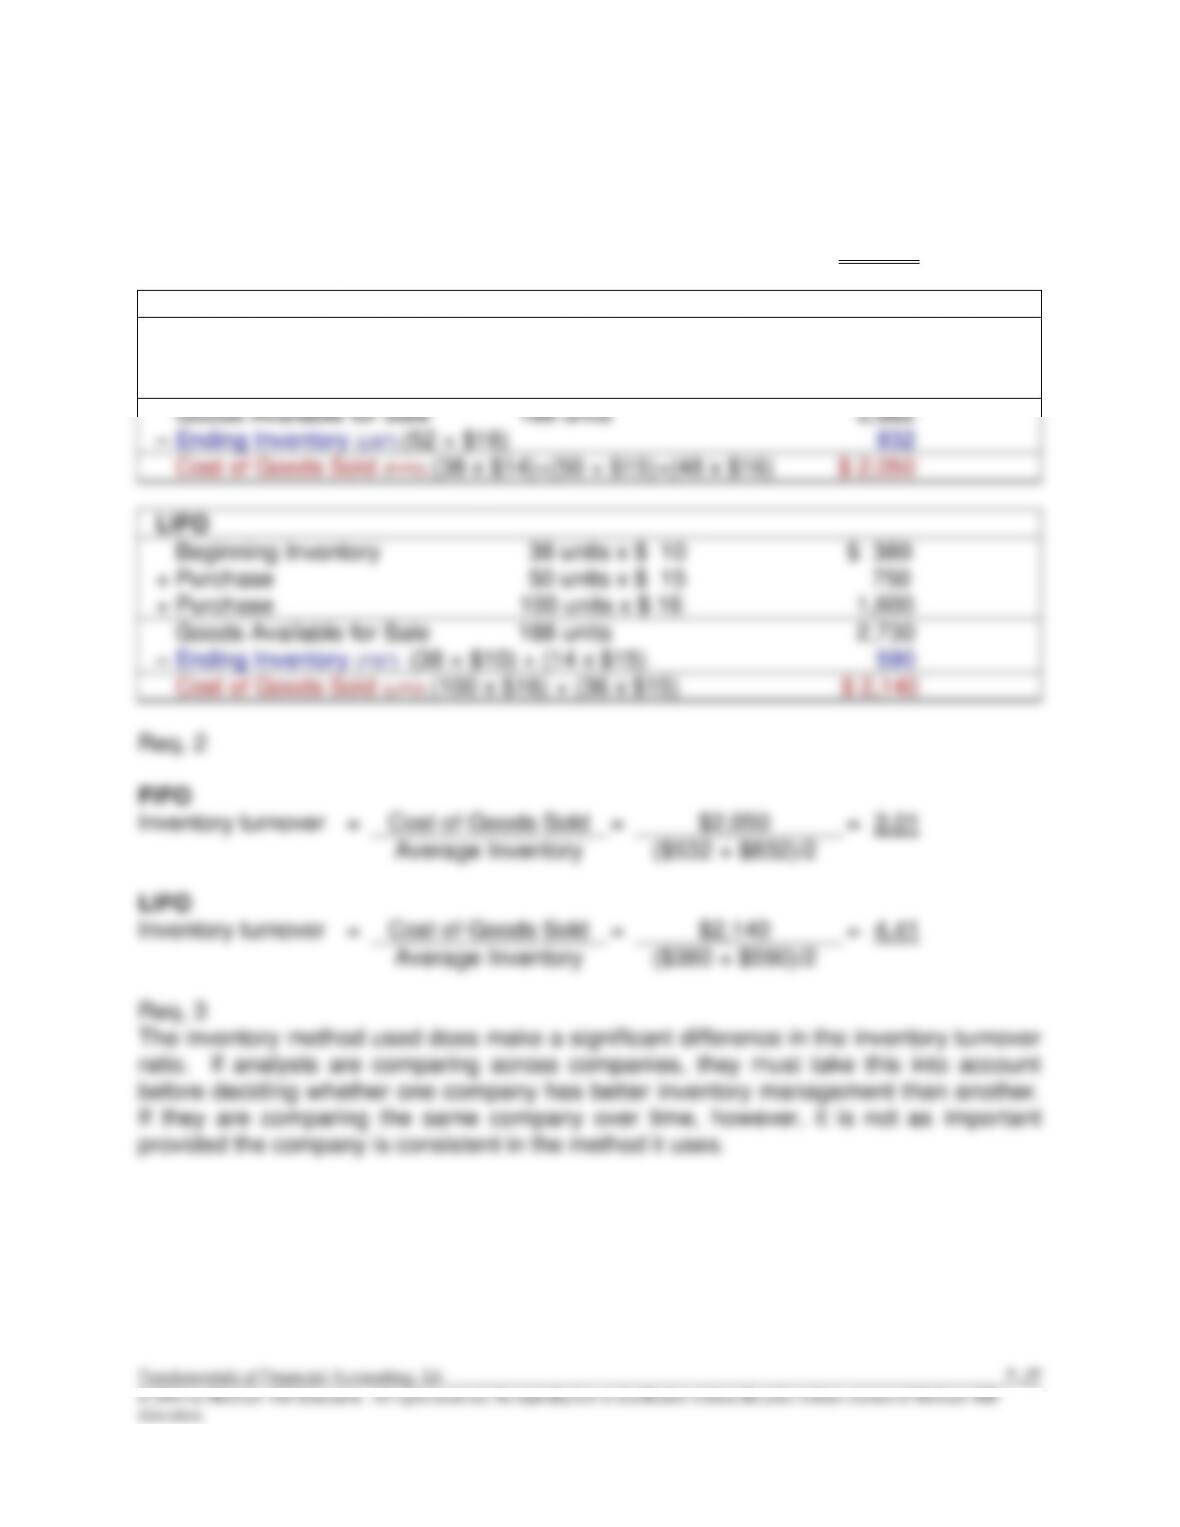
LIFO
Beginning Inventory
38 units x $ 10
$ 380
+ Purchase
50 units x $ 15
750
+ Purchase
100 units x $ 16
1,600
Goods Available for Sale
188 units
2,730
– Ending Inventory (FIST) (38 × $10) + (14 x $15)
590
Cost of Goods Sold (LIFO) (100 x $16) + (36 x $15)
$ 2,140
Req. 2
FIFO
Inventory turnover
=
Cost of Goods Sold
=
$2,050
=
3.01
Average Inventory
($532 + $832)/2
LIFO
Inventory turnover
=
Cost of Goods Sold
=
$2,140
=
4.41
Average Inventory
($380 + $590)/2
Req. 3
The inventory method used does make a significant difference in the inventory turnover
ratio. If analysts are comparing across companies, they must take this into account
before deciding whether one company has better inventory management than another.
If they are comparing the same company over time, however, it is not as important
provided the company is consistent in the method it uses.
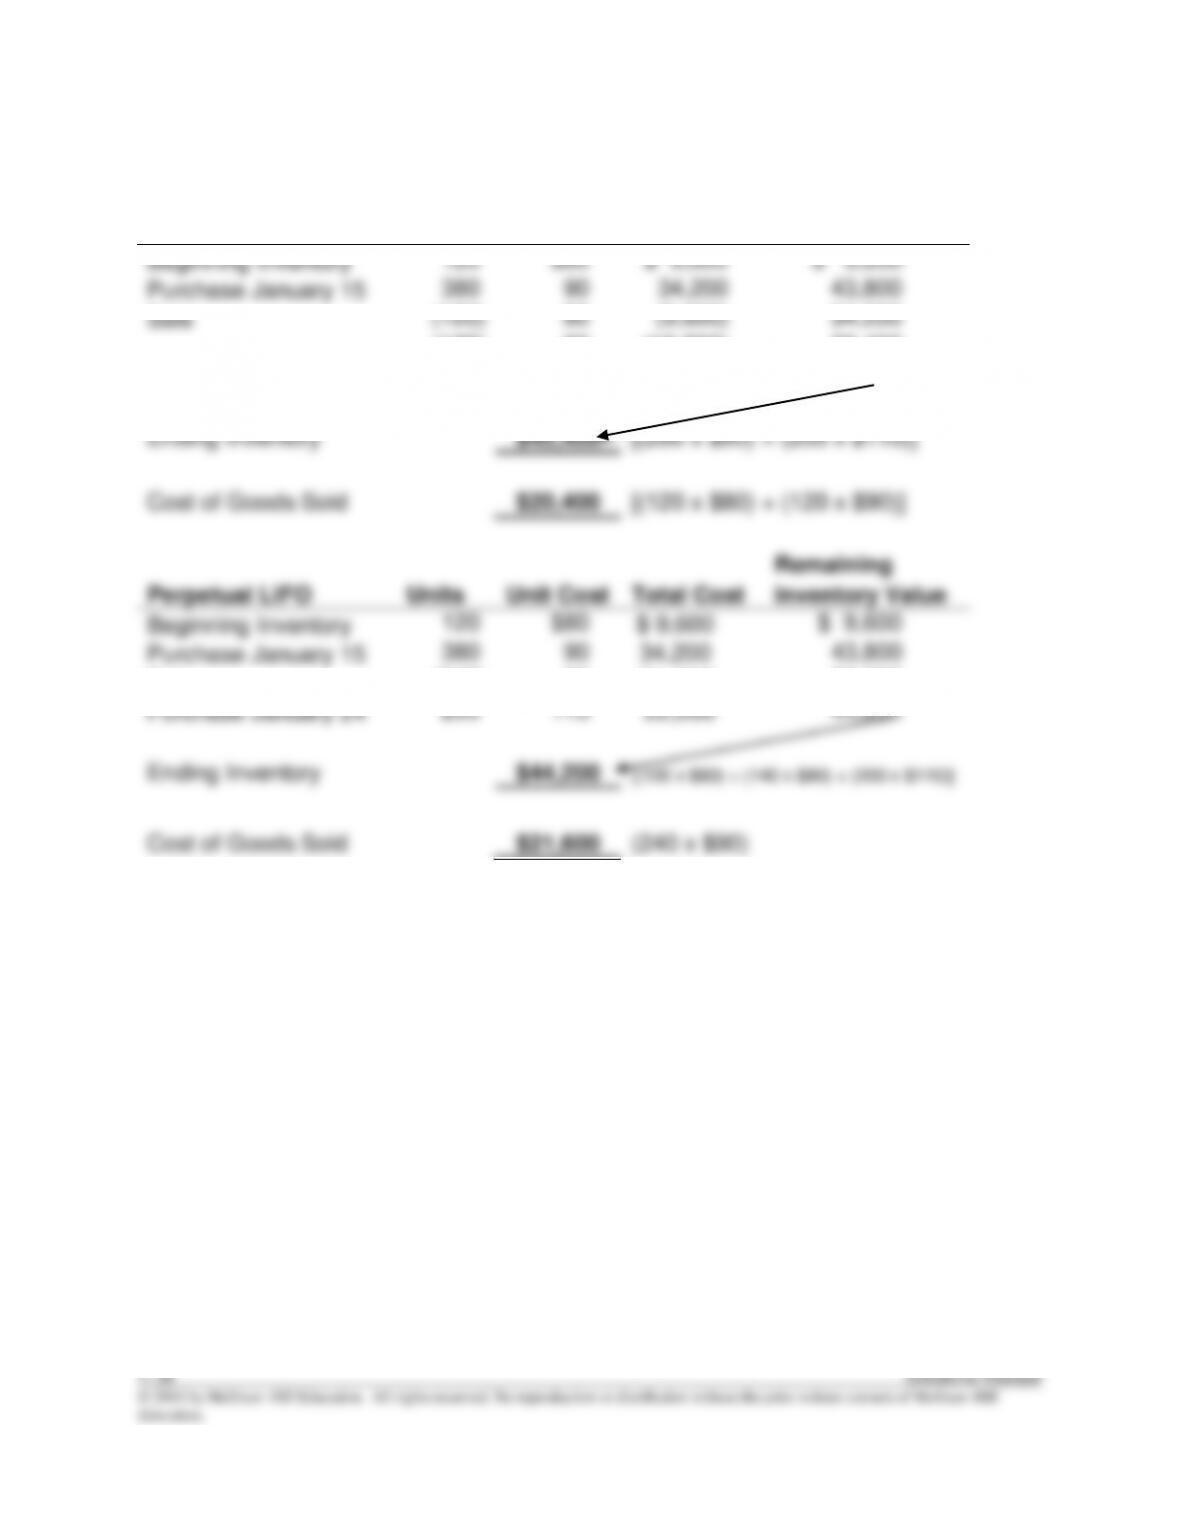
E7–15
Remaining
Perpetual FIFO
Units
Unit Cost
Total Cost
Inventory Value
Beginning Inventory
120
$80
$ 9,600
$ 9,600
Purchase January 15
380
90
34,200
43,800
Sale
(120)
80
(9,600)
34,200
(120)
90
(10,800)
23,400
Purchase January 24
200
110
22,000
45,400
Ending Inventory
$45,400
[(260 x $90) + (200 x $110)]
Cost of Goods Sold
$20,400
[(120 x $80) + (120 x $90)]
Remaining
Perpetual LIFO
Units
Unit Cost
Total Cost
Inventory Value
Beginning Inventory
120
$80
$ 9,600
$ 9,600
Purchase January 15
380
90
34,200
43,800
Sale
(240)
90
(21,600)
22,200
Purchase January 24
200
110
22,000
44,200
Ending Inventory
$44,200
[(120 x $80) + (140 x $90) + (200 x $110)]
Cost of Goods Sold
$21,600
(240 x $90)
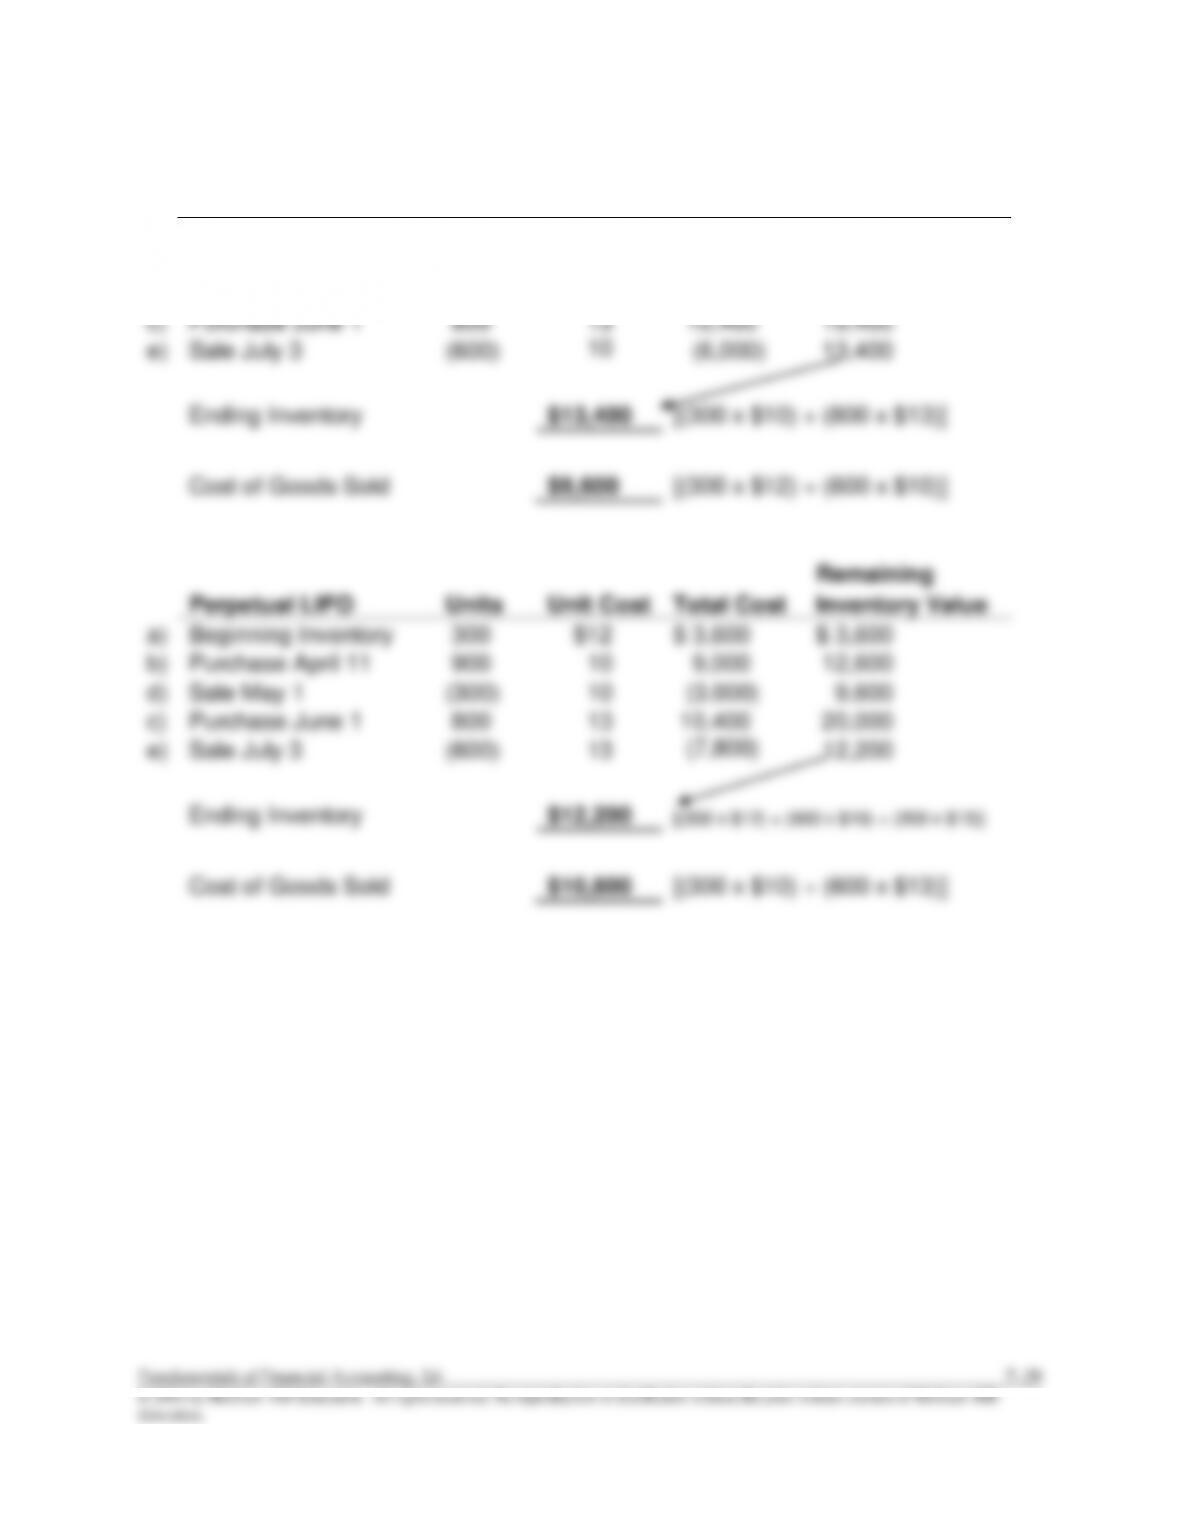
E7–16
Remaining
Perpetual FIFO
Units
Unit Cost
Total Cost
Inventory Value
a)
Beginning Inventory
300
$12
$ 3,600
$ 3,600
b)
Purchase April 11
900
10
9,000
12,600
d)
Sale May 1
(300)
12
(3,600)
9,000
c)
Purchase June 1
800
13
10,400
19,400
e)
Sale July 3
(600)
10
(6,000)
13,400
Ending Inventory
$13,400
[(300 x $10) + (800 x $13)]
Cost of Goods Sold
$9,600
[(300 x $12) + (600 x $10)]
Remaining
Perpetual LIFO
Units
Unit Cost
Total Cost
Inventory Value
a)
Beginning Inventory
300
$12
$ 3,600
$ 3,600
b)
Purchase April 11
900
10
9,000
12,600
d)
Sale May 1
(300)
10
(3,000)
9,600
c)
Purchase June 1
800
13
10,400
20,000
e)
Sale July 3
(600)
13
(7,800)
12,200
Ending Inventory
$12,200
[(300 x $12) + (600 x $10) + (200 x $13)]
Cost of Goods Sold
$10,800
[(300 x $10) + (600 x $13)]
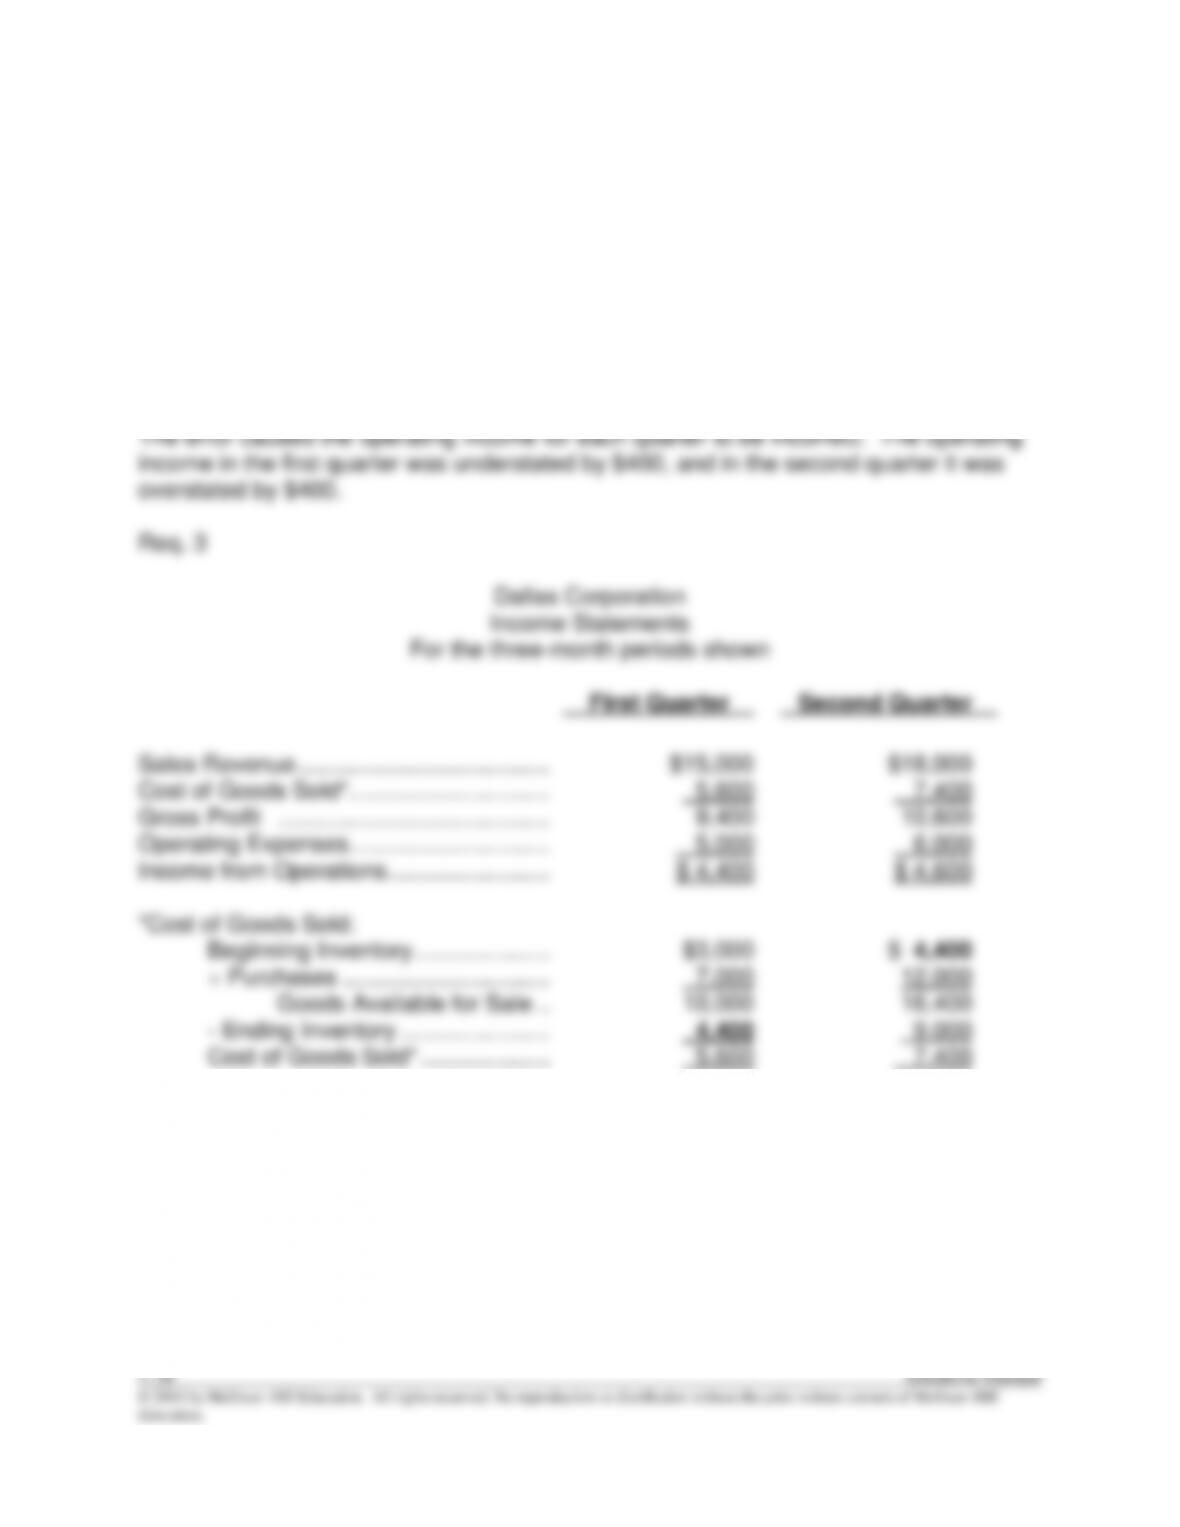
E7–17
Req. 1
The $400 understatement of ending inventory produced operating income amounts that
were incorrect by the amount of $400 for each quarter. However, the effects on
operating income for each quarter were opposing (i.e., the first quarter operating income
was understated by $400, and in the second quarter it was overstated by $400). This
self–correction produces a correct combined income for the two quarters.
Req. 2