Chapter 7
1. Three goals of inventory management are to make or buy products (1) in sufficient
quantities to avoid stock–outs (which could result in lost sales revenue and
2. Merchandisers hold merchandise inventory, which usually is acquired in a finished
(1) Raw materials inventory includes materials that eventually are processed further
(2) Work in process inventory includes goods that are in the process of being
(3) Finished goods inventory includes manufactured goods that are complete and
3. (a) Specific identification–This inventory costing method requires that each
item in the beginning inventory and each item purchased during the period
be identified specifically so that its unit cost can be determined by
identifying the specific item sold. This method usually requires that each
item be marked, often with a code that indicates its cost. When it is sold,
4. The first–in, first–out (FIFO) cost flow assumption is most similar to the gumball
machine. Gumballs (inventory) placed first in the machine are the first out through
the bottom of the machine.
5. Inventory costing does not have to follow the actual flow of a company’s products.
6. LIFO and FIFO have opposite effects on ending inventory on the balance sheet.
The ending inventory is based upon either the oldest unit cost or the newest unit
7. LIFO versus FIFO affects both cost of goods sold and gross profit on the income
8. In times of rising costs, LIFO results in the highest Cost of Goods Sold and,
therefore, the lowest Net Income. Consequently, it is true that the switch from LIFO
to FIFO would increase the company’s Gross Profit and Net Income. Whether this
switch would benefit the managers by increasing their bonus is debatable. One
9. LCM is applied when market (often defined as current replacement cost) is lower
than the cost of units on hand. The LCM requirement to write down ending
10. If the new evidence causes the market value of the existing inventory to fall below
its original cost, the lower of cost or market rule requires that the inventory be
written down. This LCM write–down will reduce the Inventory account on the
balance sheet and will increase the Cost of Goods Sold account on the income
11. The owner is correct in thinking that outsourcing will reduce the amount of inventory
that the company needs to carry. All else equal, a reduction in inventory will cause
12. In a perpetual inventory system, LIFO numbers are calculated using the cost of
period.
13. The effects of inventory errors are felt in more than one period because the ending
inventory for the current period becomes the beginning inventory of the next period.
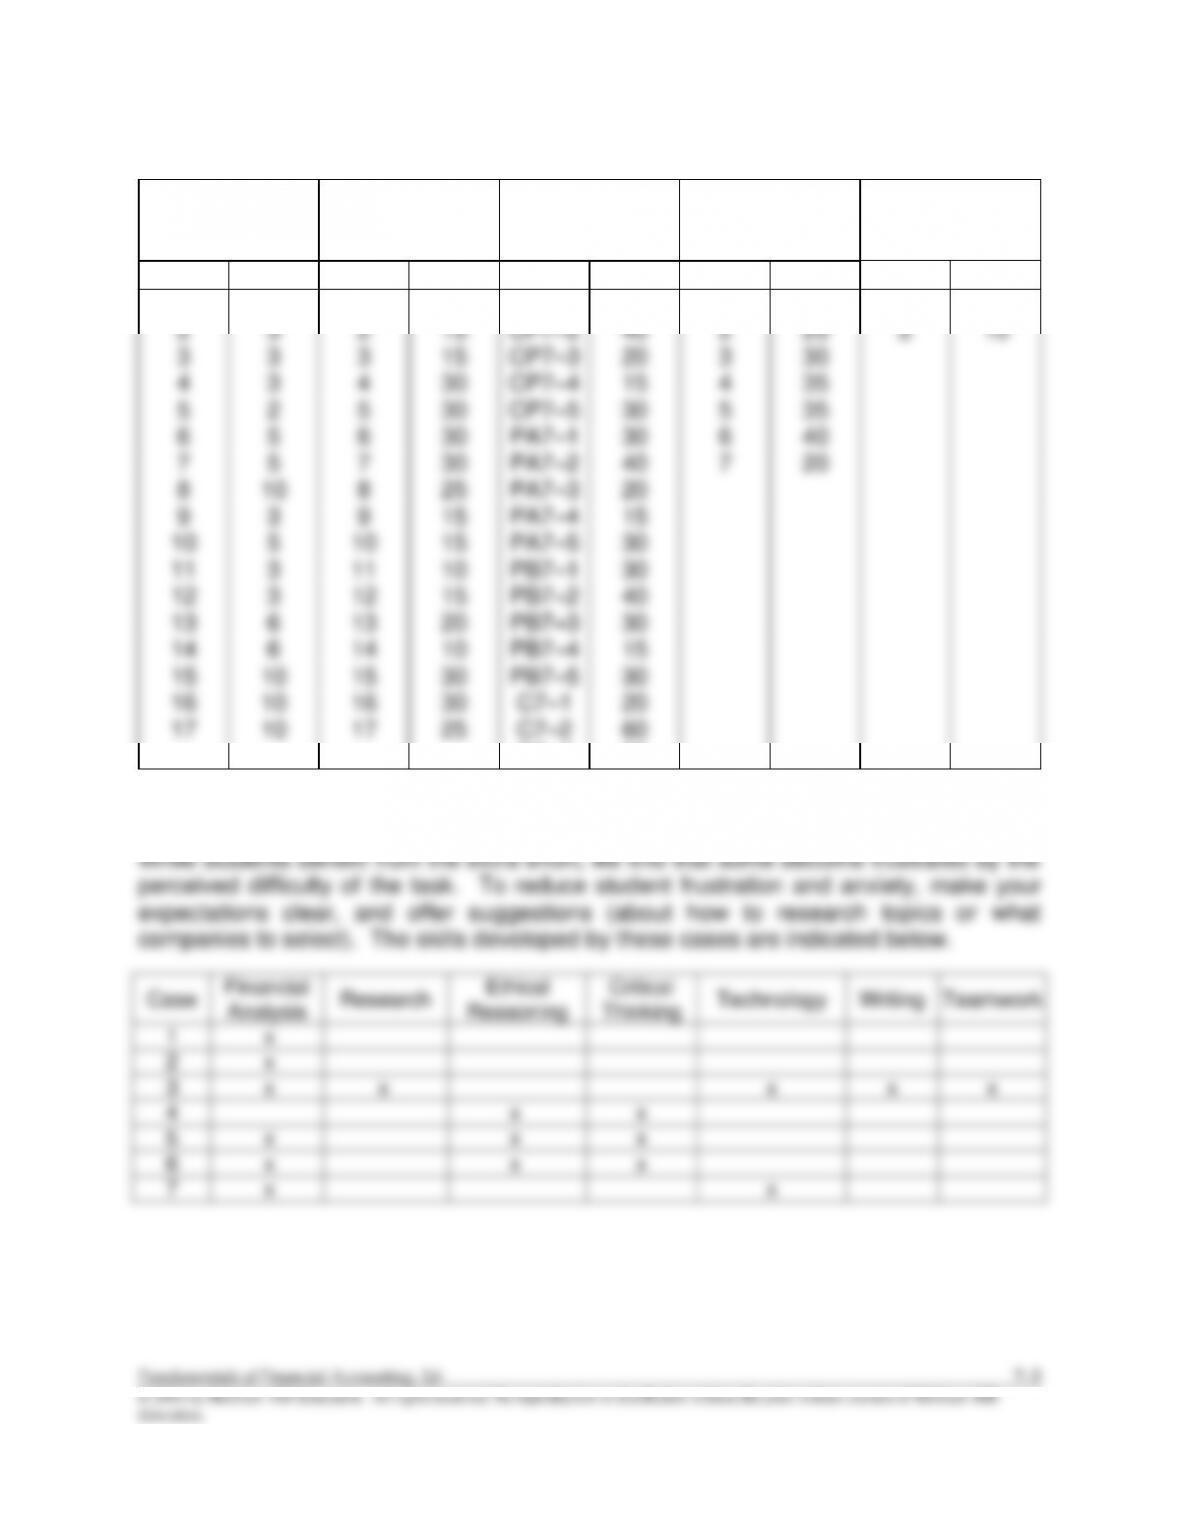
Authors’ Recommended Solution Time
(Time in minutes)
Mini–exercises
Exercises
Problems
Skills
Development
Cases*
Continuing
Case
No.
Time
No.
Time
No.
Time
No.
Time
No.
Time
1
5
1
10
CP7–1
30
1
20
1
15
2
3
2
15
CP7–2
40
2
25
2
10
3
3
3
15
CP7–3
20
3
30
4
3
4
30
CP7–4
15
4
35
5
2
5
30
CP7–5
30
5
35
6
5
6
30
PA7–1
30
6
40
7
5
7
30
PA7–2
40
7
20
8
10
8
25
PA7–3
20
9
3
9
15
PA7–4
15
10
5
10
15
PA7–5
30
11
3
11
10
PB7–1
30
12
3
12
15
PB7–2
40
13
6
13
20
PB7–3
30
14
6
14
10
PB7–4
15
15
10
15
30
PB7–5
30
16
10
16
30
C7–1
20
17
10
17
25
C7–2
60
C7–3
20
* It is difficult to estimate the time students will need to complete cases. As with any
open–ended project, students could devote significant time to these assignments.
7–6 Solutions Manual
© 2016 by McGraw–Hill Education. All rights reserved. No reproduction or distribution without the prior written consent of McGraw-Hill
Education.
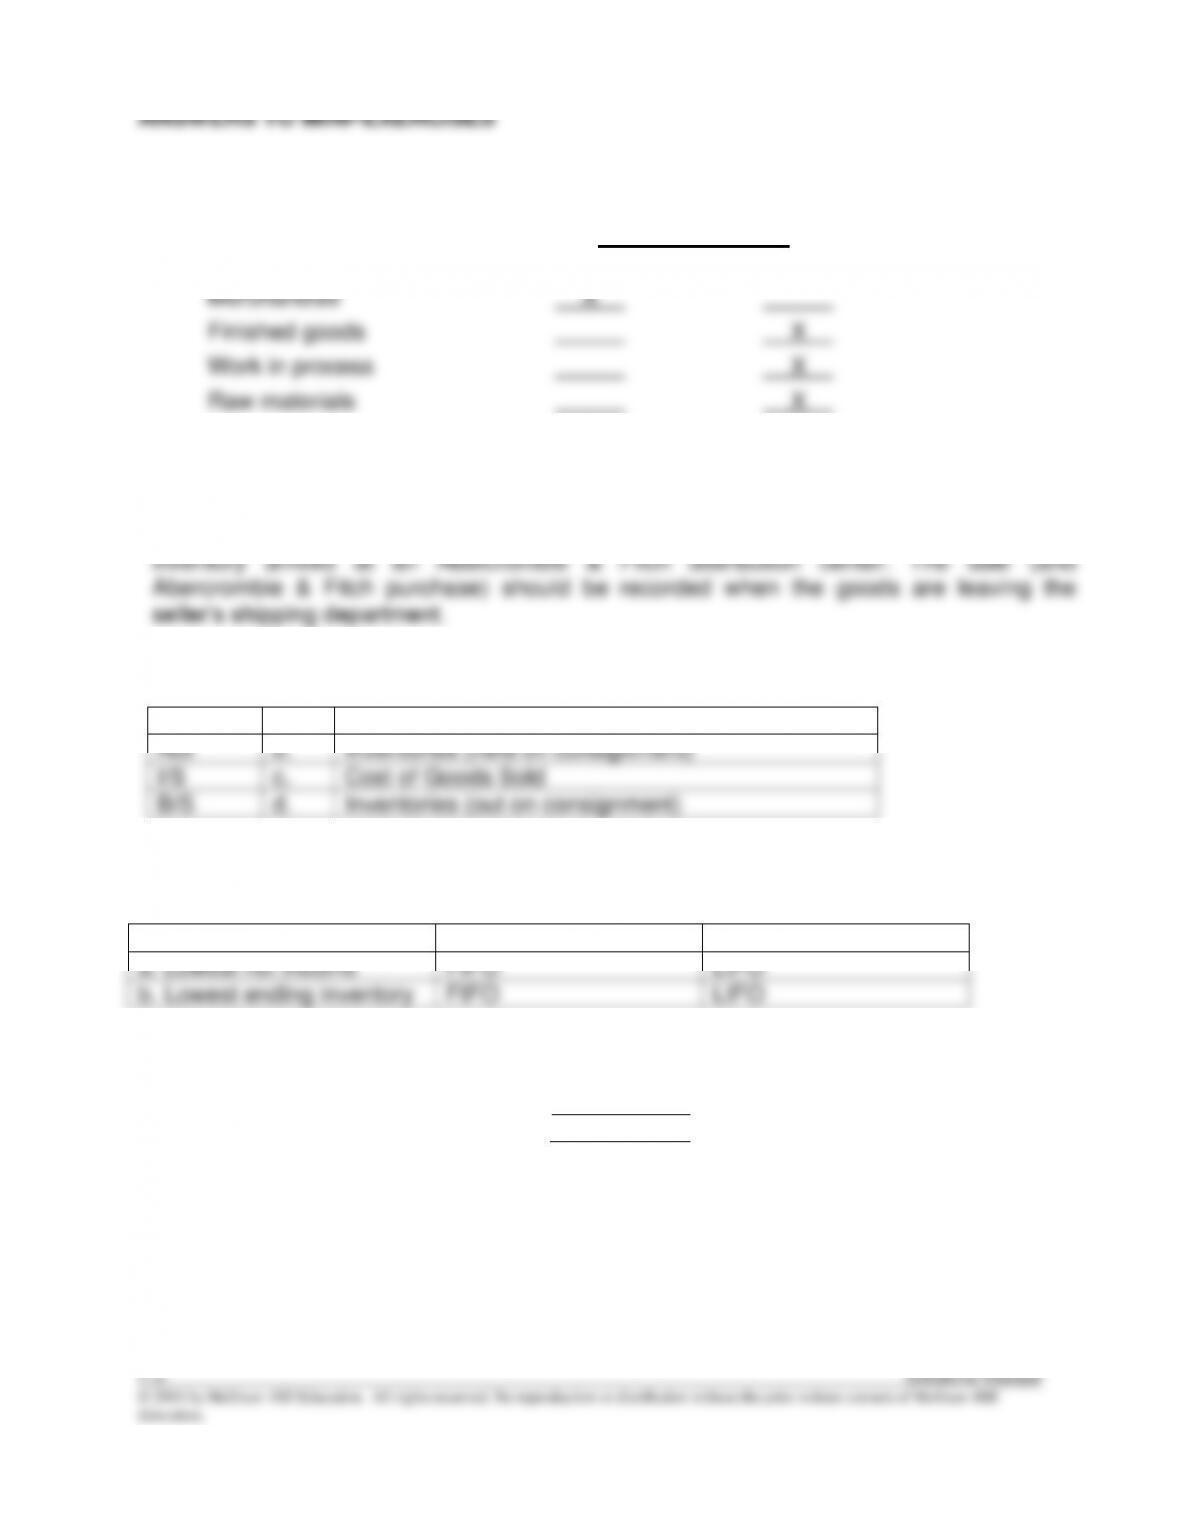
ANSWERS TO MINI–EXERCISES
M7–1
Type of Business
Type of Inventory Merchandising Manufacturing
M7–2
The inventory in transit to Abercrombie & Fitch was sold as FOB shipping point since the
inventory in transit was considered to be owned by Abercrombie & Fitch before the
M7–3
I/S
a.
Sales Revenue
Not
b.
Inventories (held on consignment)
I/S
c.
Cost of Goods Sold
B/S
d.
Inventories (out on consignment)
M7–4
1. Declining Costs
2. Rising Costs
a. Lowest net income
FIFO
LIFO
b. Lowest ending inventory
FIFO
LIFO
M7–5
(a)
Declining costs
FIFO
(b)
Rising costs
LIFO
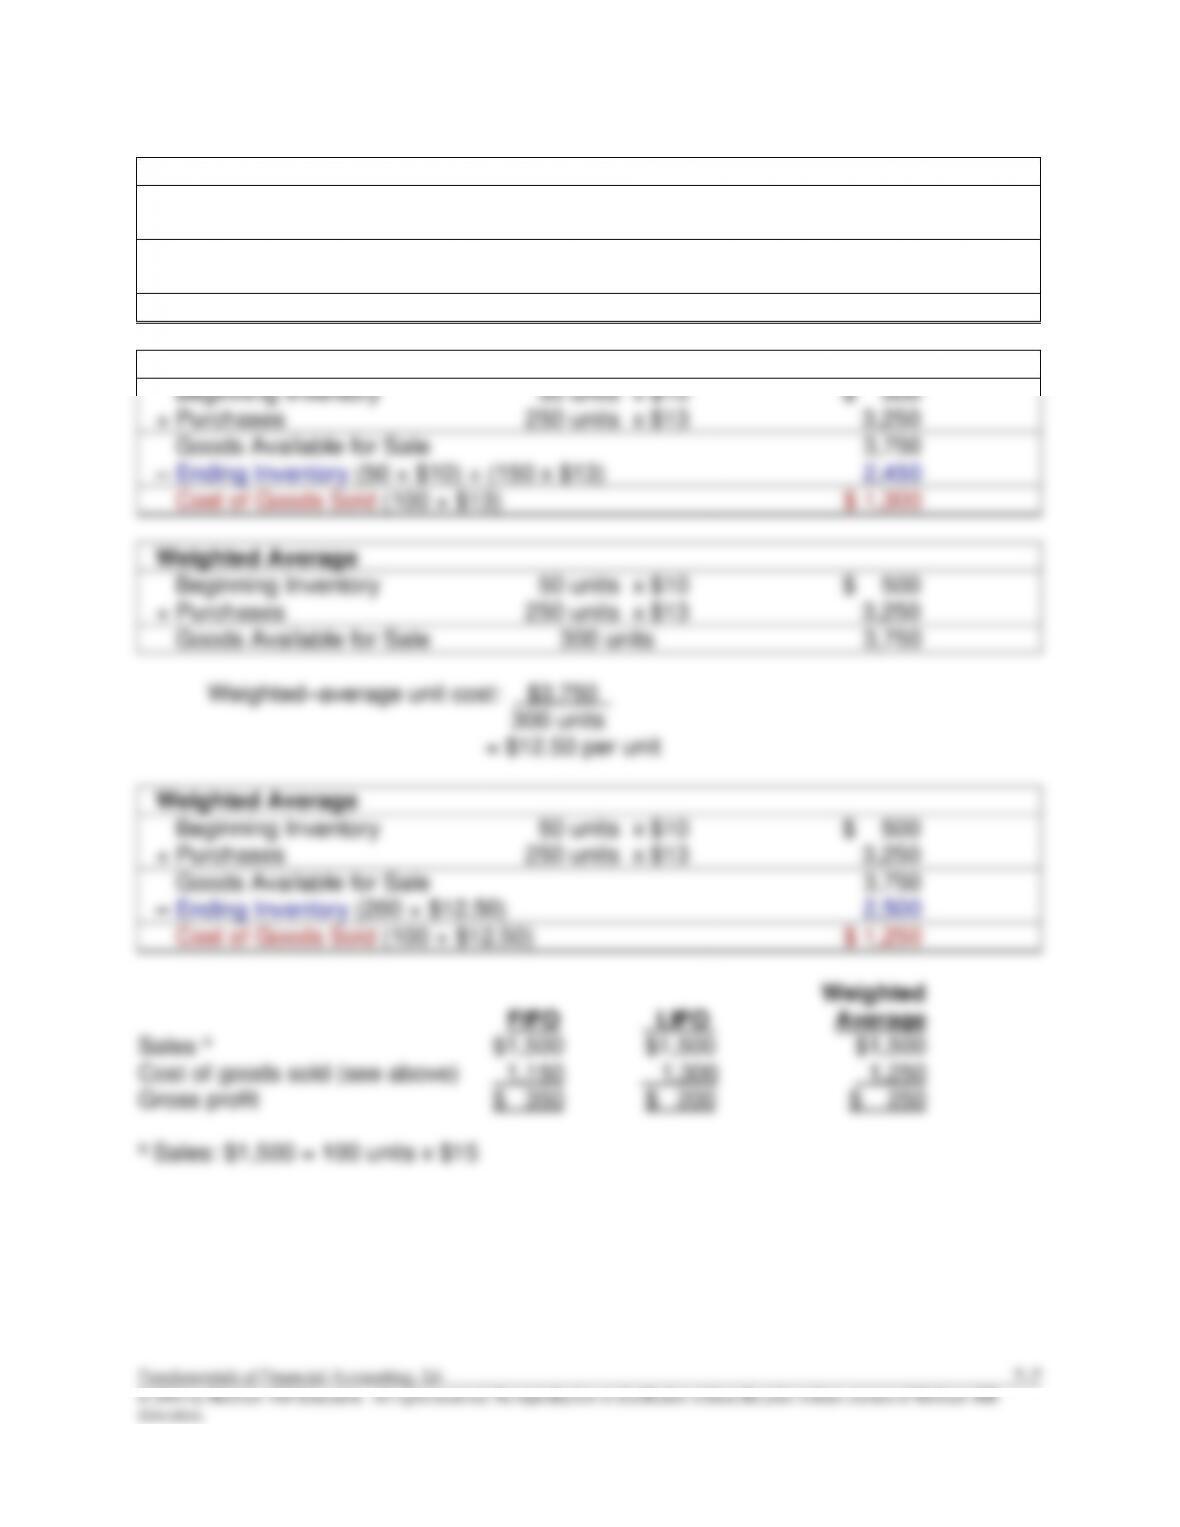
M7–6
FIFO
Beginning Inventory
50 units x $10
$ 500
+ Purchases
250 units x $13
3,250
Goods Available for Sale
3,750
– Ending Inventory (200 × $13)
2,600
Cost of Goods Sold (50 × $10) + (50 × $13)
$ 1,150
LIFO
Beginning Inventory
50 units x $10
$ 500
+ Purchases
250 units x $13
3,250
Goods Available for Sale
3,750
– Ending Inventory (50 × $10) + (150 x $13)
2,450
Cost of Goods Sold (100 × $13)
$ 1,300
Beginning Inventory
50 units x $10
$ 500
+ Purchases
250 units x $13
3,250
Goods Available for Sale
3,750
Weighted Average
$ 500
3,250
3,750
Cost of Goods Sold (100 × $12.50)
$ 1,250
1,250
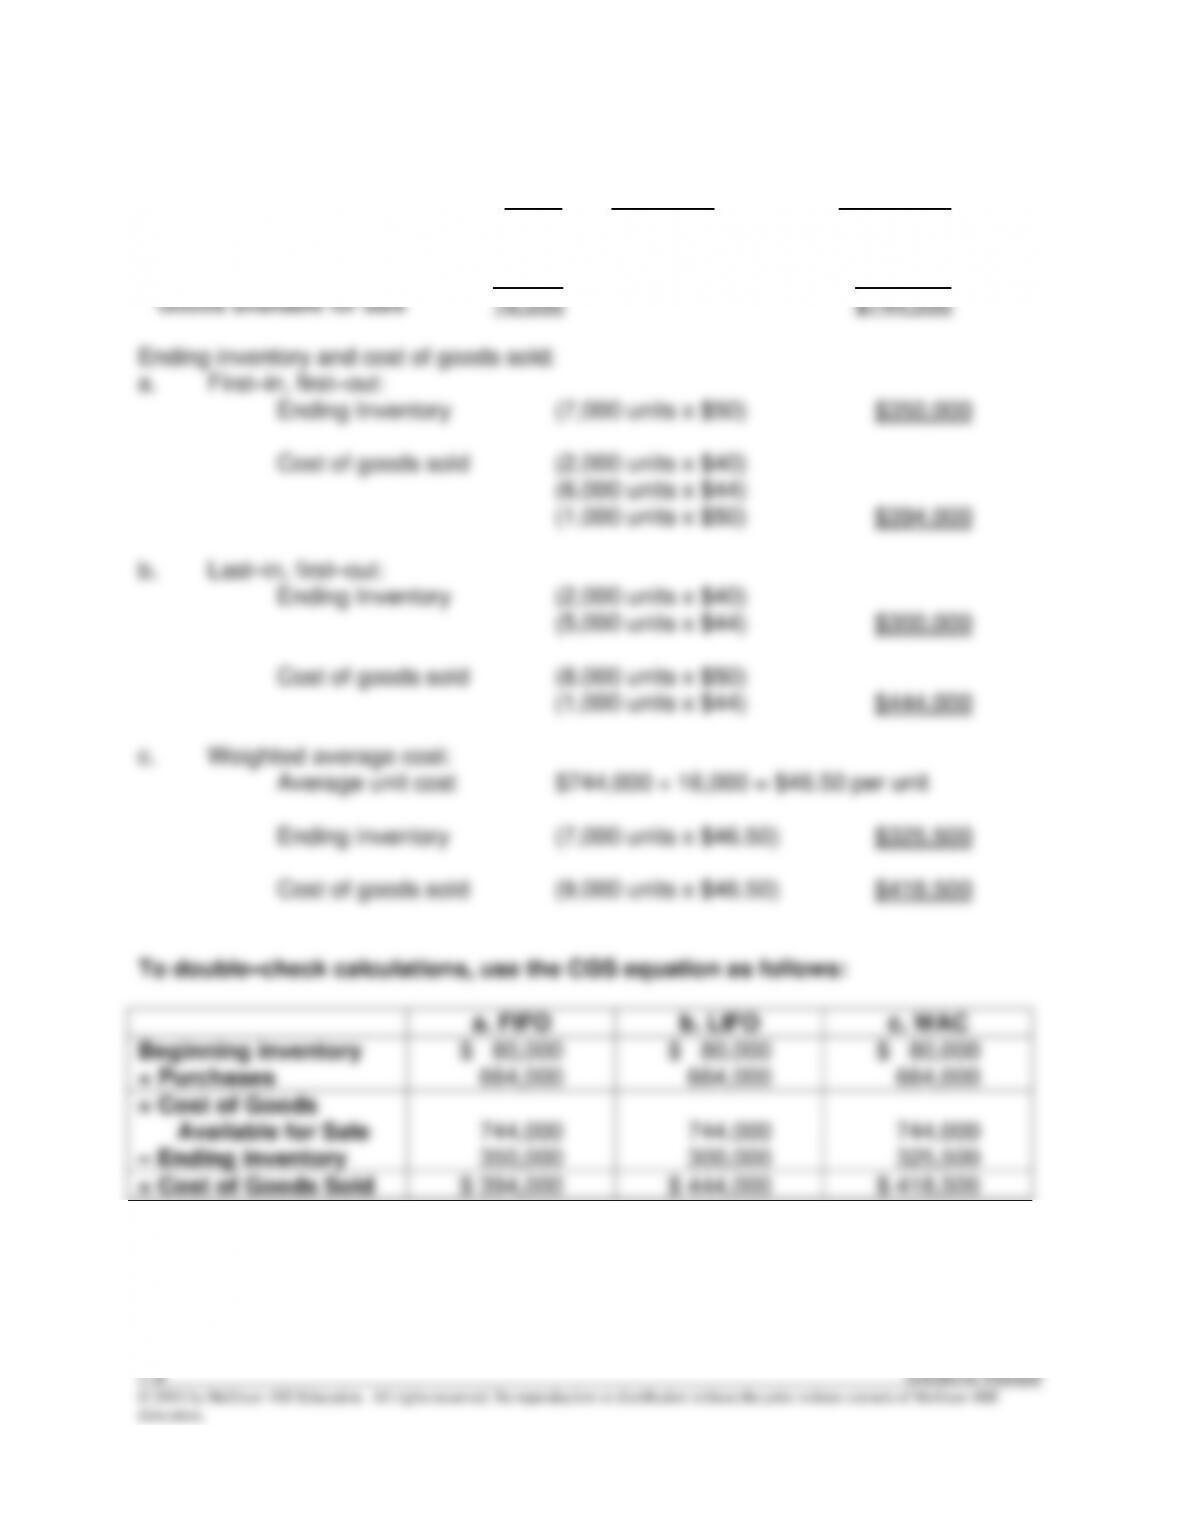
M7–7
Goods available for sale –
All methods
Units
Unit Cost
Total Cost
Beginning inventory
2,000
$40
$ 80,000
Next units in (7/13 purchase)
6,000
44
264,000
Next units in (7/25 purchase)
8,000
50
400,000
Goods available for sale
16,000
$744,000
Ending inventory and cost of goods sold:
a. First–in, first–out:
Ending Inventory (7,000 units x $50) $350,000
Cost of goods sold (2,000 units x $40)
(6,000 units x $44)
(1,000 units x $50) $394,000
b. Last–in, first–out:
Ending Inventory (2,000 units x $40)
(5,000 units x $44) $300,000
Cost of goods sold (8,000 units x $50)
(1,000 units x $44) $444,000
c. Weighted average cost:
Average unit cost $744,000 ÷ 16,000 = $46.50 per unit
Ending inventory (7,000 units x $46.50) $325,500
Cost of goods sold (9,000 units x $46.50) $418,500
To double–check calculations, use the CGS equation as follows:
a. FIFO
b. LIFO
c. WAC
Beginning inventory
$ 80,000
$ 80,000
$ 80,000
+ Purchases
664,000
664,000
664,000
= Cost of Goods
Available for Sale
744,000
744,000
744,000
– Ending inventory
350,000
300,000
325,500
= Cost of Goods Sold
$ 394,000
$ 444,000
$ 418,500
M7–8
Goods available for sale –
All methods
Units
Unit Cost
Total Cost
First units in (January 1)
300
$7
$2,100
Next units in (January 8)
450
8
3,600
Next units in (January 29)
750
9
6,750
Total
1,500
$12,450
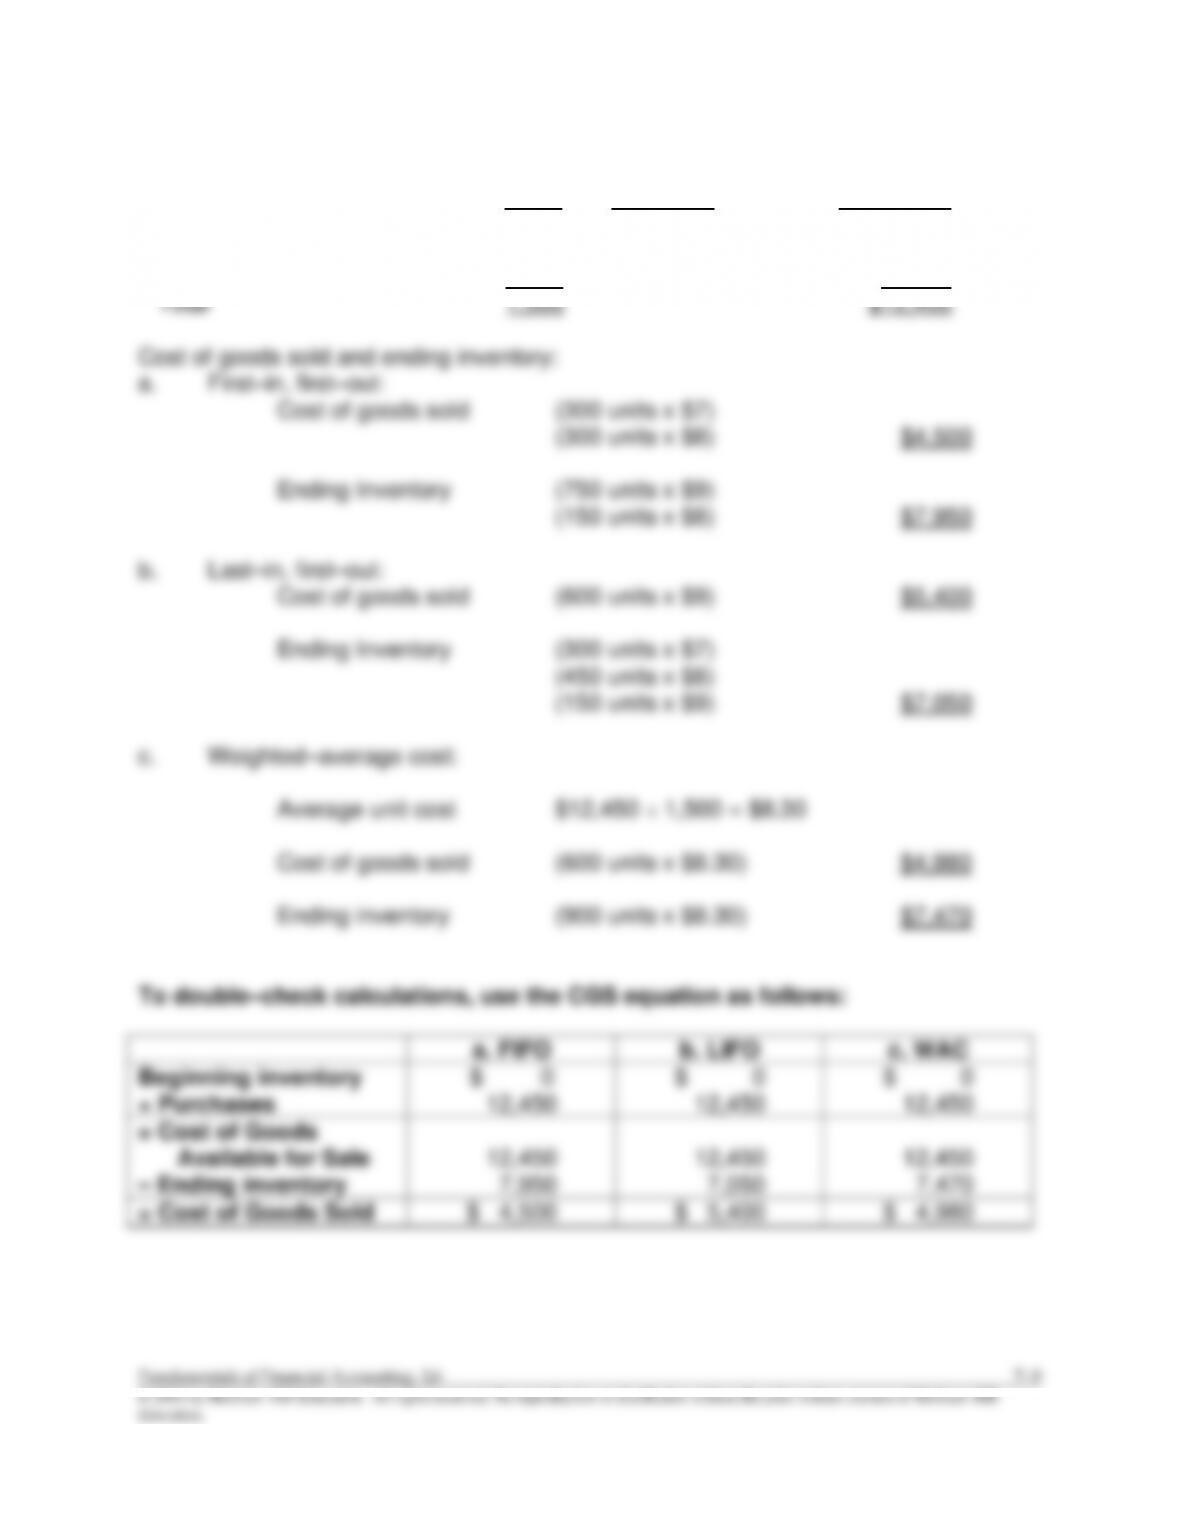
Cost of goods sold and ending inventory:
a. First–in, first–out:
Cost of goods sold (300 units x $7)
(300 units x $8) $4,500
Ending Inventory (750 units x $9)
(150 units x $8) $7,950
b. Last–in, first–out:
Cost of goods sold (600 units x $9) $5,400
Ending Inventory (300 units x $7)
(450 units x $8)
(150 units x $9) $7,050
c. Weighted–average cost:
Average unit cost $12,450 ÷ 1,500 = $8.30
Cost of goods sold (600 units x $8.30) $4,980
Ending inventory (900 units x $8.30) $7,470
To double–check calculations, use the CGS equation as follows:
a. FIFO
b. LIFO
c. WAC
Beginning inventory
$ 0
$ 0
$ 0
+ Purchases
12,450
12,450
12,450
= Cost of Goods
Available for Sale
12,450
12,450
12,450
– Ending inventory
7,950
7,050
7,470
= Cost of Goods Sold
$ 4,500
$ 5,400
$ 4,980
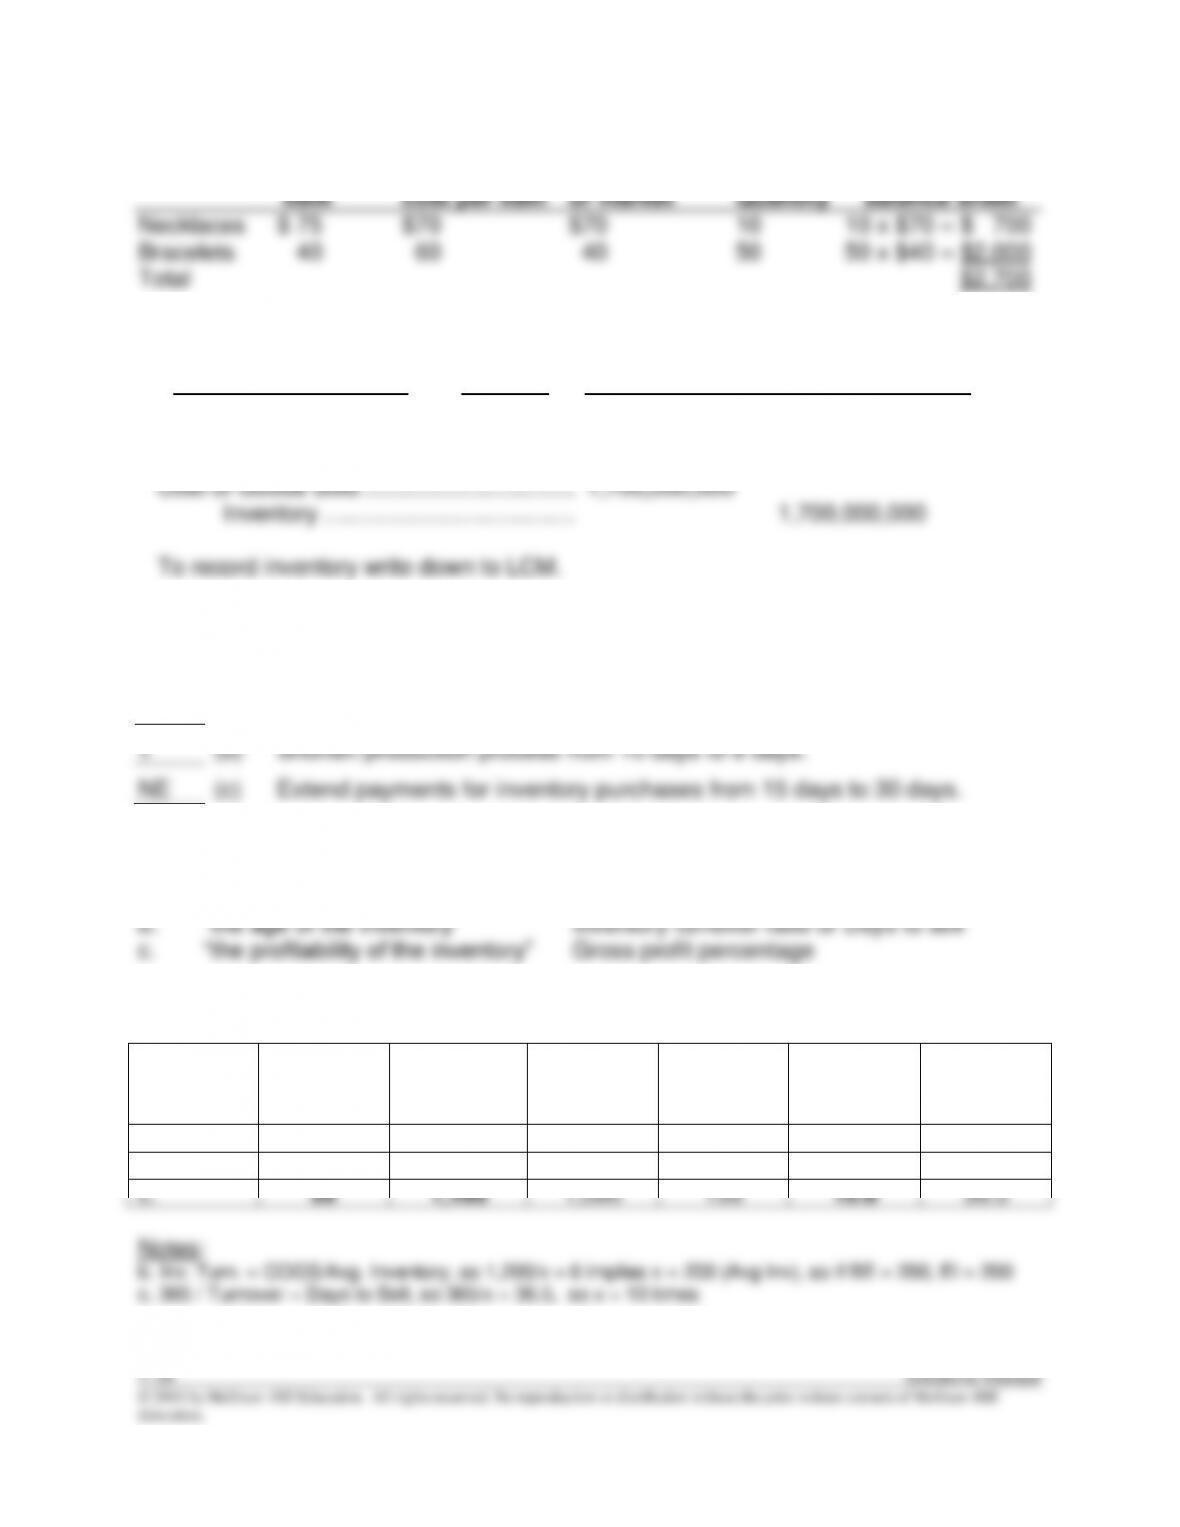
M7–9
Cost per
item
Replacement
cost per item
Lower of cost
or market
Quantity
Total reported on
balance sheet
Necklaces
$ 75
$70
$70
10
10 x $70 = $ 700
Bracelets
40
60
40
50
50 x $40 = $2,000
Total
$2,700
M7–10
Assets = Liabilities + Stockholders’ Equity
Inventory –1,700,000,000 Cost of Goods Sold (+E) –1,700,000,000
Cost of Goods Sold …………………………………….
1,700,000,000
Inventory ………………………………………….
1,700,000,000
To record inventory write down to LCM.
M7–11
+
(a)
Inventory delivered by suppliers daily instead of weekly.
+
(b)
Shorten production process from 10 days to 8 days.
NE
(c)
Extend payments for inventory purchases from 15 days to 30 days.
M7–12
a.
“the current rate of sale”
Inventory turnover ratio or Days to sell
b.
“the age of the inventory”
Inventory turnover ratio or Days to sell
c.
“the profitability of the inventory”
Gross profit percentage
M7–13
Case
BI
Purchases
CGS
EI
Inventory
Turnover
Ratio
Days to
Sell
a.
$100
$700
$600
$200
4.0
91.3
b.
200
1200
1,200
200
6.0
60.8
c.
50
1,100
1,000
150
10.0
36.5
Notes:
b. Inv. Turn. = COGS/Avg. Inventory, so 1,200/x = 6 implies x = 200 (Avg Inv), so if BE = 200, EI = 200
c. 365 / Turnover = Days to Sell, so 365/x = 36.5, so x = 10 times