Chapter Outline
Teaching Notes
B. Comparison to Benchmarks
Illustrated in Exhibit 7.7
1. Inventory turnover ratios and the number of days to sell
can be helpful in comparing different companies’
inventory management practices.
2. These measures can vary significantly between industries:
a. For merchandisers, inventory turnover refers to buying
and selling goods.
b. For manufacturers, it refers to producing and
delivering inventory to customers
3. Inventory turnover measures also can vary significantly
between companies within the same industry, particularly
if they take different approaches to pricing their
inventories.
The “Spotlight on Financial
Reporting” feature suggests
4. Often, the company with a lower gross profit percentage
has a faster inventory turnover
That worsening inventory
turnover and gross profit
5. With this big a range in ratios between industries and
companies, it’s most useful to compare a company’s
turnover with its own results from prior periods.
percentages may signal the
need for a write-down to
report inventory at LCM
IV. Supplement 7A—FIFO, LIFO, and Weighted Average in a
Perpetual Inventory System
LO 7–S1 Compute inventory costs in perpetual systems.
A. Reasons for Showing Cost Flow Assumptions in a Periodic
Inventory System:
1. First, only the LIFO and weighted average calculations
differ between periodic and perpetual inventory systems.
2. FIFO calculations don’t differ between periodic and
perpetual systems.
3. Nearly half of all U.S. companies use FIFO, so even if
they calculate costs under a perpetual system, it is
identical to calculating costs under a periodic system.
4. Also, most LIFO companies actually use FIFO during the
period and then adjust to LIFO at the end of the period.
By waiting to the end of the period to calculate this LIFO
adjustment, it’s as if all purchases during the period were
recorded before the Cost of Goods Sold is calculated and
recorded.
B. FIFO (First-in, First-Out)—FIFO calculations don’t differ
between periodic and perpetual systems.
C. LIFO (Last-in, First-Out)
1. LIFO numbers are calculated using the cost of goods last
in as of the date of sale.
2. This differs from a periodic system, where the cost of
goods sold is calculated as if all sales occurred at the end
of the period.
Chapter Outline
Teaching Notes
D. Weighted Average Cost—In a perpetual inventory system,
the weighted average cost must be calculated each time a
sale is recorded.
E. Financial Statement Effects
Summarized in Exhibit 7A.1
1. These methods differ only in the way they split the cost of
goods available for sale between ending inventory and
cost of goods sold.
2. If a cost goes into Cost of Goods Sold, it must be taken
out of Inventory.
3. Thus, the method that assigns the highest cost to cost of
goods sold assigns the lowest cost to ending inventory
(and vice versa).
V. Supplement 7B—The Effects of Errors in Ending Inventory
LO 7–S2 Determine the effects of inventory errors.
A. Impact of Errors on Current Year’s Financial Statements
1. Errors in inventory affect both the balance sheet and
income statement.
Impact on income taxes
ignored in the discussion.
2. As the cost of goods sold equation indicates, a direct
relationship exists between ending inventory and cost of
goods sold because items not in the ending inventory are
assumed to have been sold.
3. Thus, any errors in ending inventory will affect the
balance sheet (current assets) and the income statement
(cost of goods sold, gross profit, and net income).
B. Impact of Errors on Following Year’s Financial Statements
Illustrated in Exhibit 7B.1
The effects of inventory errors are felt in more than one year
because the ending inventory for one year becomes the
beginning inventory for the next year.
C. Determining the Effects of Errors in Inventory
To determine the effects of inventory errors on the financial
statements in both the current year and the following year,
use the cost of goods sold equation.

Supplemental Enrichment Activities
Note: These activities would be suitable for individual or group activities.
1. Handout 7–1
Use Handout 7–1 for an in-class activity designed to review the calculation of costs using all four
inventory costing methods. The solution follows the handout master.
2. Handout 7–2
Use Handout 7–2 for an in-class activity designed to review the application of the lower of cost or
market rule. The solution follows the handout master.
HANDOUT 7–1
INVENTORY COSTING METHODS
Quickie Grocery acquired the following five bottles of Corporate-Cola soft drink:
Date
Jan. 2
Jan. 10
Jan. 12
Jan. 16
Jan. 25
Cost
$1.00
$2.00
$3.00
$4.00
$5.00
A January 31 inventory count revealed that two bottles remained on the shelf. How many bottles were
sold in January?
Specific Identification
The Quickie Grocery keeps track of each individual bottle. Suppose the Grocery knows that it sold the
bottles acquired on Jan. 2, 12, and 16.
Date
Jan. 2
Jan. 10
Jan. 12
Jan. 16
Jan. 25
Total
Cost
$1.00
$2.00
$3.00
$4.00
$5.00
$15.00
COGS
Inventory
What was the value of inventory on January 31?
What was the cost of goods sold for January?
First-in, First-out (FIFO)
Date
Jan. 2
Jan. 10
Jan. 12
Jan. 16
Jan. 25
Total
Cost
$1.00
$2.00
$3.00
$4.00
$5.00
$15.00
COGS
Inventory
What was the value of inventory on January 31?
What was the cost of goods sold for January?
HANDOUT 7–1, CONTINUED
Last-in, First-out (LIFO)
Date
Jan. 2
Jan. 10
Jan. 12
Jan. 16
Jan. 25
Total
Cost
$1.00
$2.00
$3.00
$4.00
$5.00
$15.00
COGS
Inventory
What was the value of inventory on January 31?
What was the cost of goods sold for January?
Weighted Average
Date
Jan. 2
Jan. 10
Jan. 12
Jan. 16
Jan. 25
Cost
$1.00
$2.00
$3.00
$4.00
$5.00
$15.00
What was the value of inventory on January 31?
What was the cost of goods sold for January?
Complete the following table:
Specific
Identification
FIFO
LIFO
Weighted
Average
Cost of Goods Sold
Inventory
HANDOUT 7–1 SOLUTION
INVENTORY COSTING METHODS
Quickie Grocery acquired the following five bottles of Corporate-Cola soft drink:
Date
Jan. 2
Jan. 10
Jan. 12
Jan. 16
Jan. 25
Cost
$1.00
$2.00
$3.00
$4.00
$5.00
A January 31 inventory count revealed that two bottles remained on the shelf.
How many bottles were sold in January?
5 – 2 = 3 bottles
Specific Identification
The Quickie Grocery keeps track of each individual bottle. Suppose the Grocery knows that it sold the
bottles acquired on Jan. 2, 12, and 16.
Date
Jan. 2
Jan. 10
Jan. 12
Jan. 16
Jan. 25
Cost
$1.00
$2.00
$3.00
$4.00
$5.00
$15.00
COGS
$1.00
$3.00
$4.00
$8.00
Inventory
$2.00
$5.00
$7.00
What was the cost of goods sold for January?
$8.00
What was the value of inventory on January 31?
$7.00
First-in, First-out (FIFO)
Date
Jan. 2
Jan. 10
Jan. 12
Jan. 16
Jan. 25
Cost
$1.00
$2.00
$3.00
$4.00
$5.00
$15.00
COGS
$1.00
$2.00
$3.00
$6.00
Inventory
$4.00
$5.00
$9.00
What was the cost of goods sold for January?
$6.00
What was the value of inventory on January 31?
$9.00
HANDOUT 7–1 SOLUTION, CONTINUED
Last-in, First-out (LIFO)
Assume that the last bottles purchased were the first to be sold. First bottles are still here.
Date
Jan. 2
Jan. 10
Jan. 12
Jan. 16
Jan. 25
Cost
$1.00
$2.00
$3.00
$4.00
$5.00
$15.00
COGS
$3.00
$4.00
$5.00
$12.00
Inventory
$1.00
$2.00
$3.00
What was the cost of goods sold for January?
$12.00
What was the value of inventory on January 31?
$3.00
Weighted Average
Date
Jan. 2
Jan. 10
Jan. 12
Jan. 16
Jan. 25
Cost
$1.00
$2.00
$3.00
$4.00
$5.00
$15.00
What was the cost of goods sold for January?
$15.00 / 5 = $3.00 average cost per unit
$3 × 3 units = $9.00
What was the value of inventory on January 31?
$15.00 / 5 = $3.00 average cost per unit
$3 × 2 units= $6.00
Complete the following table:
Specific
Identification
FIFO
LIFO
Weighted
Average
Cost of Goods Sold
8
6
12
9
Inventory
7
9
3
6
HANDOUT 7–2
LOWER OF COST OR MARKET (LCM)
Amanda Corporation is preparing its financial statements for the year ending December 31, 2013. Ending
inventory information about the three major items stocked for regular sale follows:
Item
Quantity on Hand
Unit Cost When Acquired (FIFO)
Replacement Cost
(Market) at Year-End
AA
100
$ 30
$ 26
BB
150
80
80
CC
200
100
104
Compute the valuation that should be used for the ending inventory using the LCM rule applied on an
item-by-item basis.
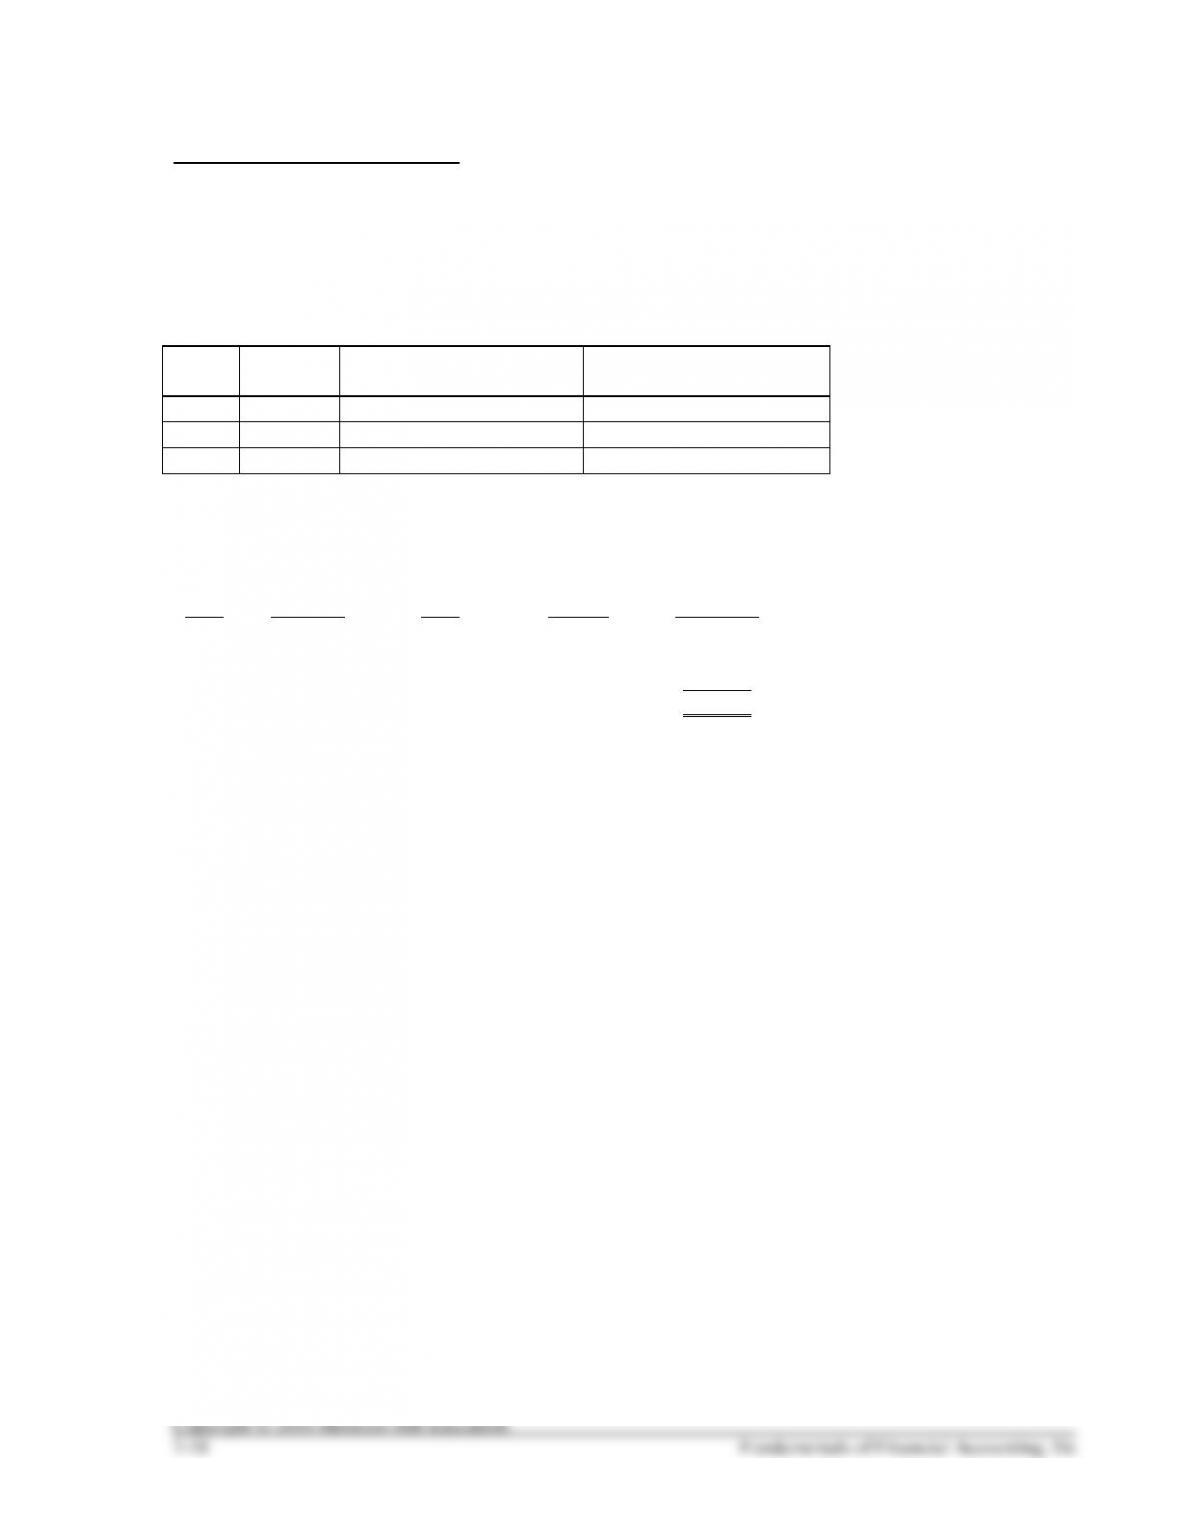
HANDOUT 7–2 SOLUTION
LOWER OF COST OR MARKET (LCM)
Amanda Corporation is preparing its financial statements for the year ending December 31, 2013. Ending
inventory information about the three major items stocked for regular sale follows:
Item
Quantity
on Hand
Unit Cost When Acquired
(FIFO)
Replacement Cost
(Market) at Year-End
AA
100
$ 30
$ 26
BB
150
80
80
CC
200
100
104
Compute the valuation that should be used for the ending inventory using the LCM rule applied on an
item-by-item basis.
Item
Quantity
Total
Cost
Total
Market
LCM
Valuation
AA
100
$ 3,000 (1)
$ 2,600 (2)
$ 2,600
BB
150
12,000 (3)
12,000 (3)
12,000
CC
200
20,000 (4)
20,800 (5)
20,000
$34,600
Calculations:
(1) 100 units @ $30 per unit = $3,000
(2) 100 units @ $26 per unit = $2,600
(3) 150 units @ $80 per unit = $12,000
(4) 200 units @ $100 per unit = $20,000
(5) 200 units @ $104 per unit = $20,800