CHAPTER 7
INVENTORY AND COST OF GOODS SOLD
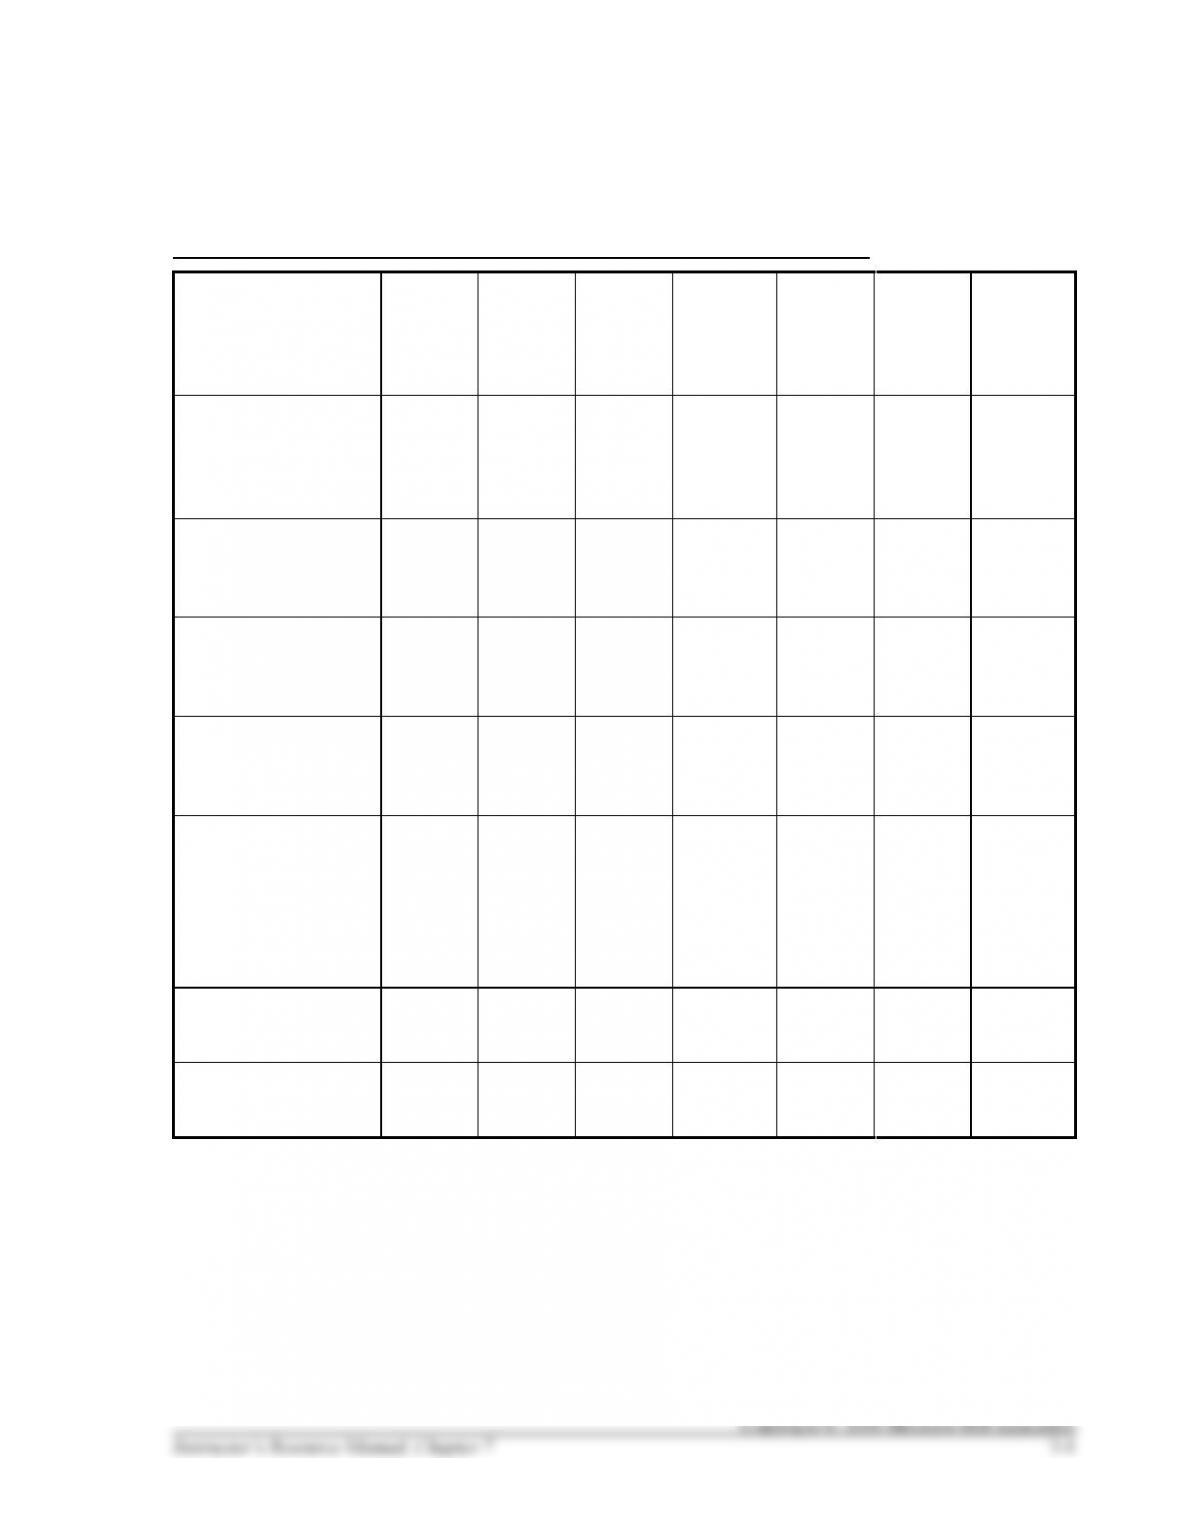
Student Learning Objectives and Related Assignment Materials
Student Learning
Objectives
Mini–
Exercises
Exercises
Coached
Problems
Problems
(Groups
A & B)
Compre–
hensive
Problems
Skills
Develop–
ment
Cases
Continuing
Cases
LO 7-1 Describe the
issues in
managing
different types of
inventory.
1, 2
1, 2, 3
3
LO 7-2 Explain how
to report
inventory and cost
of goods sold.
3
2, 3, 14
1, 2, 3, 4
LO 7-3 Compute
costs using four
inventory costing
methods.
4, 5, 6*,
7*, 8
4, 5*, 6,
7, 8, 9,
14
1
A1, B1
1+, 2^+
3, 5, 6
1†, 2^£
LO 7-4 Report
inventory at the
lower of cost or
market.
9, 10
2, 3,
10*, 11,
12
2
A2, B2
1, 2, 3,
4, 7
2^£
LO 7-5 Evaluate
inventory
management by
computing and
interpreting the
inventory
turnover ratio.
11, 12^,
13
13*, 14
3
A3, B3
2^+, 3
1, 2, 3
1†
LO 7-S1 Compute
inventory costs in
perpetual systems.
14, 15
15, 16
4
A4, B4
LO 7-S2 Determine
the effects of
inventory errors.
16, 17
17
5
A5, B5
* Animated solution included in the PowerPoint Slides.
(Table footnotes are continued on next page.)

Student Learning Objectives and Related Assignment Materials, continued
^ Particularly challenging; requires students to combine multiple concepts in order to advance to the
next level of accounting knowledge.
+ The Comprehensive Problems are comprised of CP7-1, which also covers LO 2-5, CP7-2, which also
covers LO 4-2, and CP7-3, which also covers LO 6-5.
† Continuing Case 7-1 builds on the story of Nicole’s Getaway Spa, introduced in earlier chapters. This
case focuses on explaining how the transportation cost included in each purchase should be recorded,
computing the cost of goods available for sale, cost of goods sold, and cost of ending inventory using
the FIFO method, calculating and interpreting the inventory turnover ratio, and explaining how a
different inventory cost flow assumption would allow Nicole’s Getaway Spa to better minimize its
income tax. The case will be extended in future chapters.
£ Continuing Case 7-2 builds on the story of Wiki Art Gallery (WAG), an instructional case in Connect.
This case focuses on determining the inventory costing method used, the cost of artwork included in
ending inventory, the cost of artwork sold, and reporting inventory at the lower of cost or market. The
case will be extended in future chapters.
Overview
We outline the key inventory management issues facing this retailer, demonstrate its accounting practices,
and use accounting information to analyze its inventory management performance.
Students learn how to apply the various inventory costing, valuation, and recording methods. Inventory
costing is demonstrated with examples where purchases precede sales (akin to a periodic system).
Synopsis of Chapter Revisions
• Removed journal entries for inventory purchases (now in Chapter 6) to accompany inventory sales in
that chapter
• Updated focus company illustrations
• New Spotlight on Financial Reporting discussing the LCM write-down at Lululemon for its see-
through yoga pants fiasco
• Updated inventory turnover analysis in Exhibit 7.7, involving Harley-Davidson, McDonalds, and
American Eagle
• New Spotlight on Financial Reporting to tie inventory turnover and gross profit to LCM
• Updated demonstration case featuring Oakley and Sunglass Hut
• Reviewed, updated, and introduced new end-of-chapter material, including new problem formats that
automatically post journal entries to T-accounts and prepare trial balances
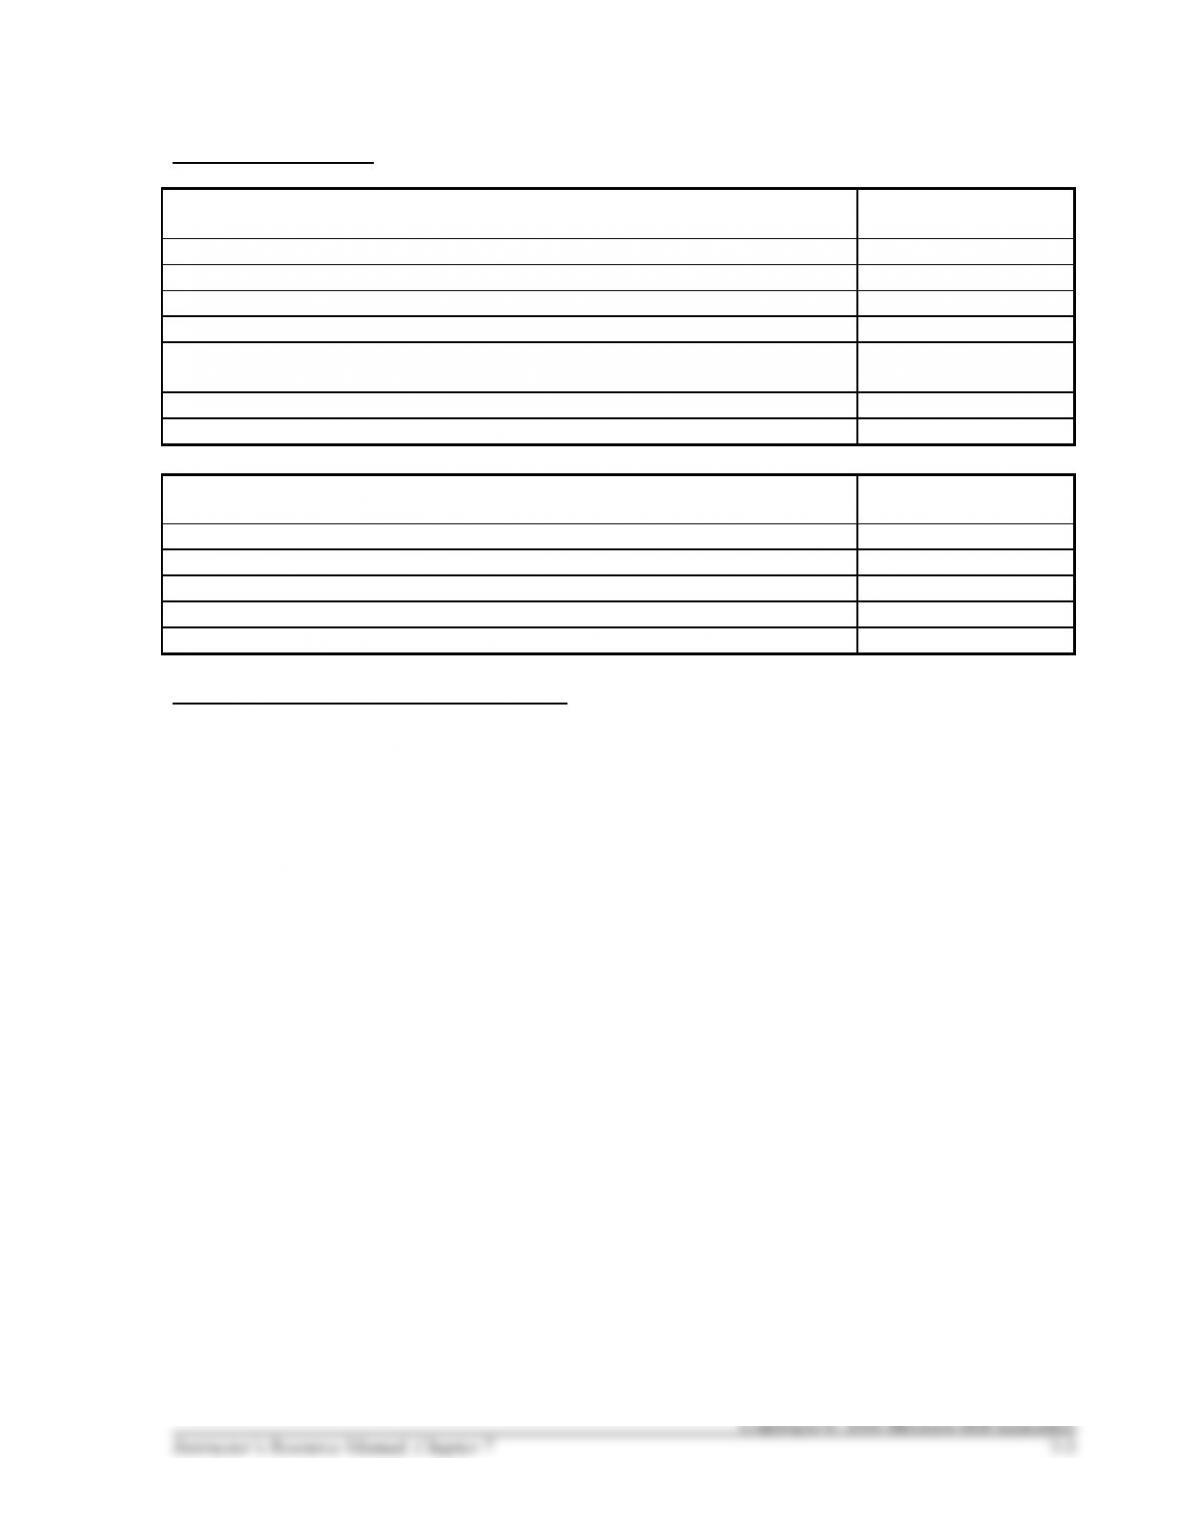
PowerPoint Slides
Student Learning Objective
PowerPoint® Slides
LO 7-1 Describe the issues in managing different types of inventory.
7-2 through 7-4
LO 7-2 Explain how to report inventory and cost of goods sold.
7-5 through 7-8
LO 7-3 Compute costs using four inventory costing methods.
7-9 through 7-20
LO 7-4 Report inventory at the lower of cost or market.
7-21 through 7-24
LO 7-5 Evaluate inventory management by computing and interpreting the
inventory turnover ratio.
7-25 through 7-27
LO 7-S1 Compute inventory costs in perpetual systems.
7-28 through 7-34
LO 7-S2 Determine the effects of inventory errors.
7-35 through 7-38
Animated Builds and Animated Solutions
PowerPoint® Slides
Mini-Exercise 7-6
7-40 through 7-44
Mini-Exercise 7-7
7-45 through 7-48
Exercise 7-5
7-49 through 7-53
Exercise 7-10
7-54 through 7-55
Exercise 7-13
7-56 through 7-57
Summary of Related Video Program
Spotlight Video Series
Chapter 7 – Dodging Bullets (approximately 4:00)
This video covers the lower of cost or market concept. Body armor made by DHB Industries in 2004-05
for the U.S. Marines and local police departments did not meet quality standards. Knowing the impact of
an inventory write-down, DHB tried to conceal its problems. By telling these events, this video invites
students to consider how fraudulent actions may put innocent people in harm’s way.

Chapter Summary
LO 7-1 Describe the issues in managing different types of inventory.
• Make or buy a sufficient quantity of quality products, at the lowest possible cost, so that they can
be sold as quickly as possible to earn the desired amount of gross profit.
• Merchandise inventory is bought by merchandisers in a ready-to-sell format. When raw materials
enter a manufacturer’s production process, they become work in process inventory, which is
further transformed into finished goods that are ultimately sold to customers.
LO 7-2 Explain how to report inventory and cost of goods sold.
• The costs of goods purchased are added to Inventory (on the balance sheet).
• The cost of goods sold are removed from Inventory and reported as an expense called Cost of
Goods Sold (on the income statement).
• The costs remaining in Inventory at the end of a period become the cost of Inventory at the
beginning of the next period.
• The relationships among beginning inventory (BI), purchases (P), ending inventory (EI), and cost
of goods sold (CGS) are: BI + P – EI = CGS or BI + P – CGS = EI.
LO 7-3 Compute costs using four inventory costing methods.
• Under GAAP, any of four generally accepted methods can be used to allocate the cost of inventory
available for sale between goods that are sold and goods that remain on hand at the end of the
accounting period.
• Specific identification assigns costs to ending inventory and cost of goods sold by tracking and
identifying each specific item of inventory.
• Under FIFO, the costs first in are assigned to cost of goods sold and the costs last in (most recent)
are assigned to the inventory that is still on hand in ending inventory.
• Under LIFO, the costs last in are assigned to cost of goods sold and the costs first in (oldest) are
assigned to the inventory that is still on hand in ending inventory.
• Under weighted average cost, the weighted average cost per unit of inventory is assigned equally
to goods sold and those still on hand in ending inventory.
LO 7-4 Report inventory at the lower of cost or market.
• The LCM rule ensures inventory assets are not reported at more than they are worth.
LO 7-5 Evaluate inventory management by computing and interpreting the inventory turnover
ratio.
• The inventory turnover ratio measures the efficiency of inventory management. It reflects how
many times average inventory was acquired and sold during the period. The inventory turnover
ratio is calculated by dividing Cost of Goods Sold by Average Inventory.
Accounting Decision Tools
1. Inventory Turnover Ratio = Cost of Goods Sold ÷ Average Inventory
• It tells you the number of times inventory turns over during the period.
• A higher ratio means faster turnover.
2. Days to Sell = 365 ÷ Inventory Turnover Ratio
• It tells you the average number of days from purchase to sale.
• A higher number means a longer time to sell.
Chapter Outline
Teaching Notes
I. Understand the Business
LO 7-1 Describe the issues in managing different types of inventory.
A. Inventory Management Decisions
1. The primary goals of inventory managers are to (1)
maintain a sufficient quantity of inventory to meet
customers’ needs and (2) ensure inventory quality meets
customers’ expectations and company standards
a. Maintain a sufficient quantity of inventory to meet
customers’ needs.
b. Ensure inventory quality meets customers’
expectations and company standards.
2. At the same time, managers try to (3) minimize the cost
of acquiring and carrying inventory (including costs
related to purchasing, production, storage, spoilage, theft,
obsolescence, and financing).
3. Tricky to manage; as one factor changes so do the others.
B. Types of Inventory
1. Merchandisers hold merchandise inventory, which
consists of products acquired in a finished condition,
ready for sale without further processing.
2. Manufacturers often hold three types of inventory, with
each representing a different stage in the manufacturing
process.
a. They start with raw materials inventory such as
plastic, steel, or fabrics.
b. When these raw materials enter the production
process, they become part of work in process
inventory, which includes goods that are in the process
of being manufactured.
c. When completed, work in process inventory becomes
finished goods inventory, which is ready for sale just
like merchandise inventory.
3. Consignment inventory refers to goods a company is
holding on behalf of the goods’ owner.
a. Typically, this arises when a company is willing to sell
the goods for the owner (for a fee) but does not want
to take ownership of the goods in the event the goods
are difficult to sell.
b. Consignment inventory is reported on the balance
sheet of the owner, not the company holding the
inventory.
Chapter Outline
Teaching Notes
4. Goods in transit are inventory items being transported.
This type of inventory is reported on the balance sheet of
the owner, not the company transporting it.
a. If a sale is made FOB destination, the goods belong to
the seller until they are delivered to the customer.
b. If a sale is made FOB shipping point, inventory
belongs to the customer at the moment it leaves the
seller’s premises.
II. Study the Accounting Methods
LO 7-2 Explain how to report inventory and cost of goods sold.
A. Balance Sheet and Income Statement Reporting
1. Inventory is reported on the balance sheet as a current
asset.
Illustrated in Exhibit 7.1
2. Goods placed in inventory are initially recorded at cost,
which is the amount paid to acquire the asset and prepare
it for sale.
3. When goods are sold, their cost is removed from the
inventory account and reported on the income statement
as an expense called Cost of Goods Sold.
Illustrated in Exhibit 7.2
4. Gross Profit = Net Sales – Cost of Goods Sold.
5. The balance sheet account Inventory is related to the
income statement account Cost of Goods Sold through
the cost of goods sold equation.
6. Cost of goods equation can take one of two forms,
depending on whether the inventory costs are updated
periodically at year-end (or month-end) when inventory is
counted or perpetually each time inventory is sold.
a. Periodic Updating:
Beginning Inventory + Purchases – Ending Inventory
= Cost of Goods Sold
Illustrated in Exhibit 7.3
b. Perpetual Updating:
Beginning Inventory + Purchases – Cost of Goods
Sold = Ending Inventory
Illustrated in Exhibit 7.3
LO 7-3 Compute costs using four inventory costing methods.
B. Inventory Costing Methods
1. Four generally accepted inventory costing methods are
available for determining the cost of goods sold (and the
cost of goods remaining in ending inventory):
❖ Video Program #7
a. Specific identification
b. First-in, first-out (FIFO)
c. Last-in, first-out (LIFO)
d. Weighted average
Note that the chapter
assumes a periodic inventory
system; a perpetual inventory
system is covered in
2. These four methods are alternative ways for splitting the
total dollar amount of goods available for sale between
(1) ending inventory and (2) cost of goods sold.
Supplement 7A.

Chapter Outline
Teaching Notes
3. Method chose does not have to correspond to the physical
flow of goods, so any one of these four methods is
considered GAAP.
4. Specific identification––The inventory costing method
that identifies the cost of the specific item that was sold;
this method requires keeping track of the purchase cost of
each item; this method tends to be used only when
dealing with individually expensive and unique items.
✓ Supplement Enrichment
Activity (Activity) #1
5. Cost Flow Assumptions
a. Most companies use one of the three other cost flow
methods.
b. Under these cost flow assumptions, inventory costs are
not based on the actual physical flow of goods on and
off the shelves. Rather, they are based on assumptions
that accountants make about the flow of inventory
costs.
Cost flow assumptions and
financial statement effects
illustrated in Exhibit 7.4
c. Although they although they’re called “inventory”
costing methods, their names actually describe how to
calculate the cost of goods sold.
C. First-In, First-Out (FIFO) Method
1. FIFO (First-in, first-out)––Assumes that the oldest
goods (the first in to inventory) are the first ones sold (the
first out of inventory).
✓ Activity #1
2. To calculate the cost of the units sold, use the costs of the
first-in (oldest) goods.
3. The costs of any remaining units are reported as ending
inventory.
4. The costs of the newer goods are included in the cost of
the ending inventory.
D. Last-In, First-Out (LIFO) Method
✓ Activity #1
1. LIFO (Last-in, first-out)––Assumes that the newest
goods (the last in to inventory) are the first ones sold.
2. To calculate the cost of the units sold, use the costs of the
last-in (newest) goods.
3. The costs of the older goods are included in the cost of
the ending inventory.
E. Weighted Average Cost Method
✓ Activity #1
1. Weighted average cost––Uses the weighted average of
the costs of goods available for sale for both the cost of
each item sold and those remaining in inventory.
Stress that the weighted
average cost usually differs
from a simple average cost.
2. The first step is to calculate the total cost of the goods
available for sale.
An example is the calculation
of a student’s GPA.
3. Then, the weighted average unit cost of goods available
for sale is calculated; weighted average unit cost equals
cost of goods available for sale divided by number of
units available for sale.

Chapter Outline
Teaching Notes
4. Weighted average unit cost is then used to assign a dollar
amount to cost of goods sold and to ending inventory.
F. Financial Statement Effects
1. The FIFO, LIFO, and weighted average costing methods
differ only in how they split the cost of goods available
for sale between ending inventory and cost of goods sold.
Effects summarized in
Exhibit 7.5
a. If a cost goes into ending inventory, it doesn’t go into
cost of goods sold.
b. For that reason, the method that gives the highest
dollar amount to ending inventory also gives the
lowest to cost of goods sold.
2. When costs are rising, FIFO leads to a higher inventory
value (making the balance sheet appear stronger) and a
lower cost of goods sold (resulting in a higher gross
profit, making the company look more profitable).
3. When costs are falling, the effects are reversed, with
FIFO giving the lowest ending inventory amount as well
as the highest cost of goods sold.
4. These are not “real” economic effects because the same
number of units is either sold or still on hand in ending
inventory.
G. Tax Implications and Cash Flow Effects
1. When faced with increasing costs per unit, a company
that uses FIFO will have a higher income tax expense.
2. This income tax effect is a real cost, in the sense that the
company will actually have to pay more income taxes in
the current year, thereby reducing the company’s cash.
H. Consistency in Reporting
1. A change in method is allowed only if it will improve the
accuracy with which financial results and financial
position are measured.
The “Spotlight on the World”
notes that LIFO is not
allowed under IFRS
2. Companies can, however, use different inventory
methods for different product lines of inventory, as long
as the methods are used consistently over time.
3. Tax rules also limit the methods that managers use. The
LIFO Conformity Rule requires that if LIFO is used on
the income tax return, it also must be used in financial
statement reporting.
Chapter Outline
Teaching Notes
LO 7-4 Report inventory at the lower of cost or market.
I. Reporting Inventory at Lower of Cost or Market
1. The value of inventory can fall below its recorded cost for
two reasons:
❖ Video Spotlight Chapter
7
a. It’s easily replaced by identical goods at a lower cost.
b. It’s become outdated or damaged.
2. Lower of cost or market (LCM)—A valuation rule that
requires the Inventory account to be reduced when the
value of the inventory falls to an amount less than its cost.
✓ Activity #2
3. LCM is based on the conservatism concept, which
ensures that inventory assets are not reported at more than
they are worth
4. When the market value of inventory is lower than the
recorded cost, the amount recorded for ending inventory
needs to be written down by debiting Cost of Goods Sold
and crediting Inventory.
The “Spotlight on Financial
Reporting” feature addresses
the impact of a LCM write-
down on stock prices
5. Most companies report the inventory write-down as cost
of goods sold even though the written-down goods may
not yet have been sold.
a. This reporting is appropriate because writing down
goods that haven’t yet sold is a necessary cost of
carrying the goods that did sell.
b. By recording the write-down in the period in which a
loss in value occurs, companies better match their
revenues and expenses of that period.
The “Spotlight on Ethics”
feature addresses a fraud
involving the failure to write-
III. Evaluate Inventory Management
down inventory
LO 7-5 Evaluate inventory management by computing and interpreting the inventory turnover ratio.
A. Inventory Turnover Analysis
1. Inventory turnover—The process of buying and selling
inventory.
Illustrated in Exhibit 7.6
a. Inventory turnover ratio equals Cost of Goods Sold
divided by Average Inventory.
b. The inventory turnover ratio measures the number of
times inventory turns over during the period.
c. A higher ratio means faster turnover; more efficient
purchasing and production techniques as well as high
product demand will boost this ratio.
d. Sudden decline may signal an unexpected drop in
demand for the company’s products or sloppy
inventory management.
2. Days to sell—A measure of the average number of days
from the time inventory is bought to the time it is sold.
a. Days to sell equals 365 divided by the year-long
inventory turnover ratio.
b. Days to sell measures average number of days from
purchase to sale.