PB6-5 (continued)
Req. 2
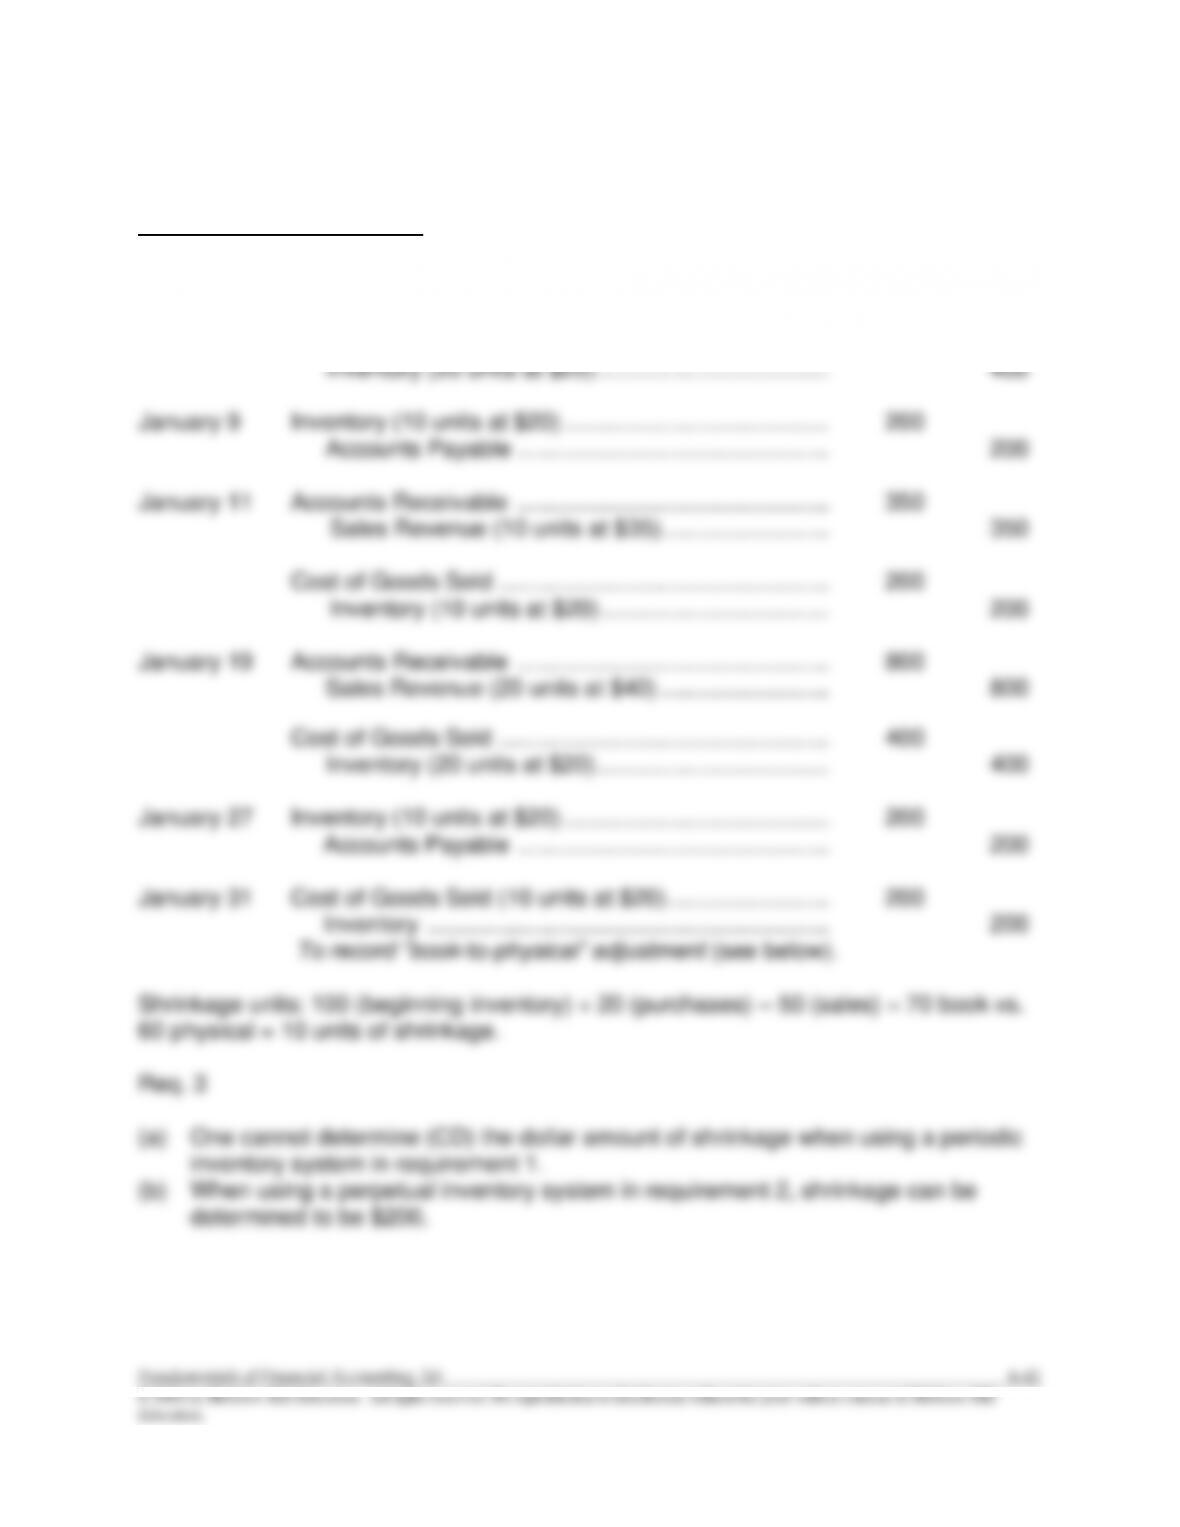
Perpetual inventory system:
January 6
Accounts Receivable …………………………………………………
600
Sales Revenue (20 units at $30) ……………………..……
600
Cost of Goods Sold ……………………………………………………
400
Inventory (20 units at $20) …………………………..….………
400
January 9
Inventory (10 units at $20) …………………………………..………
200
Accounts Payable …………………………………………………
200
January 11
Accounts Receivable …………………………………………………
350
Sales Revenue (10 units at $35)……………………..……
350
Cost of Goods Sold ……………………………………………………
200
Inventory (10 units at $20) ……………………………..………
200
January 19
Accounts Receivable …………………………………………………
800
Sales Revenue (20 units at $40) ……………………..……
800
Cost of Goods Sold ……………………………………………………
400
Inventory (20 units at $20) ………………………………………
400
January 27
Inventory (10 units at $20) …………………………………..………
200
Accounts Payable …………………………………………………
200
January 31
Cost of Goods Sold (10 units at $20) …………………….…….
200
Inventory ……………………………………………………....
200
6-42 Solutions Manual
© 2016 by McGraw-Hill Education. All rights reserved. No reproduction or distribution without the prior written consent of McGraw-Hill
Education.
ANSWERS TO COMPREHENSIVE PROBLEMS
C6-1
Req. 1
Oct. 1
BSS’s purchase order represents a promise to pay in the future and the
supplier has promised to deliver in the future; such an exchange of
promises does not qualify as an accounting transaction. Consequently,
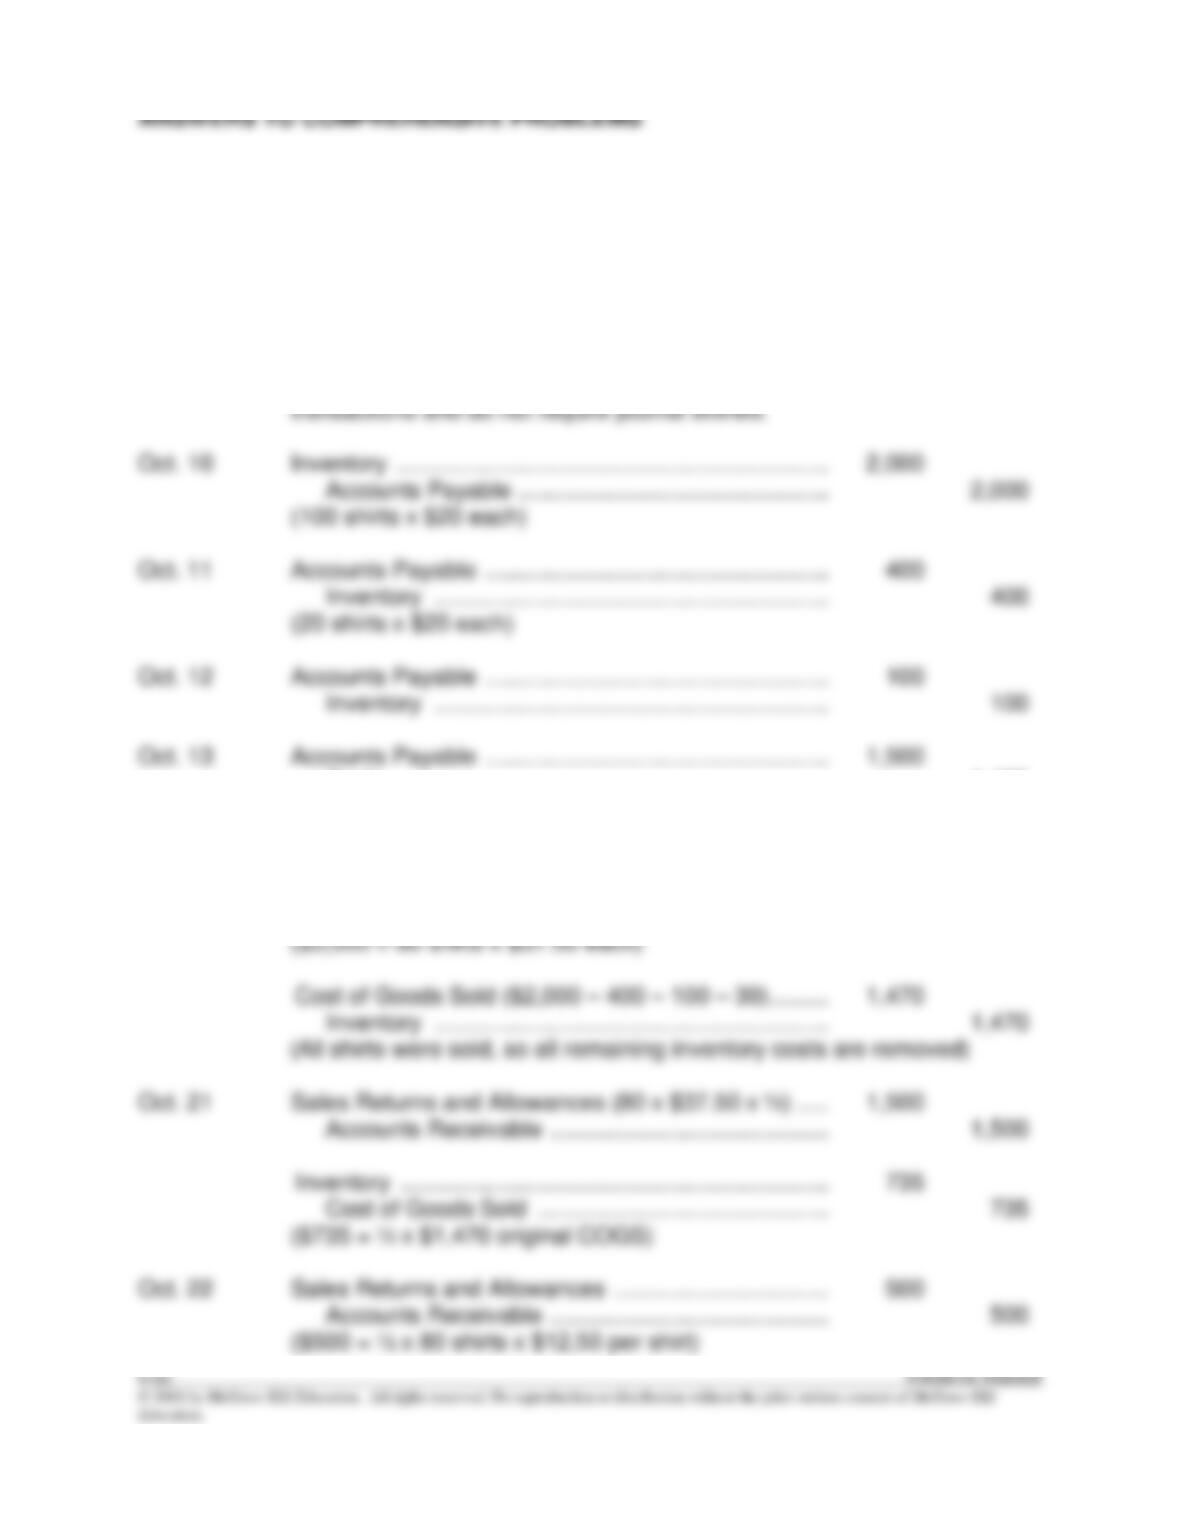
no journal entry is made on this date. Similarly, the sales orders to
students and faculty during the first week of October are not
transactions and do not require journal entries.
Oct. 10
Inventory ………………………………………………………….………
2,000
Accounts Payable …………………………………………………
2,000
(100 shirts x $20 each)
Oct. 11
Accounts Payable ……………………………………………..………
400
Inventory …………………………………………………….…
400
(20 shirts x $20 each)
Oct. 12
Accounts Payable ……………………………………………..………
100
Inventory …………………………………………………….…
100
Oct. 13
Accounts Payable ……………………………………………..………
1,500
Cash …………………………………………………………..………
1,470
Inventory …………………………………………………….…
30
($2,000 – $400 – $100 = $1,500 x 2% = $30)
Oct. 18
Accounts Receivable …………………………………………………
3,000
Sales Revenue …………………………………………….………
3,000
($3,000 = 80 shirts x $37.50 each)
Cost of Goods Sold ($2,000 – 400 – 100 – 30) ………………
1,470
Inventory …………………………………………………….…
1,470
Oct. 21
Sales Returns and Allowances (80 x $37.50 x ½) …..………
1,500
Accounts Receivable …………………………………….………
1,500
Inventory …………………………………………………………………
735
Cost of Goods Sold ………………………………………………
735
($735 = ½ x $1,470 original COGS)
Oct. 22
Sales Returns and Allowances …………………………...………
500
Accounts Receivable …………………………………….………
500
($500 = ½ x 80 shirts x $12.50 per shirt)
C6-1 (continued)
Req. 1 (continued)
Oct. 25
Cash ……………………………………………………………….………
980
Sales Discounts ………………………………………………..……..
20
Accounts Receivable …………………………………….………
1,000
($3,000 – $1,500 – $500 = $1,000 x 2% = $20)
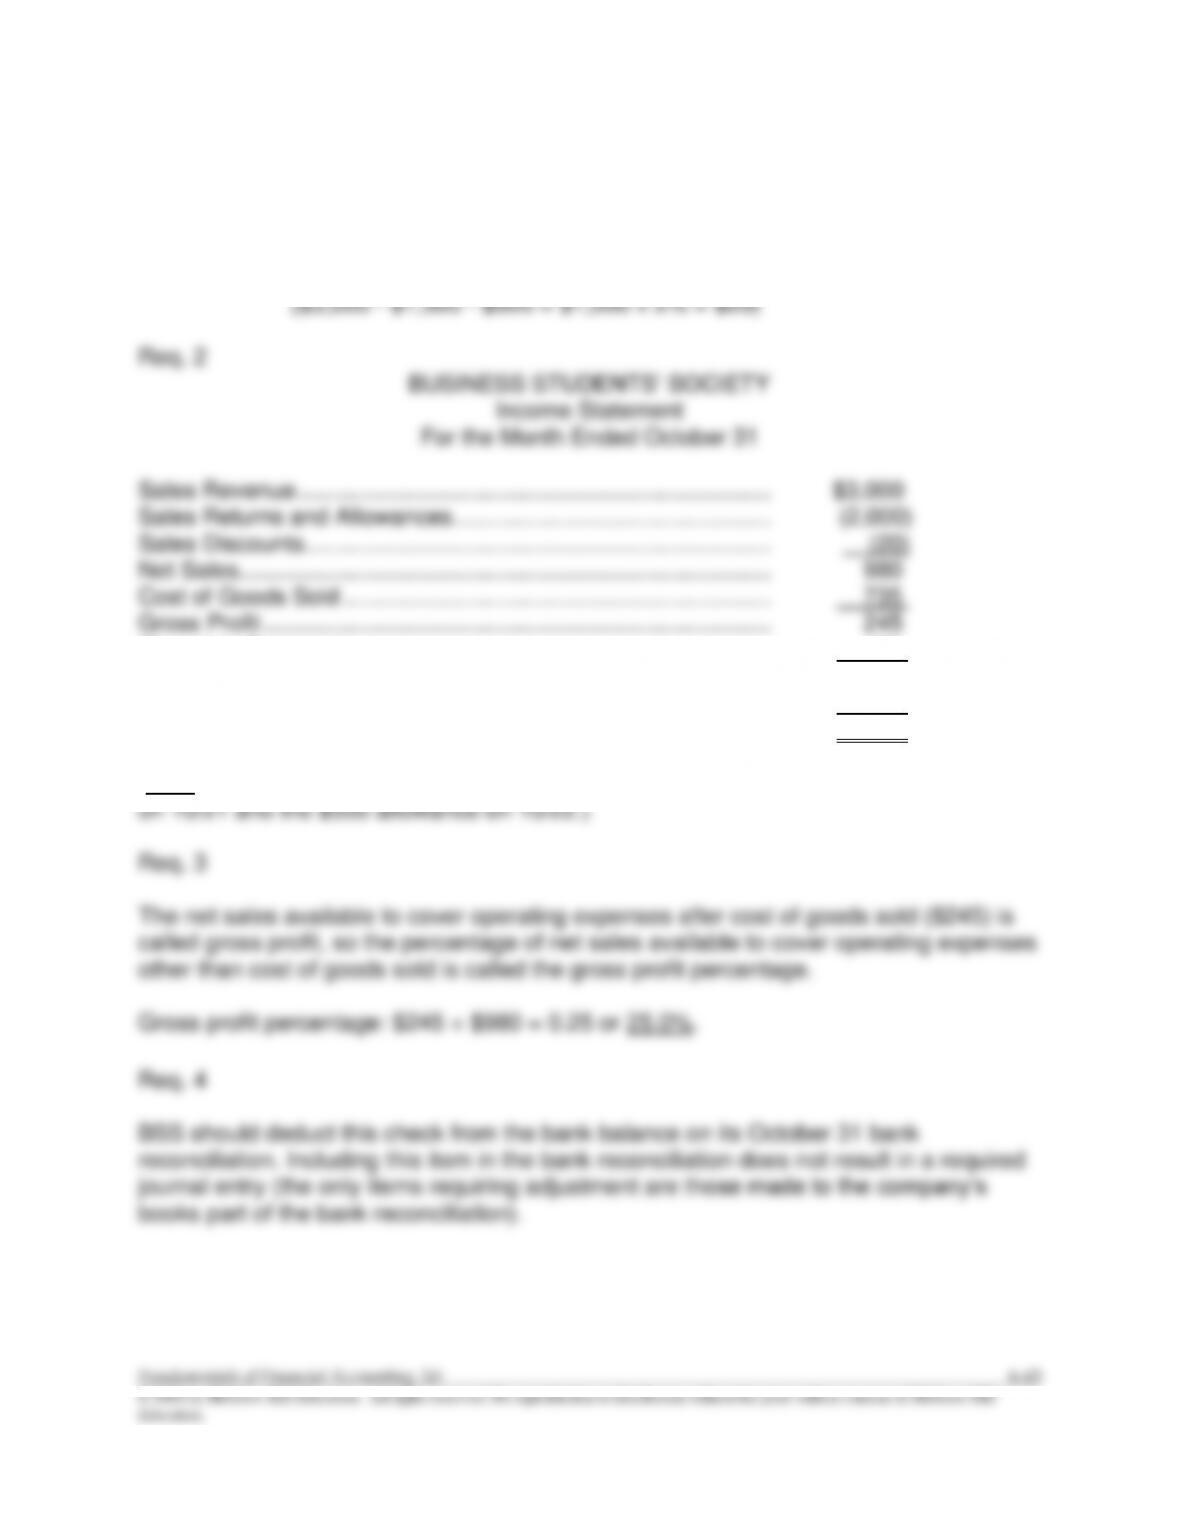
Operating Expenses ……………………………………………………….. 100
Income from Operations ………………………………………………….. 145
Income Tax Expense………………………………………………………. 45
Net Income ……………………………………………………………………. $ 100
(Note: The Sales Returns and Allowances balance of $2,000 includes the $1,500 return
S6–1
1. D
2. A
3. B
Calculations:
Req. 2
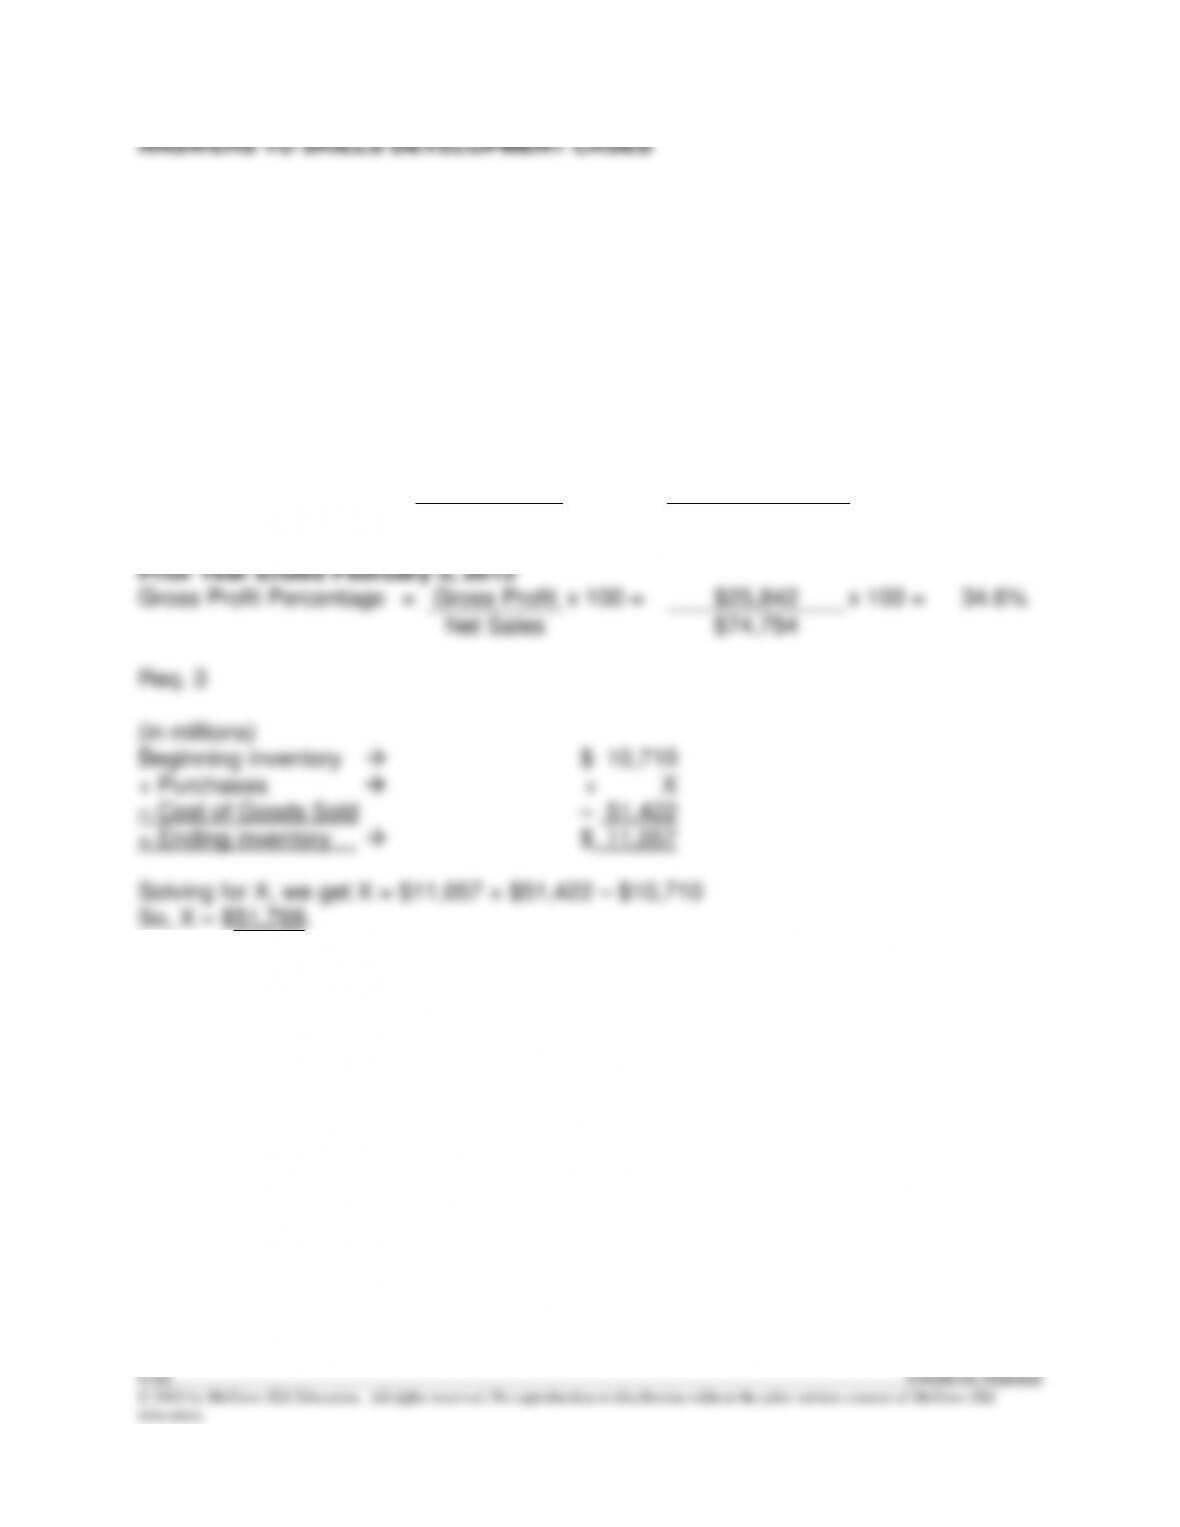
Current Year Ended February 2, 2014
Gross Profit Percentage
=
Gross Profit
x 100 =
$27,390
x 100 =
34.8%
Net Sales
$78,812
Gross Profit Percentage
=
Gross Profit
x 100 =
$25,842
x 100 =
34.6%
Net Sales
$74,754
S6–2
Req. 1
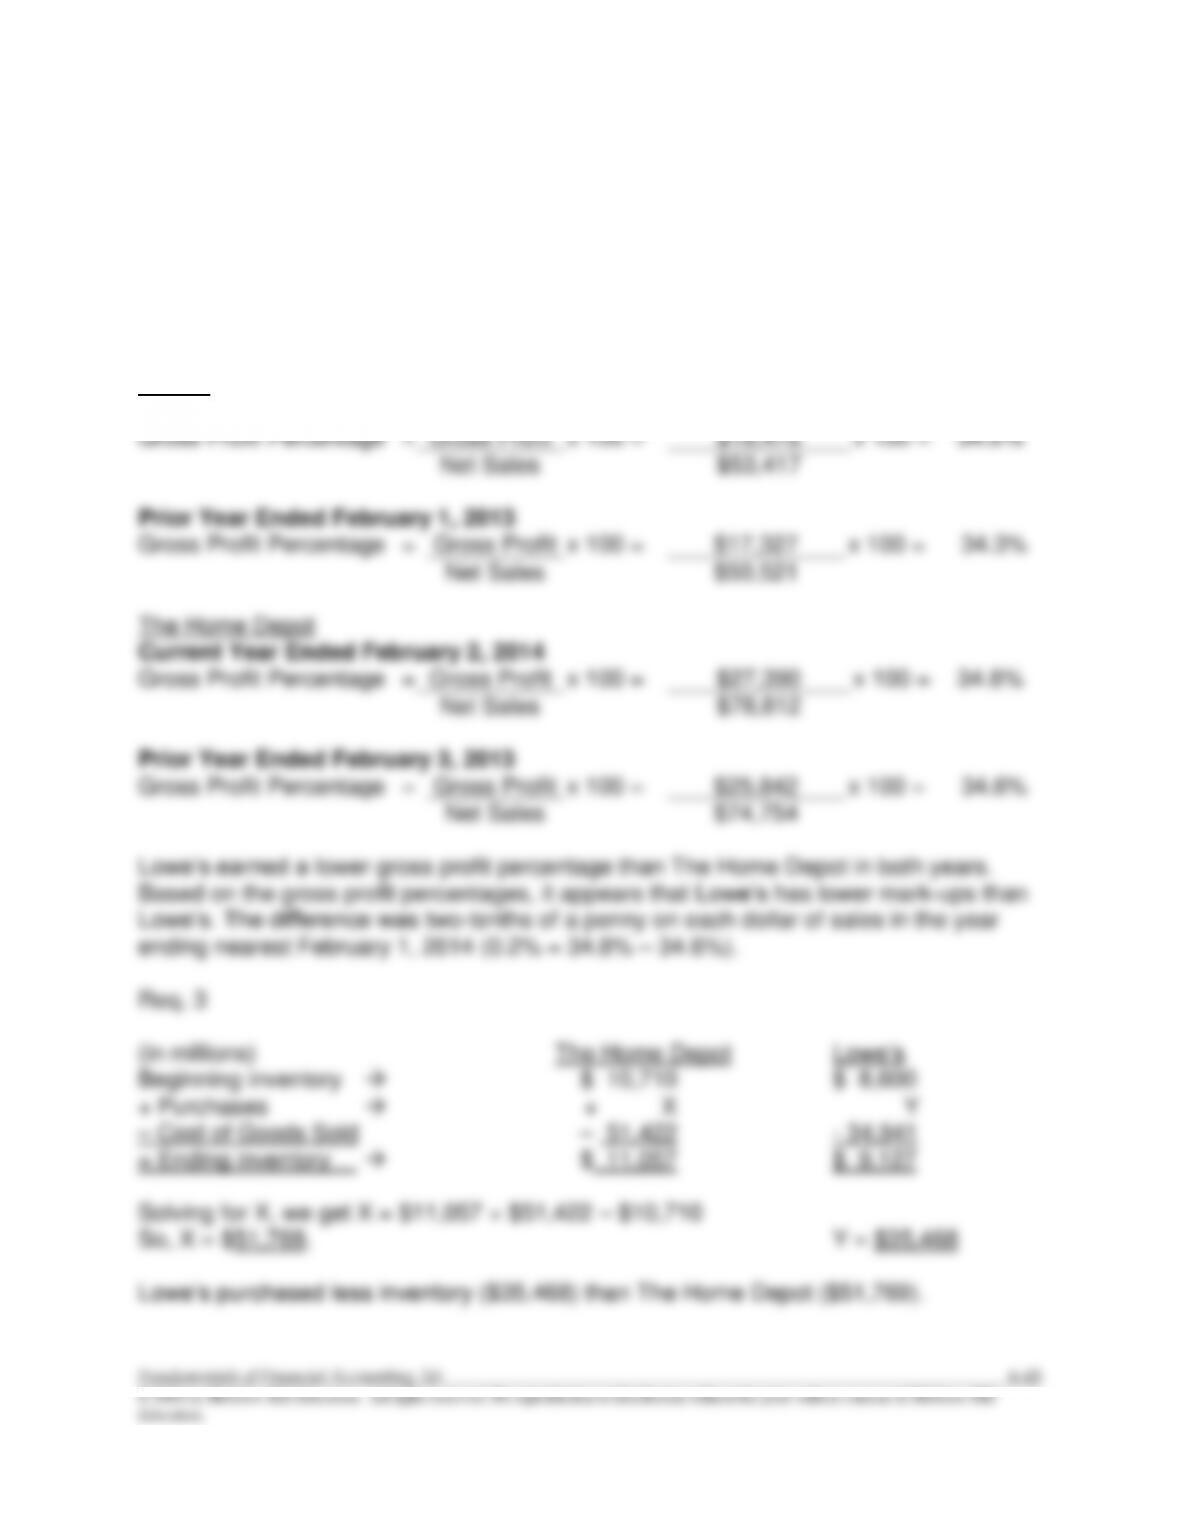
The Home Depot reported $78,812 million of Net Sales during the year ended February
2, 2014. Lowe’s reported $53,417 million of Net Sales for approximately the same
period (year ended January 31, 2014). Thus, Lowe’s reported lower Net Sales than The
Home Depot.
Req. 2
Lowe’s
Current Year Ended January 31, 2014
Gross Profit Percentage
=
Gross Profit
x 100 =
$18,476
x 100 =
34.6%
Net Sales
$53,417
Prior Year Ended February 1, 2013
Gross Profit Percentage
=
Gross Profit
x 100 =
$17,327
x 100 =
34.3%
Net Sales
$50,521
The Home Depot
Current Year Ended February 2, 2014
Gross Profit Percentage
=
Gross Profit
x 100 =
$27,390
x 100 =
34.8%
Net Sales
$78,812
Prior Year Ended February 3, 2013
Gross Profit Percentage
=
Gross Profit
x 100 =
$25,842
x 100 =
34.6%
Net Sales
$74,754
Lowe’s earned a lower gross profit percentage than The Home Depot in both years.
Based on the gross profit percentages, it appears that Lowe’s has lower mark-ups than
Lowe’s. The difference was two-tenths of a penny on each dollar of sales in the year
ending nearest February 1, 2014 (0.2% = 34.8% – 34.6%).
Req. 3
(in millions) The Home Depot Lowe’s
Beginning inventory → $ 10,710 $ 8,600
+ Purchases → + X Y
– Cost of Goods Sold – 51,422 – 34,941
= Ending inventory → $ 11,057 $ 9,127
Solving for X, we get X = $11,057 + $51,422 – $10,710
So, X = $51,769. Y = $35,468
Lowe’s purchased less inventory ($35,468) than The Home Depot ($51,769).
S6–3
S6–4
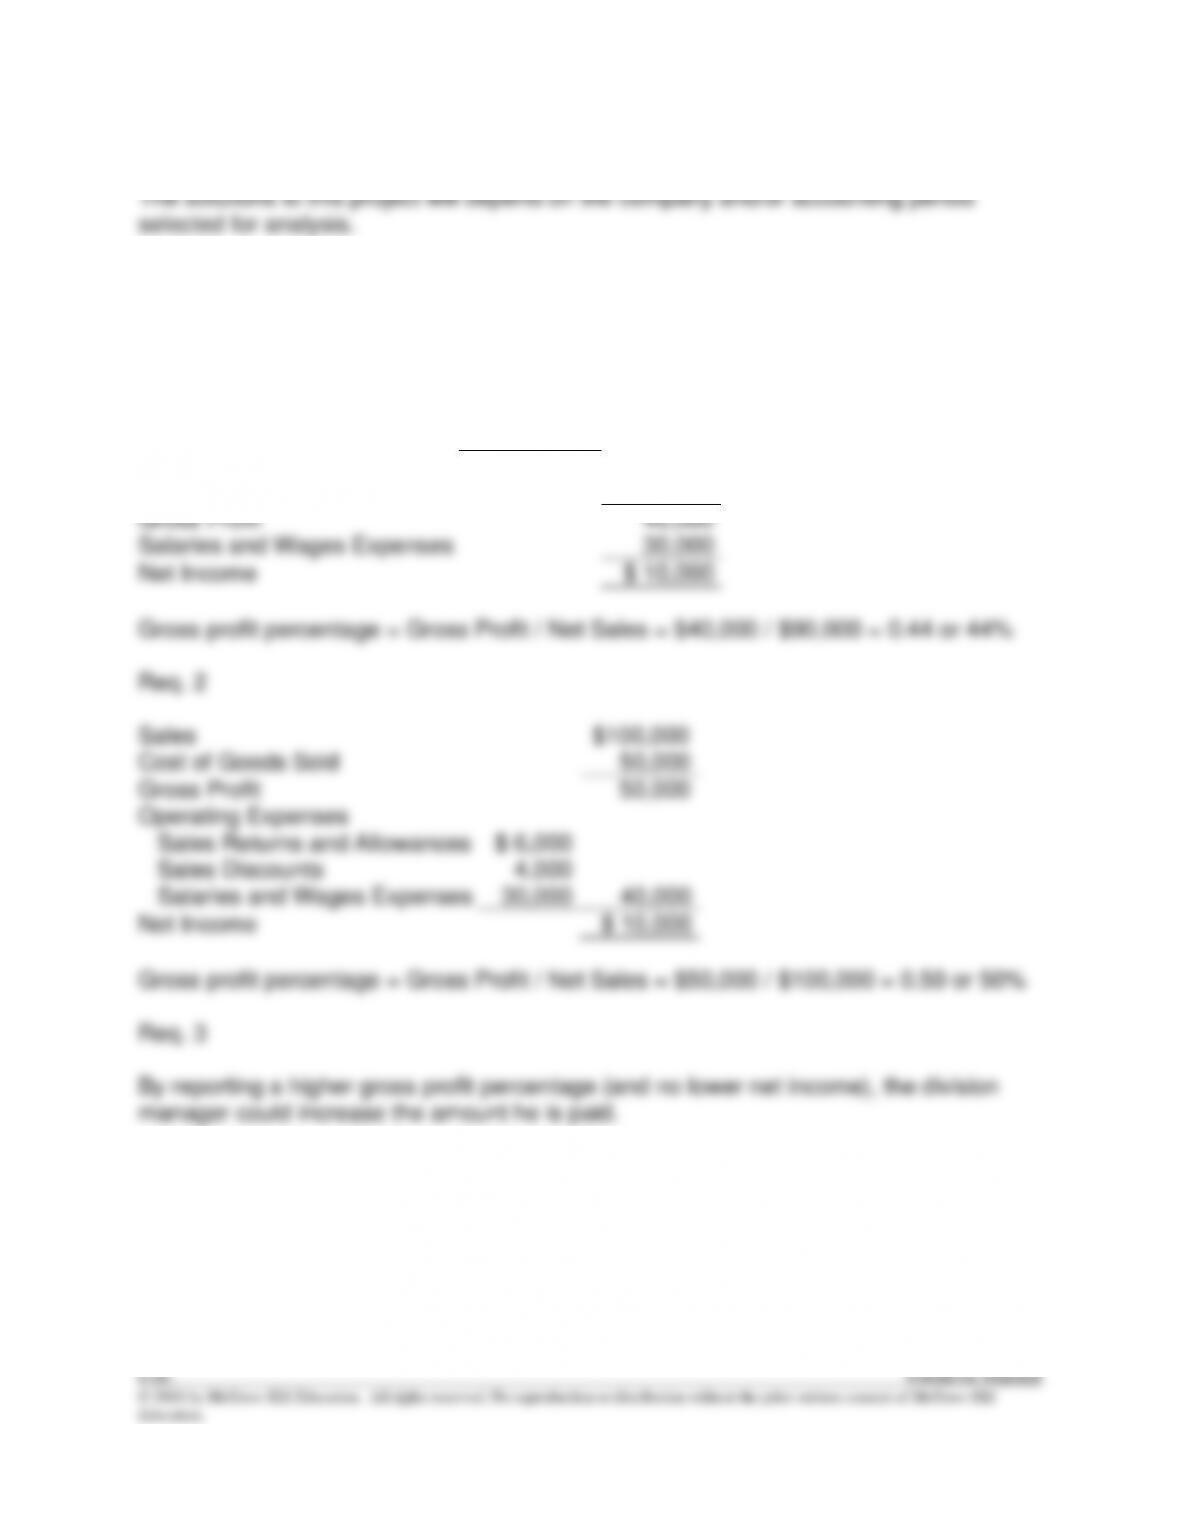
Req. 1
Sales
$ 100,000
Sales Returns and Allowances
(6,000)
Sales Discounts
(4,000)
Net Sales
$ 90,000
Cost of Goods Sold
50,000
Gross Profit
40,000
Salaries and Wages Expenses
30,000
Net Income
$ 10,000
Sales
$100,000
Cost of Goods Sold
50,000
Gross Profit
50,000
Operating Expenses
Sales Returns and Allowances
$ 6,000
Sales Discounts
4,000
Salaries and Wages Expenses
30,000
40,000
Net Income
$ 10,000
Gross profit percentage = Gross Profit / Net Sales = $50,000 / $100,000 = 0.50 or 50%
Req. 3
By reporting a higher gross profit percentage (and no lower net income), the division
manager could increase the amount he is paid.