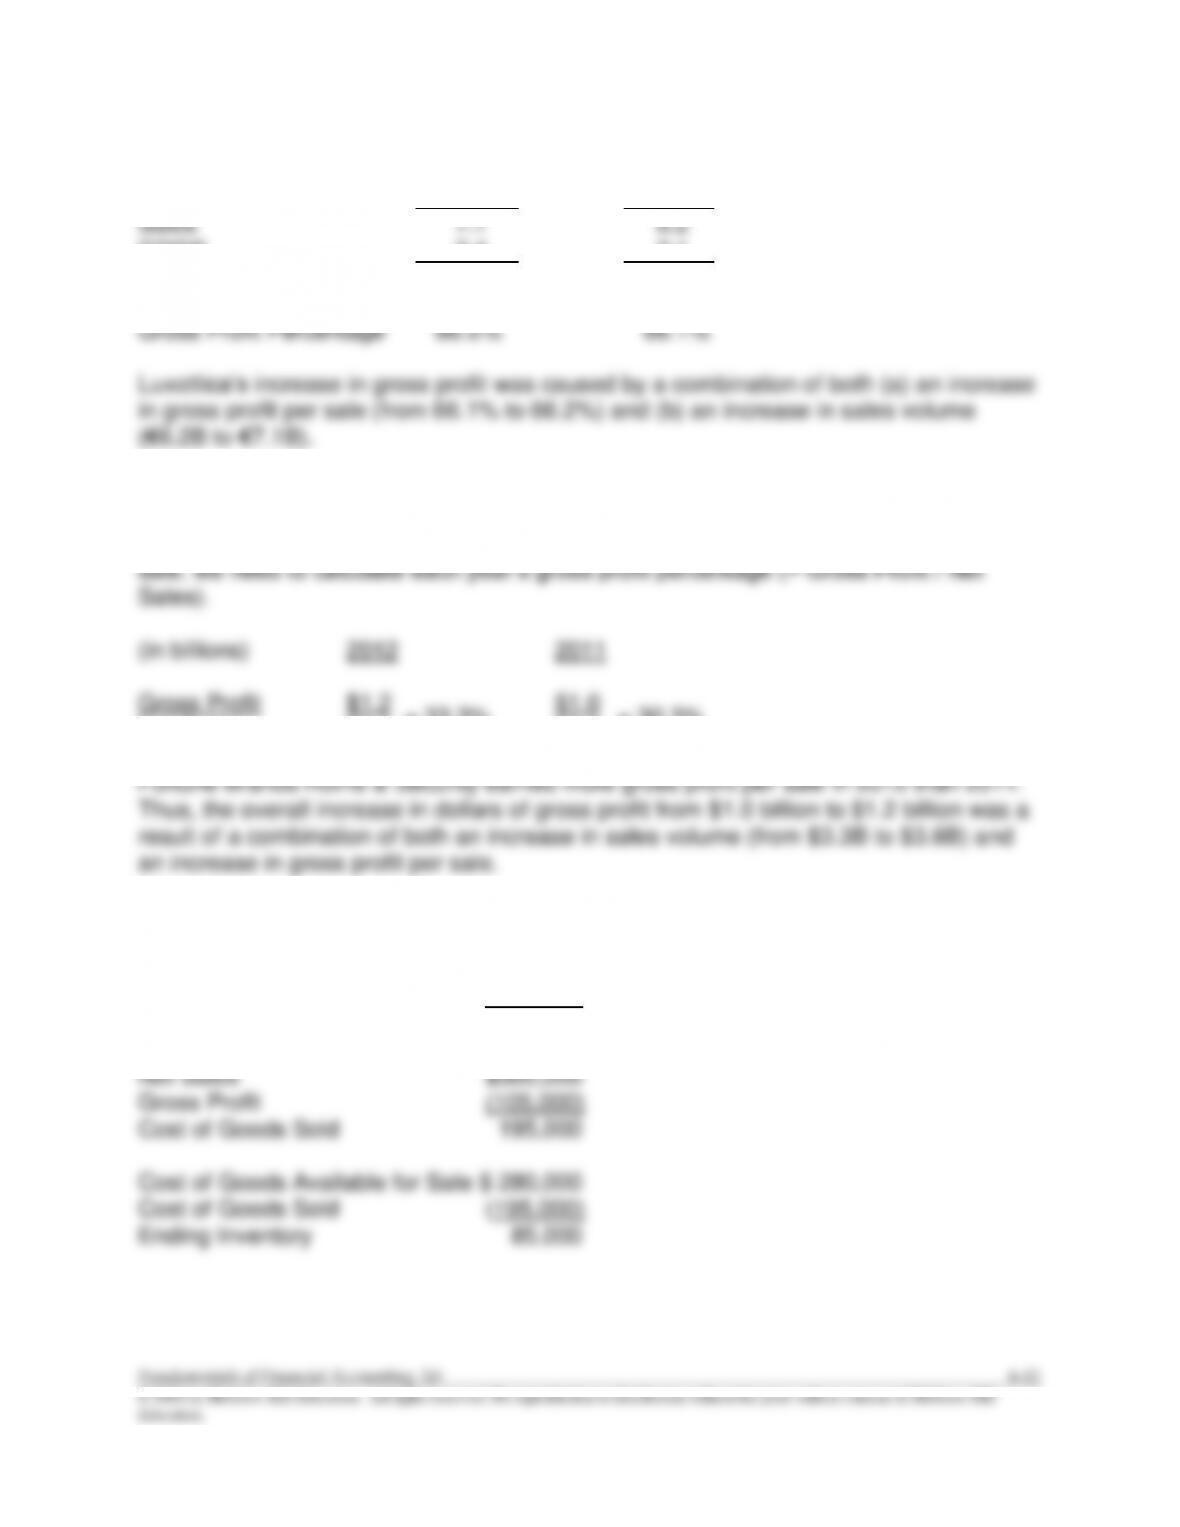
M6–16
(in billions of euro)
2012 2011
COGS 2.4 2.1
Gross Profit 4.7 4.1
M6–17
To determine whether Fortune Brands Home & Security earned more gross profit per
Net Sales $3.6 $3.3
M6–18
Net Sales $300,000
Gross Profit Percentage 35%
Gross Profit 105,000
= 33.3%
= 30.3%
6-12 Solutions Manual
© 2016 by McGraw-Hill Education. All rights reserved. No reproduction or distribution without the prior written consent of McGraw-Hill
Education.
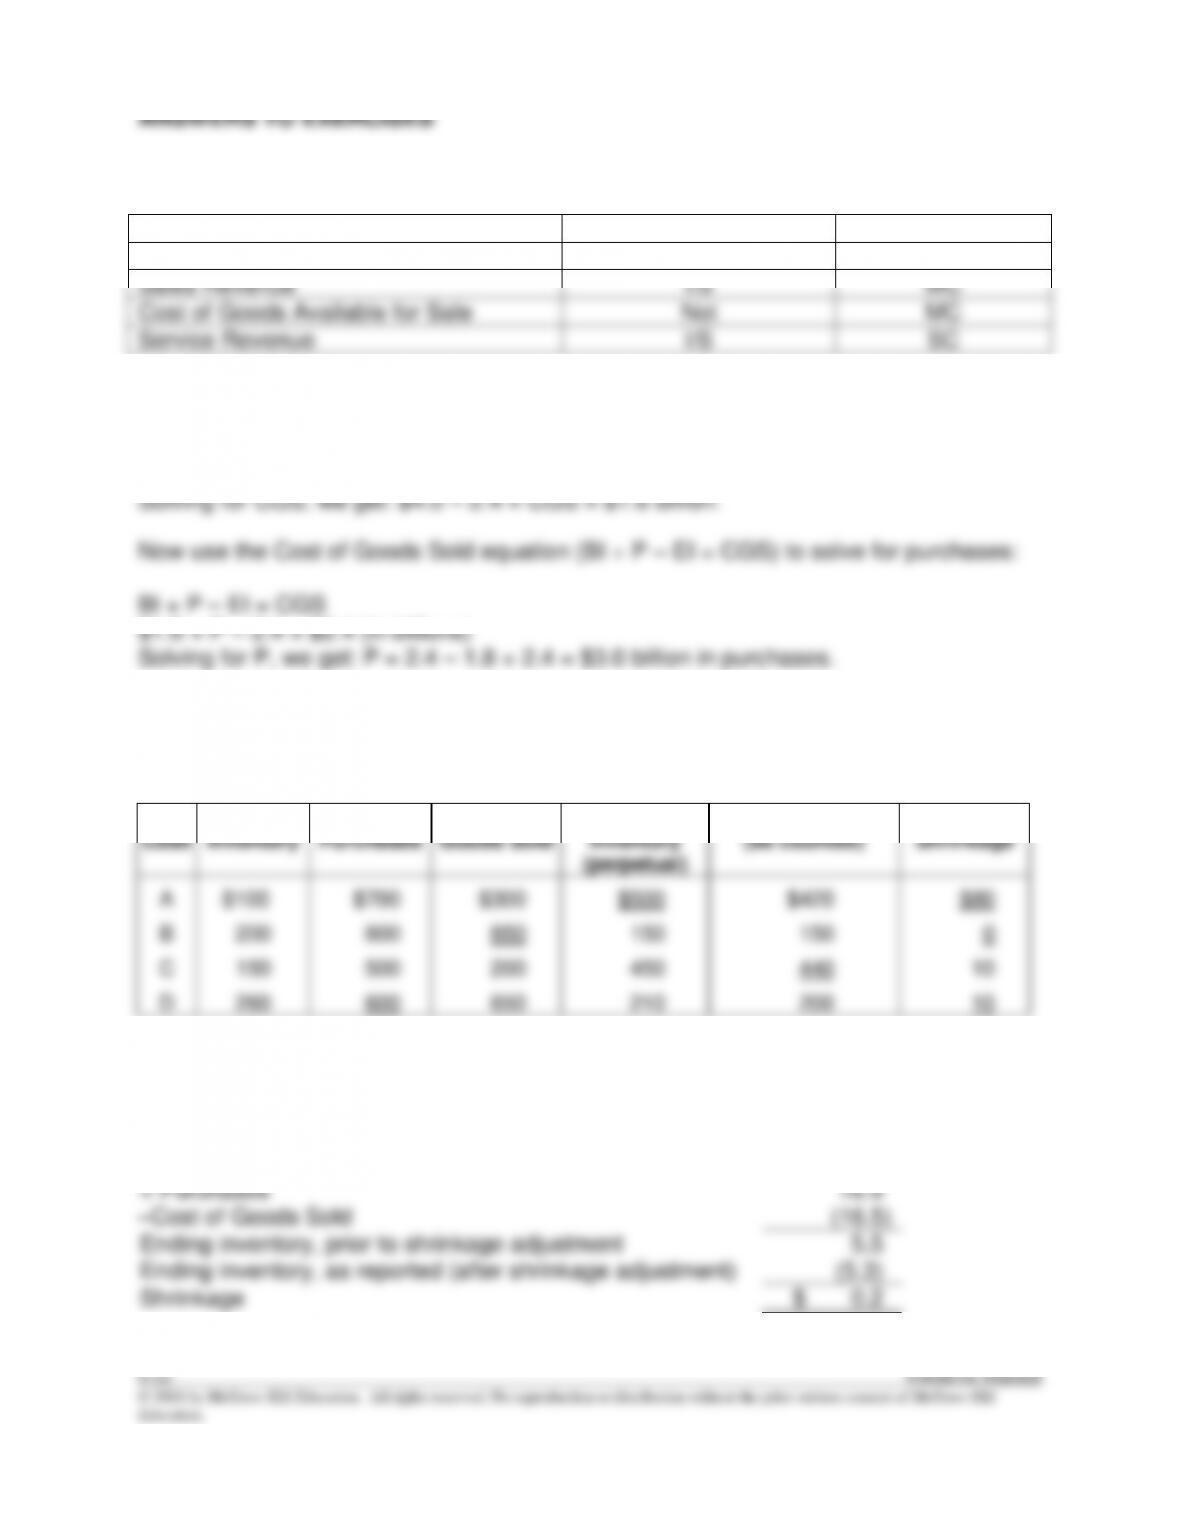
ANSWERS TO EXERCISES
E6–1
Financial Statement
Type of Company
Inventory
B/S
MC
Sales Revenue
I/S
MC
Cost of Goods Available for Sale
Not
MC
Service Revenue
I/S
SC
E6-2
Sales – CGS = GP
$4.0 – CGS = $2.4 (in billions)
E6–3
(Underscore for missing amounts only.)
Case
Beg.
Inventory
Purchases
Cost of
Goods Sold
Ending
Inventory
(perpetual)
Ending Inventory
(as counted)
Shrinkage
A
$100
$700
$300
$500
$420
$80
B
200
800
850
150
150
0
C
150
500
200
450
440
10
D
260
600
650
210
200
10
E6–4
(amounts in billions)
Beginning inventory
$ 5.1
+ Purchases
16.9
–Cost of Goods Sold
(16.5)
Ending inventory, prior to shrinkage adjustment
5.5
Ending inventory, as reported (after shrinkage adjustment)
(5.3)
Shrinkage
$ 0.2
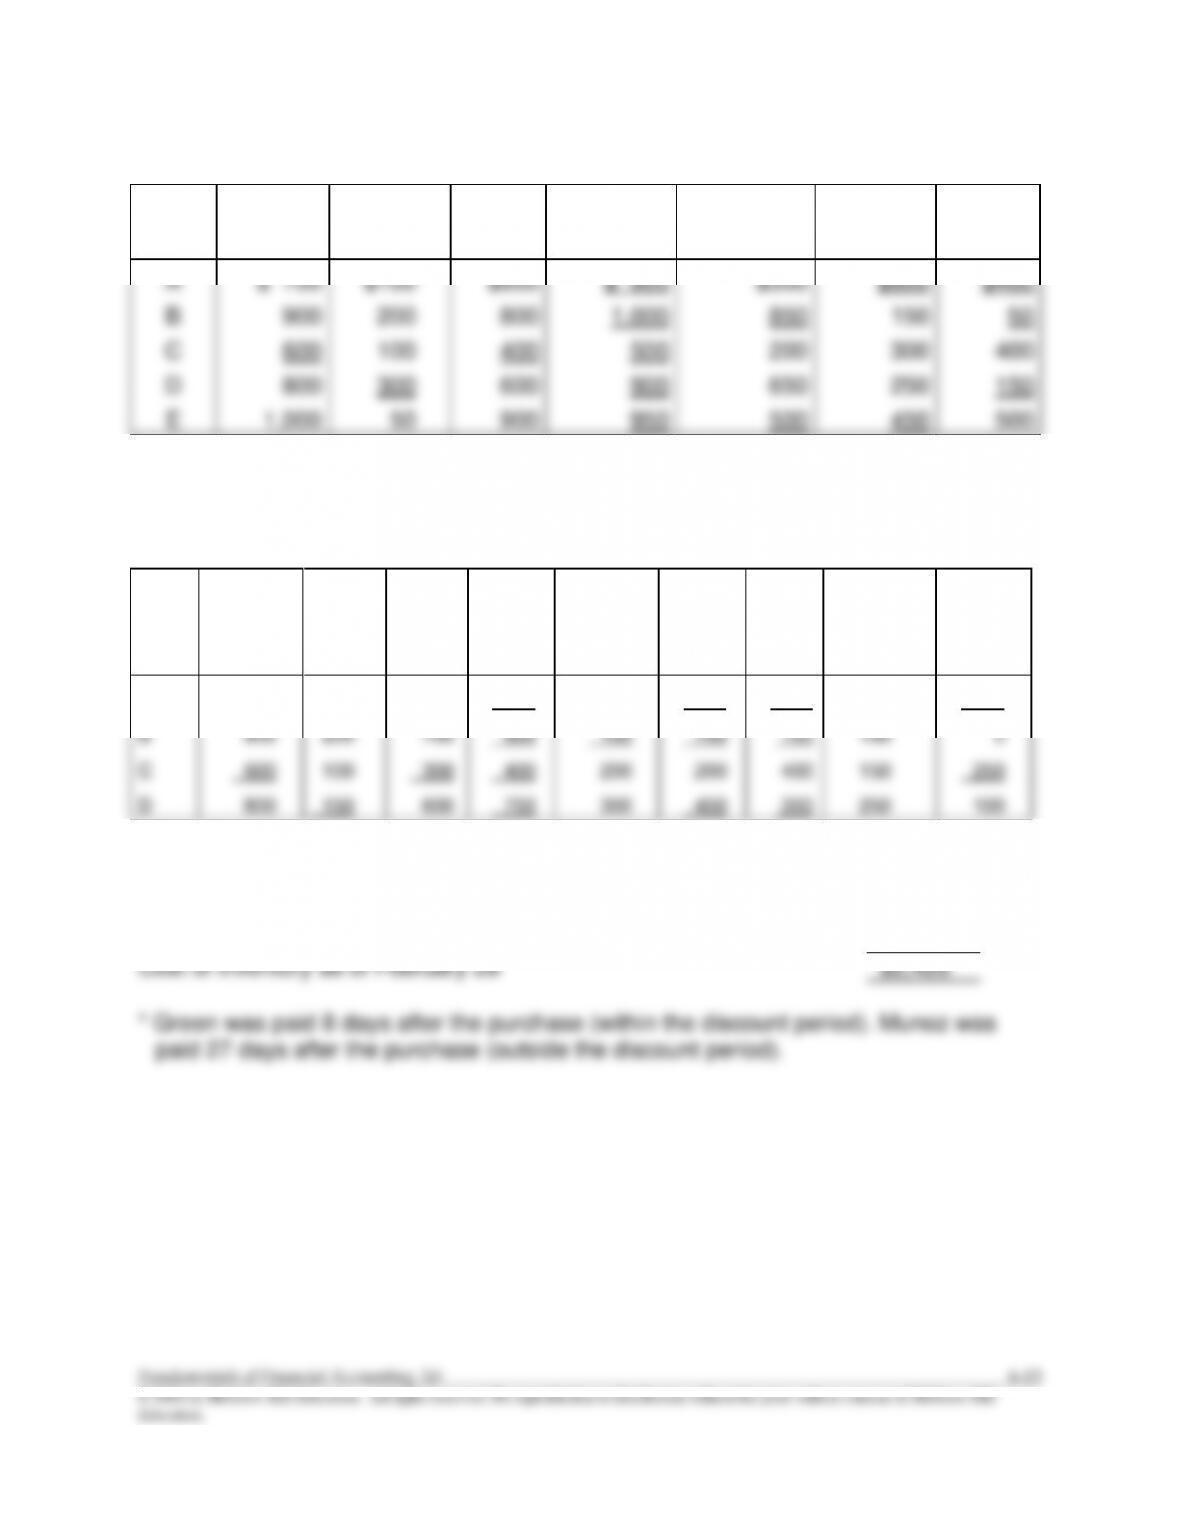
E6-5
(Underlined items are the missing amounts.)
Cases
Sales
Revenue
Beg.
Inventory
Purch.
Cost of
Goods
Available
Cost of
Goods Sold
Cost of
Ending
Inventory
Gross
Profit
A
$ 700
$100
$800
$ 900
$300
$600
$400
B
900
200
800
1,000
850
150
50
C
600
100
400
500
200
300
400
D
800
300
600
900
650
250
150
E
1,000
50
900
950
500
450
500
E6-6
(Underscore for missing amounts only.)
Case
Sales
Revenue
Beg.
Inven-
tory
Pur-
chases
Total
Avail-
able
Ending
Inventory
Cost of
Goods
Sold
Gross
Profit
Operating
Expenses
Income
from
Oper-
ations
A
$ 800
$100
$700
$800
$500
$300
$500
200
$300
B
900
200
700
900
150
750
150
150
0
C
600
100
300
400
200
200
400
150
250
D
800
150
600
750
300
450
350
250
100
E6-7
Purchases ($1,200 + $900 + $350)
$2,450
Less: Purchase discount from Green ($1,200 x 2%)
(24)*
Cost of inventory as of February 28
$2,426
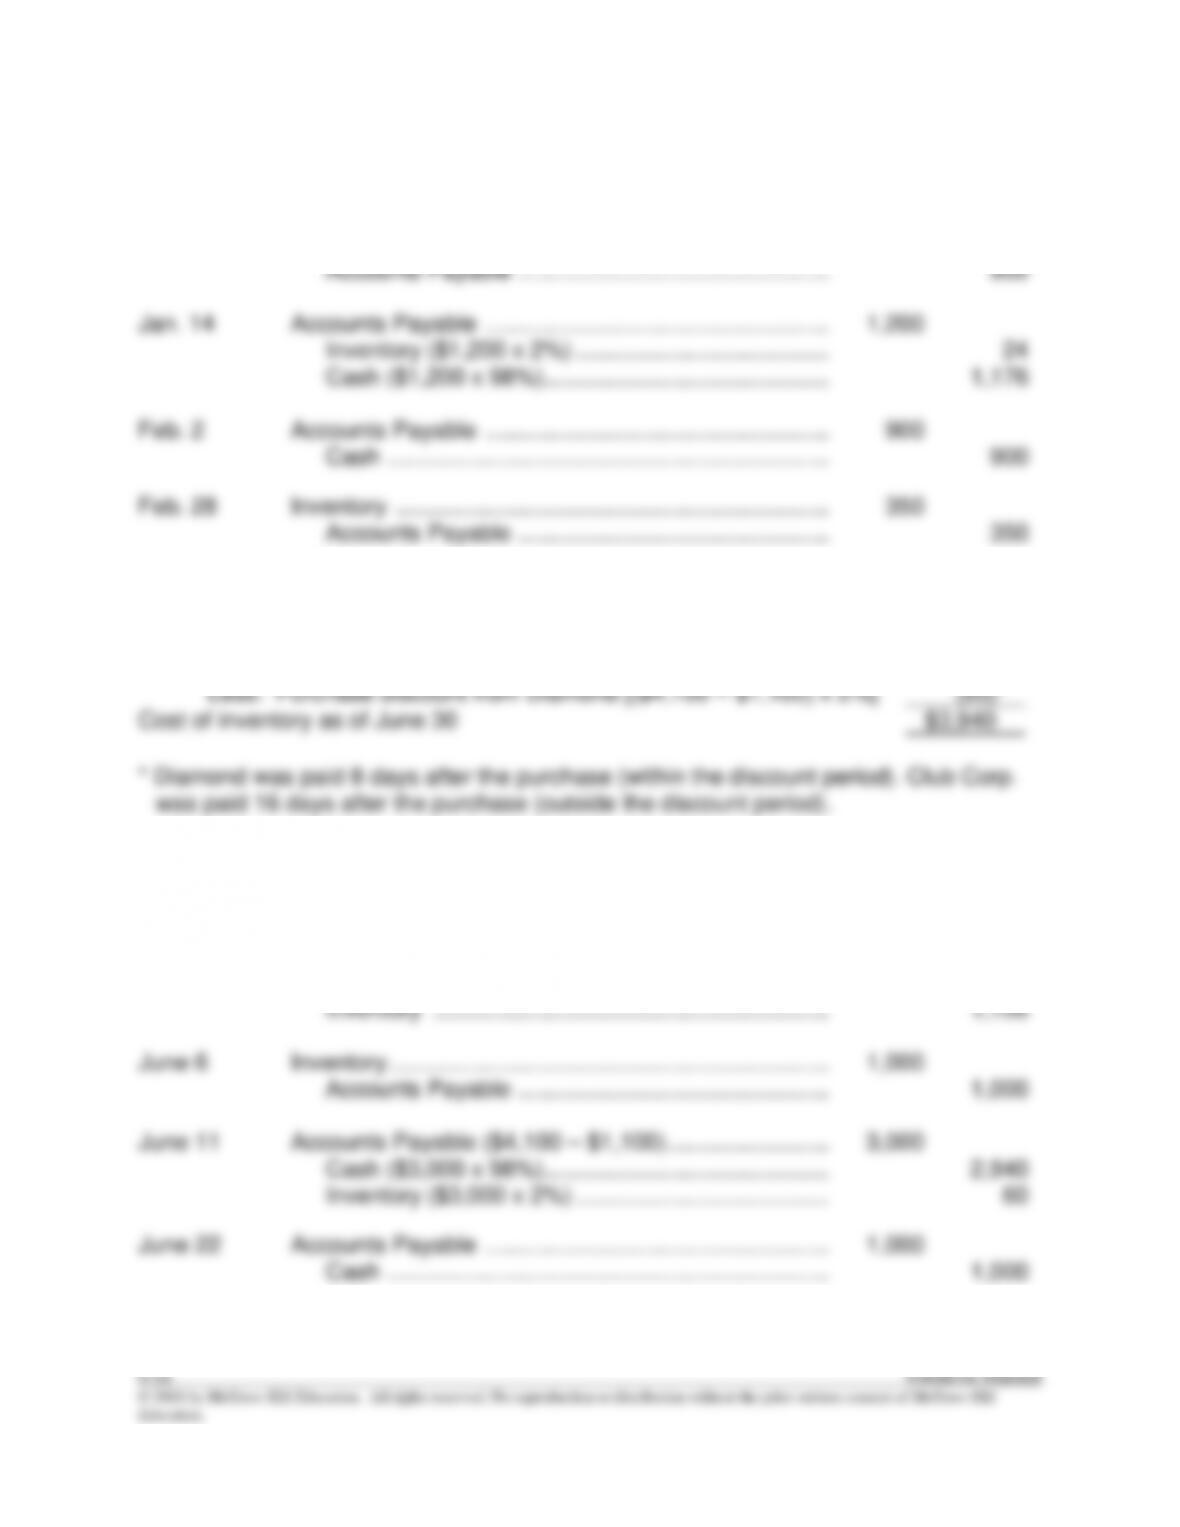
E6-8
Jan. 6
Inventory ………………………………………………………….………
1,200
Accounts Payable …………………………………………………
1,200
Jan. 6
Inventory ………………………………………………………….………
900
Accounts Payable …………………………………………………
900
Jan. 14
Accounts Payable ……………………………………………..………
1,200
Inventory ($1,200 x 2%) …………………………………………
24
Cash ($1,200 x 98%) ……………………………………..………
1,176
Feb. 2
Accounts Payable ……………………………………………..………
900
Cash …………………………………………………………..………
900
Feb. 28
Inventory ………………………………………………………….………
350
Accounts Payable …………………………………………………
350
E6-9
Purchases ($4,100 + $1,000)
$5,100
Less: Purchase returns
(1,100)
Less: Purchase discount from Diamond [($4,100 – $1,100) x 2%]
(60)*
Cost of inventory as of June 30
$3,940
E6–10
June 3
Inventory ………………………………………………………….………
4,100
Accounts Payable …………………………………………………
4,100
June 5
Accounts Payable ……………………………………………..………
1,100
Inventory …………………………………………………….…
1,100
June 6
Inventory …………………………………………………………..………
1,000
Accounts Payable …………………………………………………
1,000
June 11
Accounts Payable ($4,100 – $1,100) …………………….…….
3,000
Cash ($3,000 x 98%) ……………………………………..………
2,940
Inventory ($3,000 x 2%) …………………………………………
60
June 22
Accounts Payable ……………………………………………..………
1,000
Cash …………………………………………………………..………
1,000
E6–11
Req. 1
PC Mall’s shipping terms are FOB destination because the company retains control of
the inventory until it arrives at the customer’s location.
Req. 2
December
E6–12
Sales Revenue ($100 + $80 + $50)……………………………………………… $230
Sales Discount ($100 collected from Wizard Inc. x 2%) ………………….. (2)*
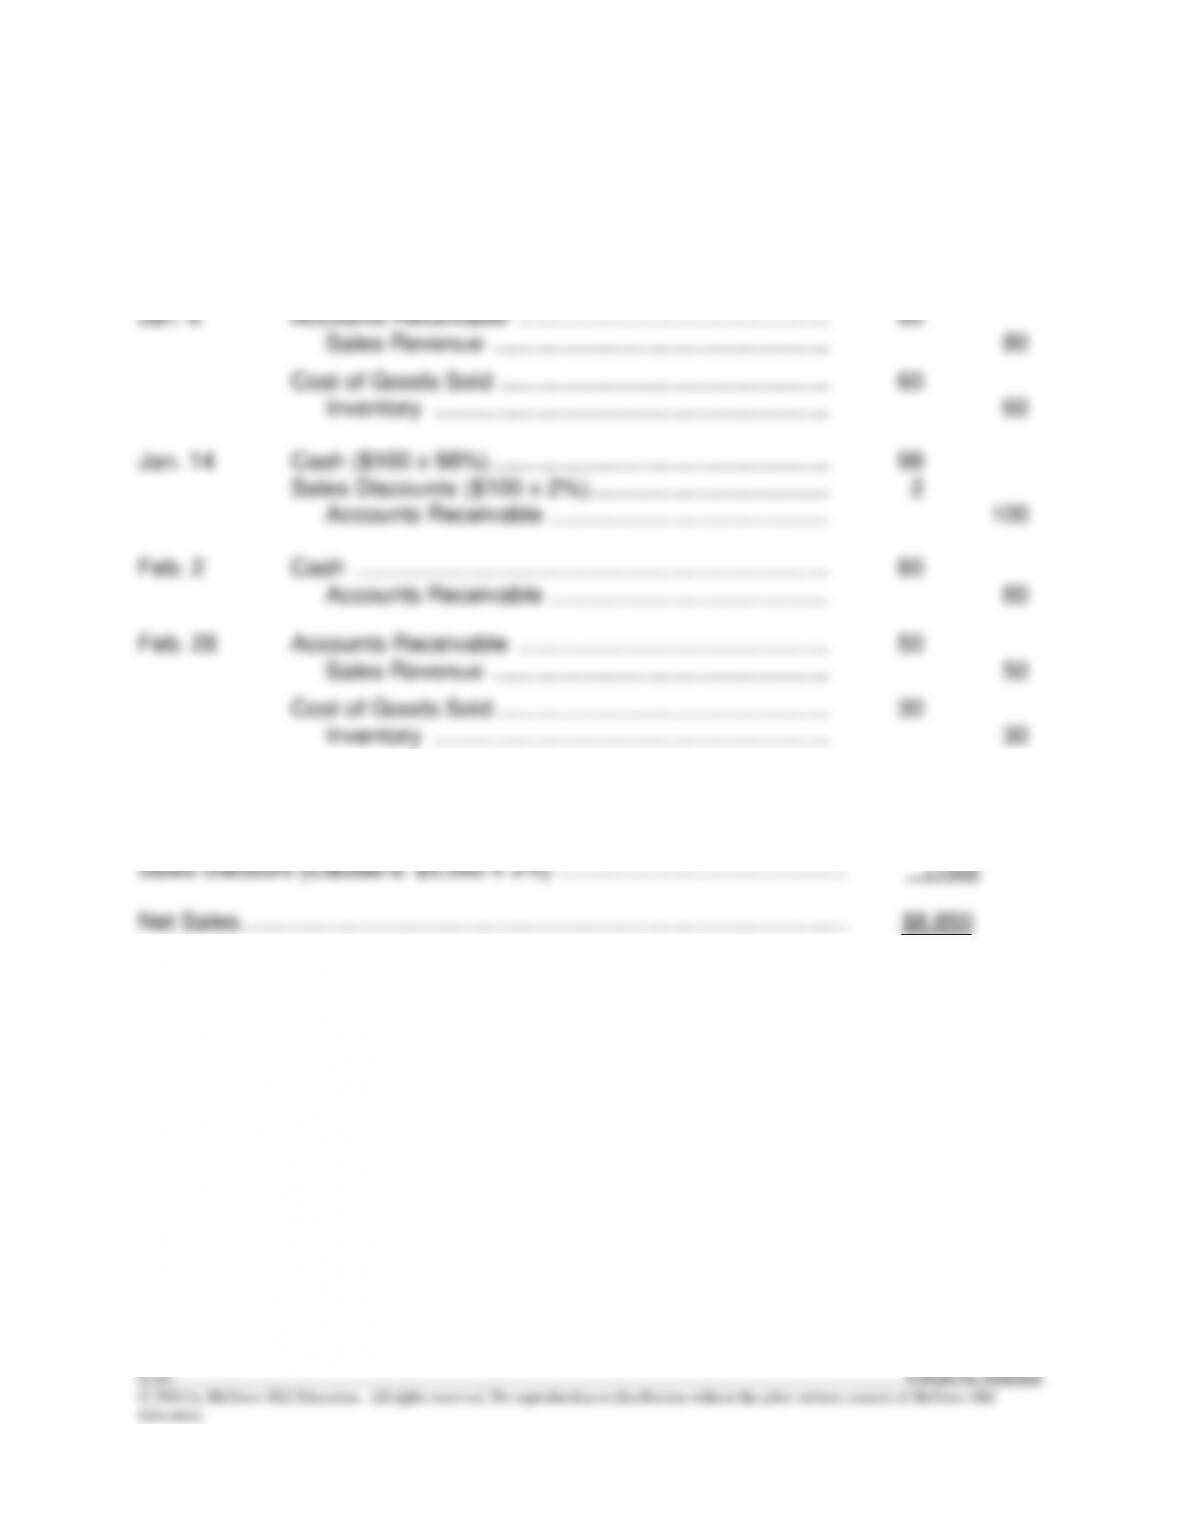
E6–13
Jan. 6
Accounts Receivable …………………………………………………
100
Sales Revenue …………………………………………….………
100
Cost of Goods Sold ……………………………………………………
70
Inventory …………………………………………………….…
70
Jan. 6
Accounts Receivable …………………………………………………
80
Sales Revenue …………………………………………….………
80
Cost of Goods Sold ……………………………………………………
60
Inventory …………………………………………………….…
60
Jan. 14
Cash ($100 x 98%) …………………………………………….………
98
Sales Discounts ($100 x 2%) ……………………………….………
2
Accounts Receivable …………………………………….………
100
Feb. 2
Cash ……………………………………………………………….………
80
Accounts Receivable …………………………………….………
80
Feb. 28
Accounts Receivable …………………………………………………
50
Sales Revenue …………………………………………….………
50
Cost of Goods Sold ……………………………………………………
30
Inventory …………………………………………………….…
30
E6–14
Sales Revenue ($1,000 + $5,000 + $3,000) ………………………………….. $9,000
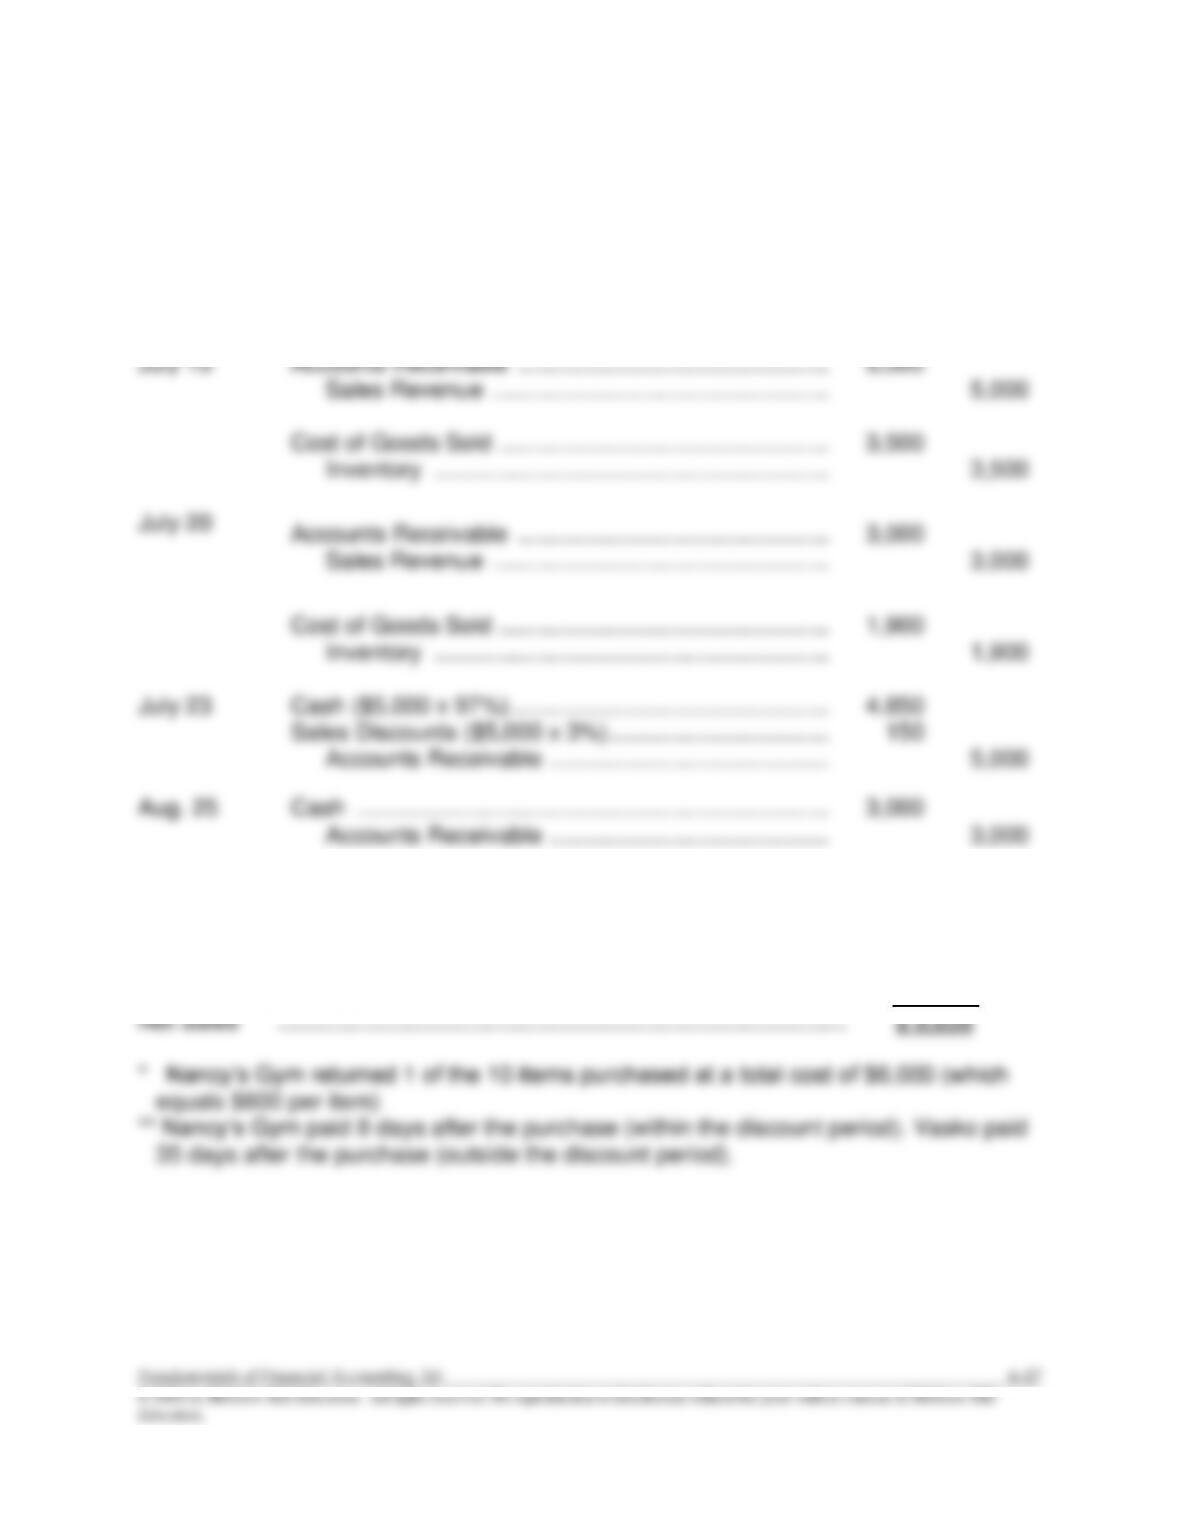
E6–15
July 12
Cash ……………………………………………………………….………
1,000
Sales Revenue …………………………………………….………
1,000
Cost of Goods Sold ……………………………………………………
600
Inventory …………………………………………………….…
600
July 15
Accounts Receivable …………………………………………………
5,000
Sales Revenue …………………………………………….………
5,000
Cost of Goods Sold ……………………………………………………
3,500
Inventory …………………………………………………….…
3,500
July 20
Accounts Receivable …………………………………………………
3,000
Sales Revenue …………………………………………….………
3,000
Cost of Goods Sold ……………………………………………………
1,900
Inventory …………………………………………………….…
1,900
July 23
Cash ($5,000 x 97%) ………………………………………….………
4,850
Sales Discounts ($5,000 x 3%) …………………………….………
150
Accounts Receivable …………………………………….………
5,000
Aug. 25
Cash ……………………………………………………………….………
3,000
Accounts Receivable …………………………………….………
3,000
E6–16
Sales Revenue ($400 + $4,000 + $6,000) …………………………………….. $10,400
Sales Returns and Allowances (1/10 x $6,000 from Nancy’s) ……………. (600)*
Sales Discounts (9/10 x $6,000 x 3% from Nancy’s) ………………………… (162)**
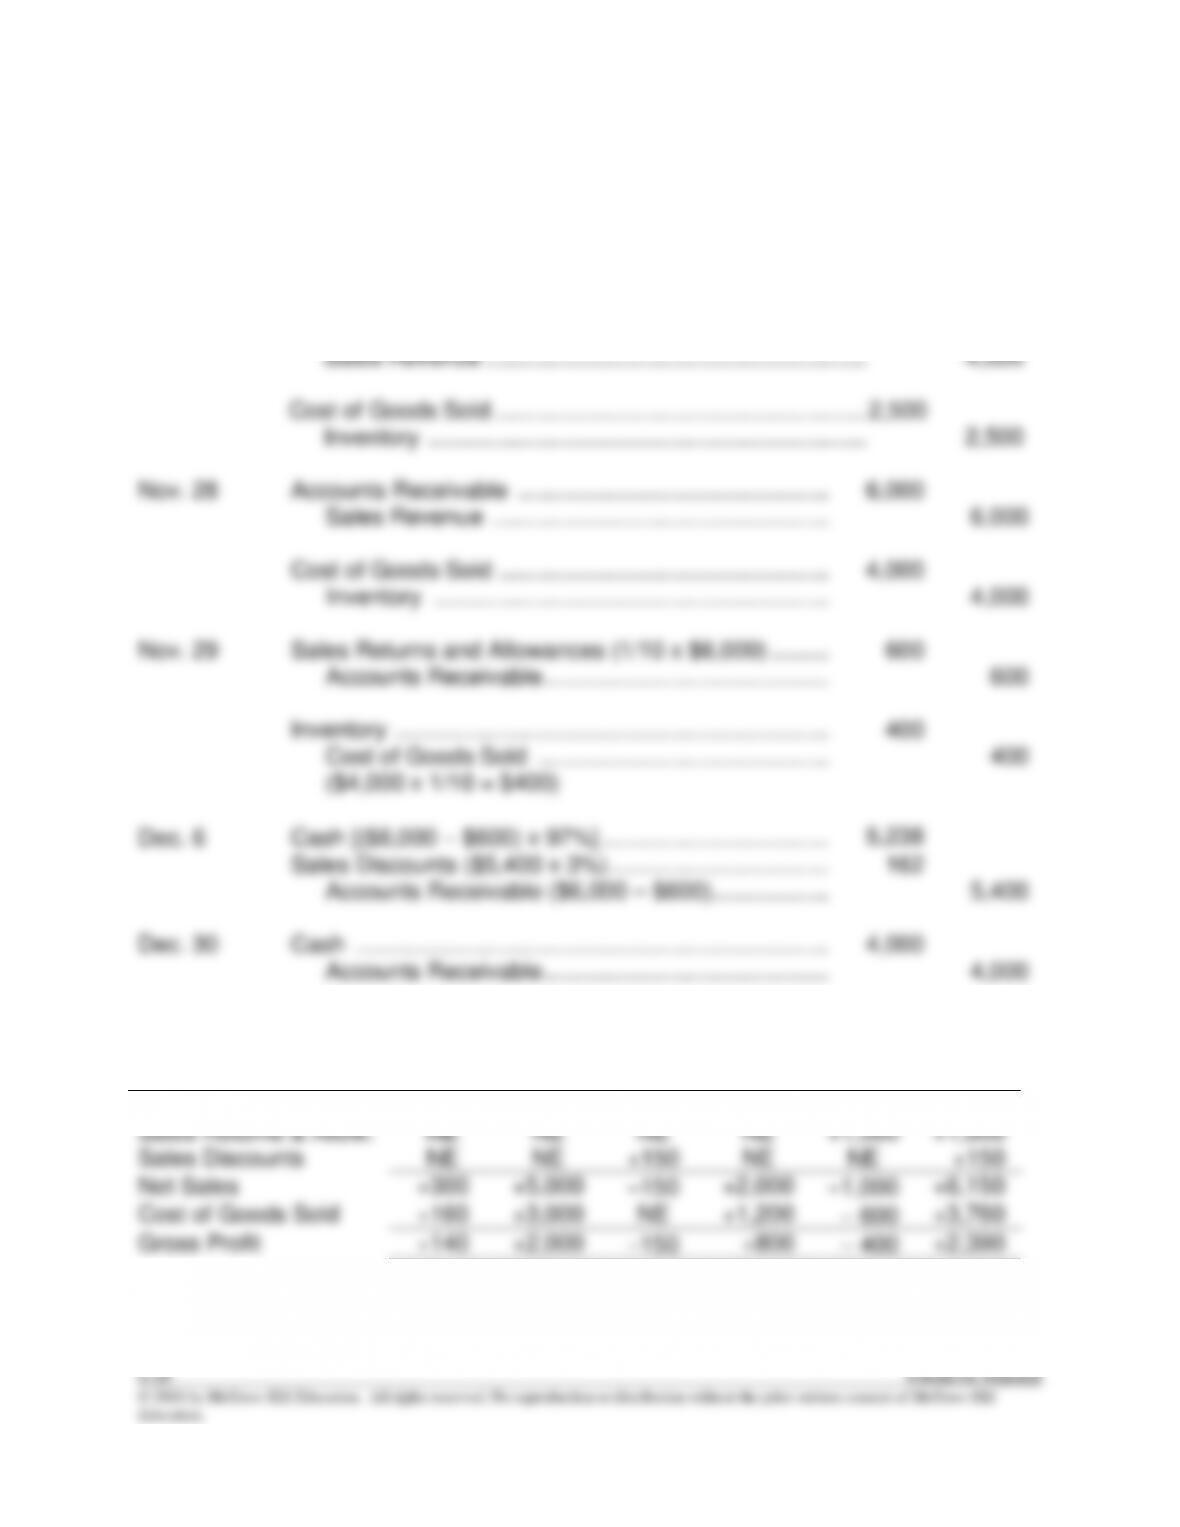
E6–17
Nov. 20
Cash …………………………………………………………………….…
400
Sales Revenue ………………………………………………….…
400
Cost of Goods Sold ……………………………………………………
300
Inventory …………………………………………………………..…
300
Nov. 25
Accounts Receivable …………………………………………………
4,000
Sales Revenue …………………………………………………..…
4,000
Cost of Goods Sold ………………………………………………….…
2,500
Inventory …………………………………………………………..…
2,500
Nov. 28
Accounts Receivable …………………………………………………
6,000
Sales Revenue …………………………………………….………
6,000
Cost of Goods Sold ……………………………………………………
4,000
Inventory …………………………………………………….…
4,000
Nov. 29
Sales Returns and Allowances (1/10 x $6,000) ………………
600
Accounts Receivable ……………………………………..………
600
Inventory ………………………………………………………….………
400
Cost of Goods Sold ………………………………………………
400
($4,000 x 1/10 = $400)
Dec. 6
Cash [($6,000 − $600) x 97%] ……………………………..………
5,238
Sales Discounts ($5,400 x 3%) …………………………….………
162
Accounts Receivable ($6,000 – $600) ………………………
5,400
Dec. 30
Cash ……………………………………………………………….………
4,000
Accounts Receivable ……………………………………..………
4,000
E6–18
Transaction
July 12
July 15
July 20
July 21
July 23
TOTALS
Sales Revenue
+300
+5,000
NE
+2,000
NE
+7,300
Sales Returns & Allow.
NE
NE
NE
NE
+1,000
+1,000
Sales Discounts
NE
NE
+150
NE
NE
+150
Net Sales
+300
+5,000
−150
+2,000
−1,000
+6,150
Cost of Goods Sold
+160
+3,000
NE
+1,200
− 600
+3,760
Gross Profit
+140
+2,000
−150
+800
− 400
+2,390
E6–19
Req. 1
Accounts Receivable …………………………………………………
800
Sales Revenue …………………………………………….………
800
Cost of Goods Sold ……………………………………………………
500
Inventory …………………………………………………….…
500
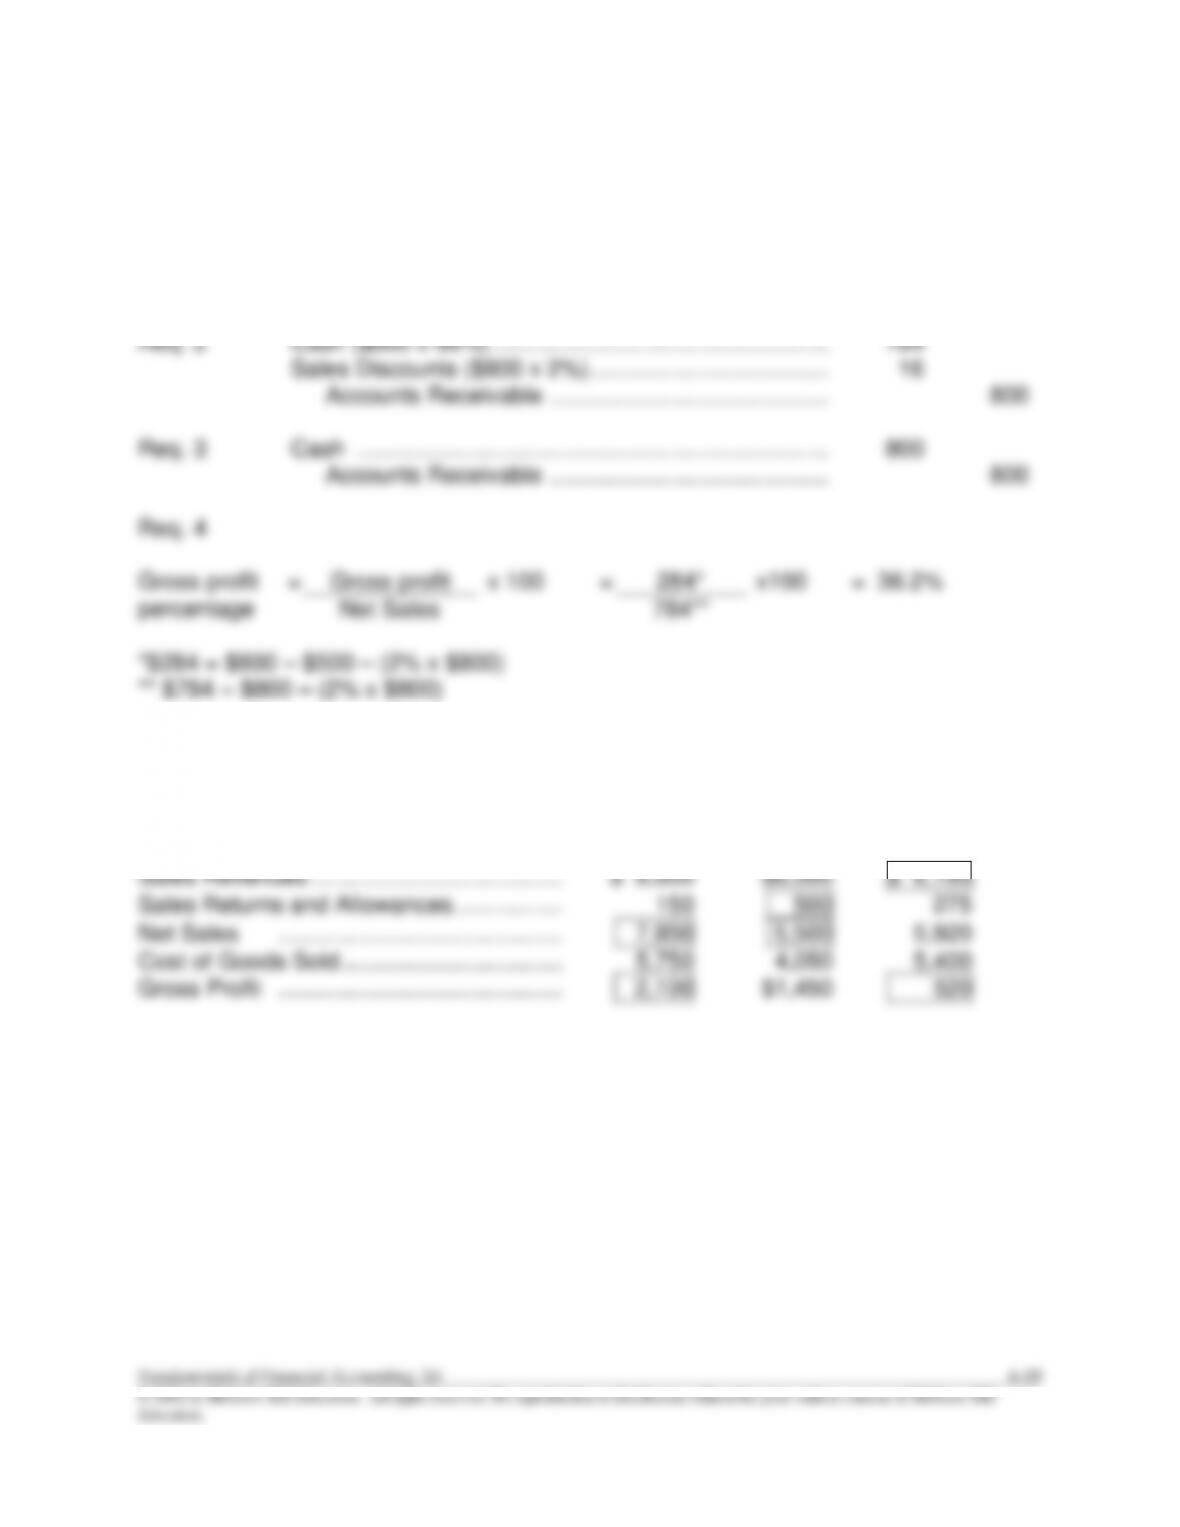
Req. 2
Cash ($800 x 98%) …………………………………………….………
784
Sales Discounts ($800 x 2%) ……………………………….………
16
Accounts Receivable …………………………………….………
800
Req. 3
Cash ……………………………………………………………….………
800
Accounts Receivable …………………………………….………
800
Req. 4
Gross profit
percentage
=
Gross profit
x 100
=
284*
x100
=
36.2%
Net Sales
784**
*$284 = $800 – $500 – (2% x $800)
** $784 = $800 – (2% x $800)
E6–20
(Boxed items are the missing amounts.)
Case A Case B Case C
E6–21
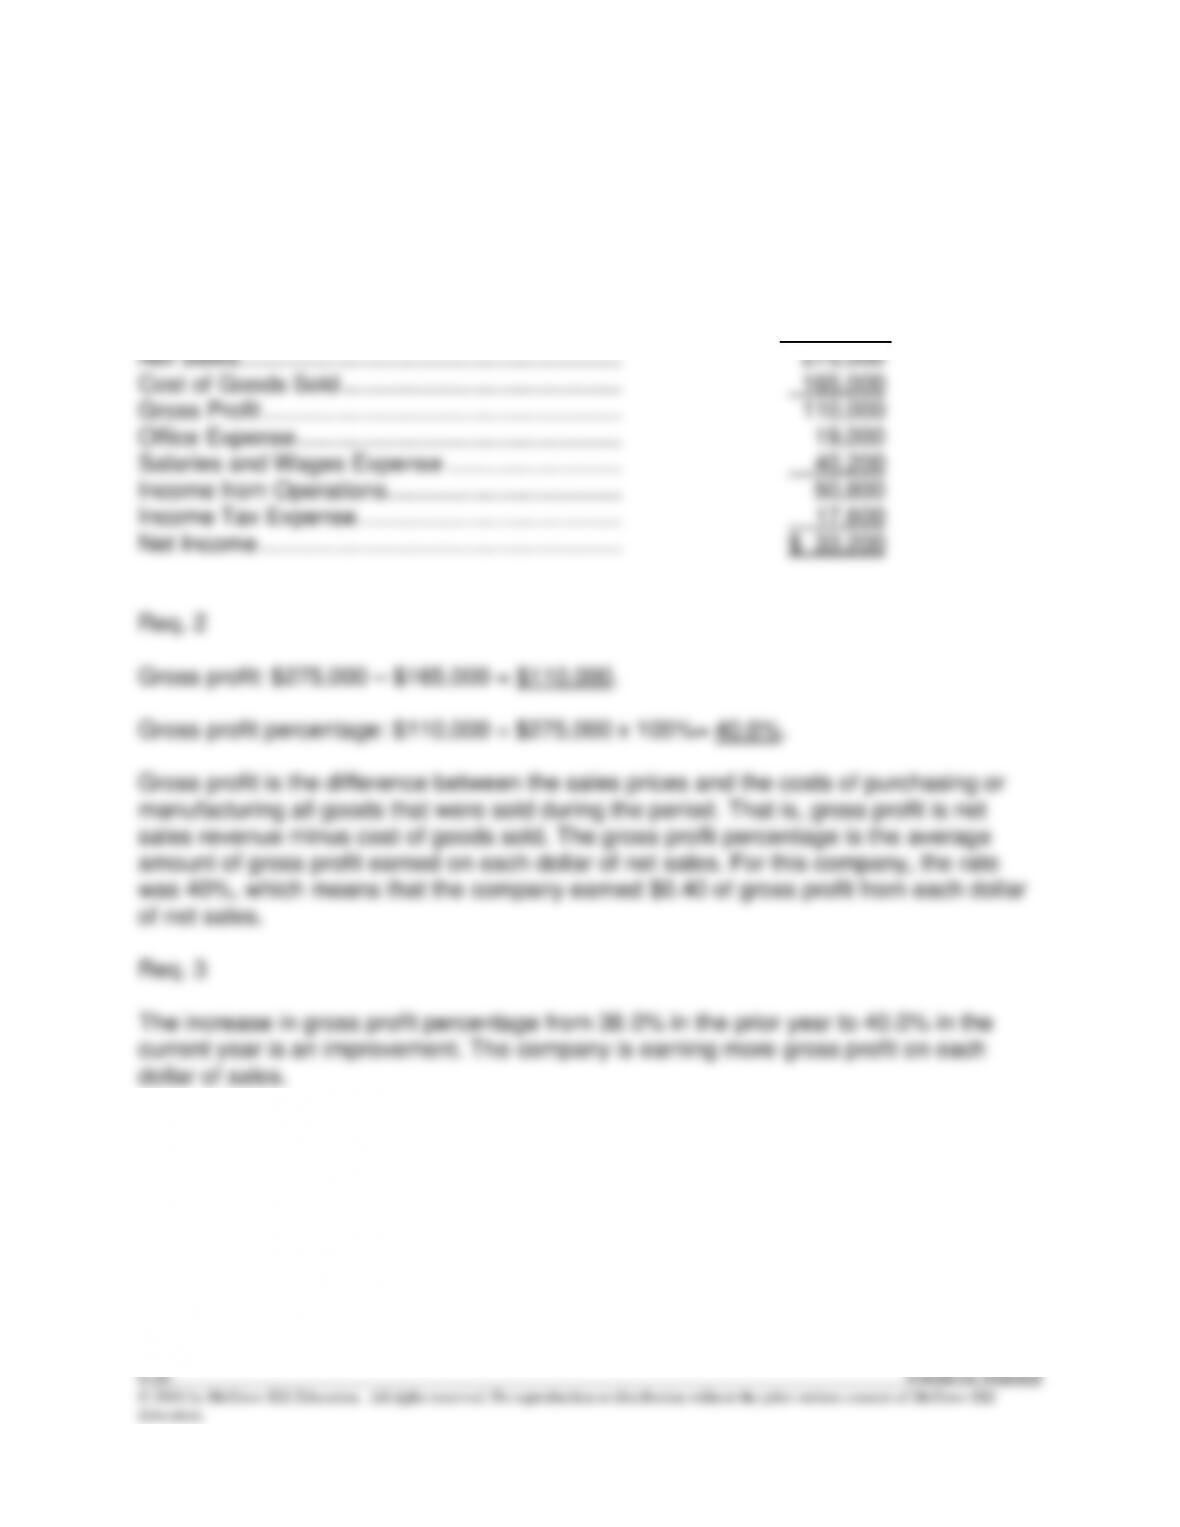
Req. 1 MYSTERY INCORPORATED
Income Statement
For the Year Ended December 31
Sales Revenue ($240,000 + $42,000) …………… $282,000
Sales Returns and Allowances …………………….. (7,000)