13-50 Solutions Manual
© 2016 by McGraw-Hill Education. All rights reserved. No reproduction or distribution without the prior written consent of McGraw-Hill
Education.
ANSWERS TO SKILLS DEVELOPMENT CASES
S13–1
Answer: D
Calculations:
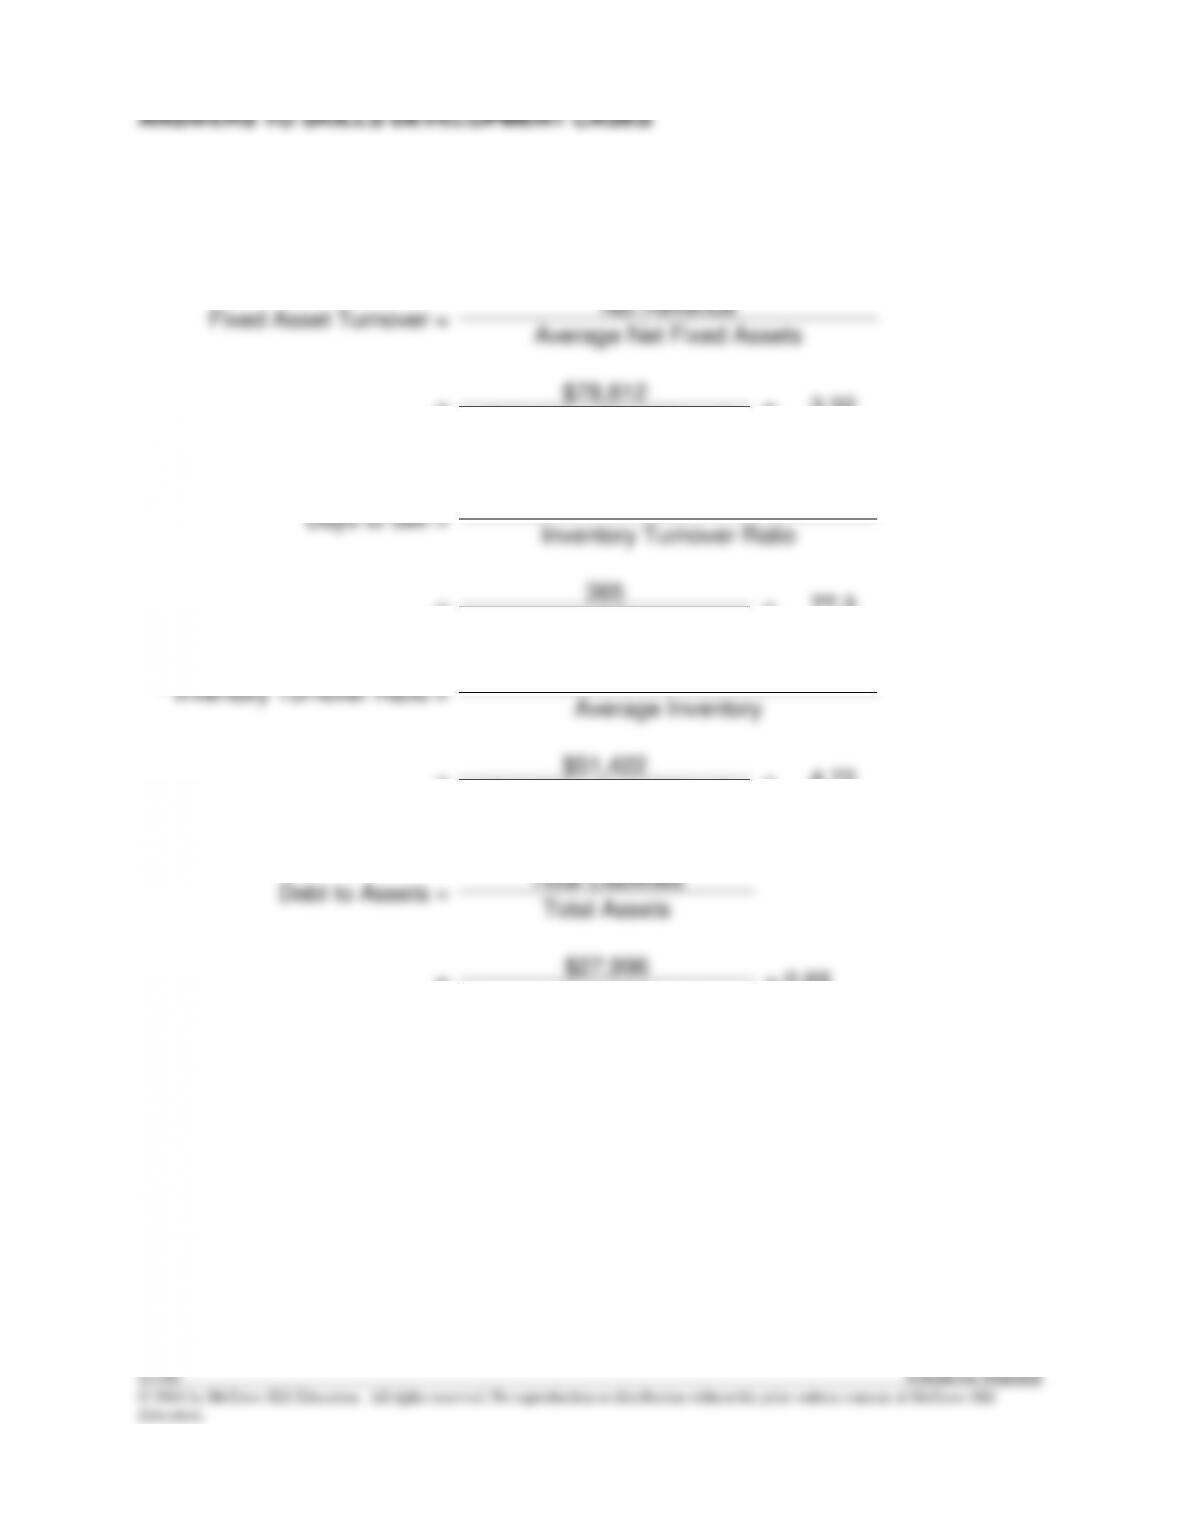
Fixed Asset Turnover =
Net Revenue
Average Net Fixed Assets
=
$78,812
=
3.32
($23,348 + $24,069) ÷ 2
Days to Sell =
365
Inventory Turnover Ratio
=
365
=
77.3
4.72*
* Inventory Turnover Ratio =
Cost of Goods Sold
Average Inventory
=
$51,422
=
4.72
($11,057 + $10,710) ÷ 2
Debt to Assets =
Total Liabilities
Total Assets
=
$27,996
= 0.69
$40,518
© 2016 by McGraw-Hill Education. All rights reserved. No reproduction or distribution without the prior written consent of McGraw-Hill
Education.
S13–2
Req. 1
Lumber
Liquidators
Lowe’s
Difference
Gross Profit
Percentage
41.1%
34.6%
6.5%
The Gross Profit Margin for Lumber Liquidators exceeds that for Lowe’s by 6.5%
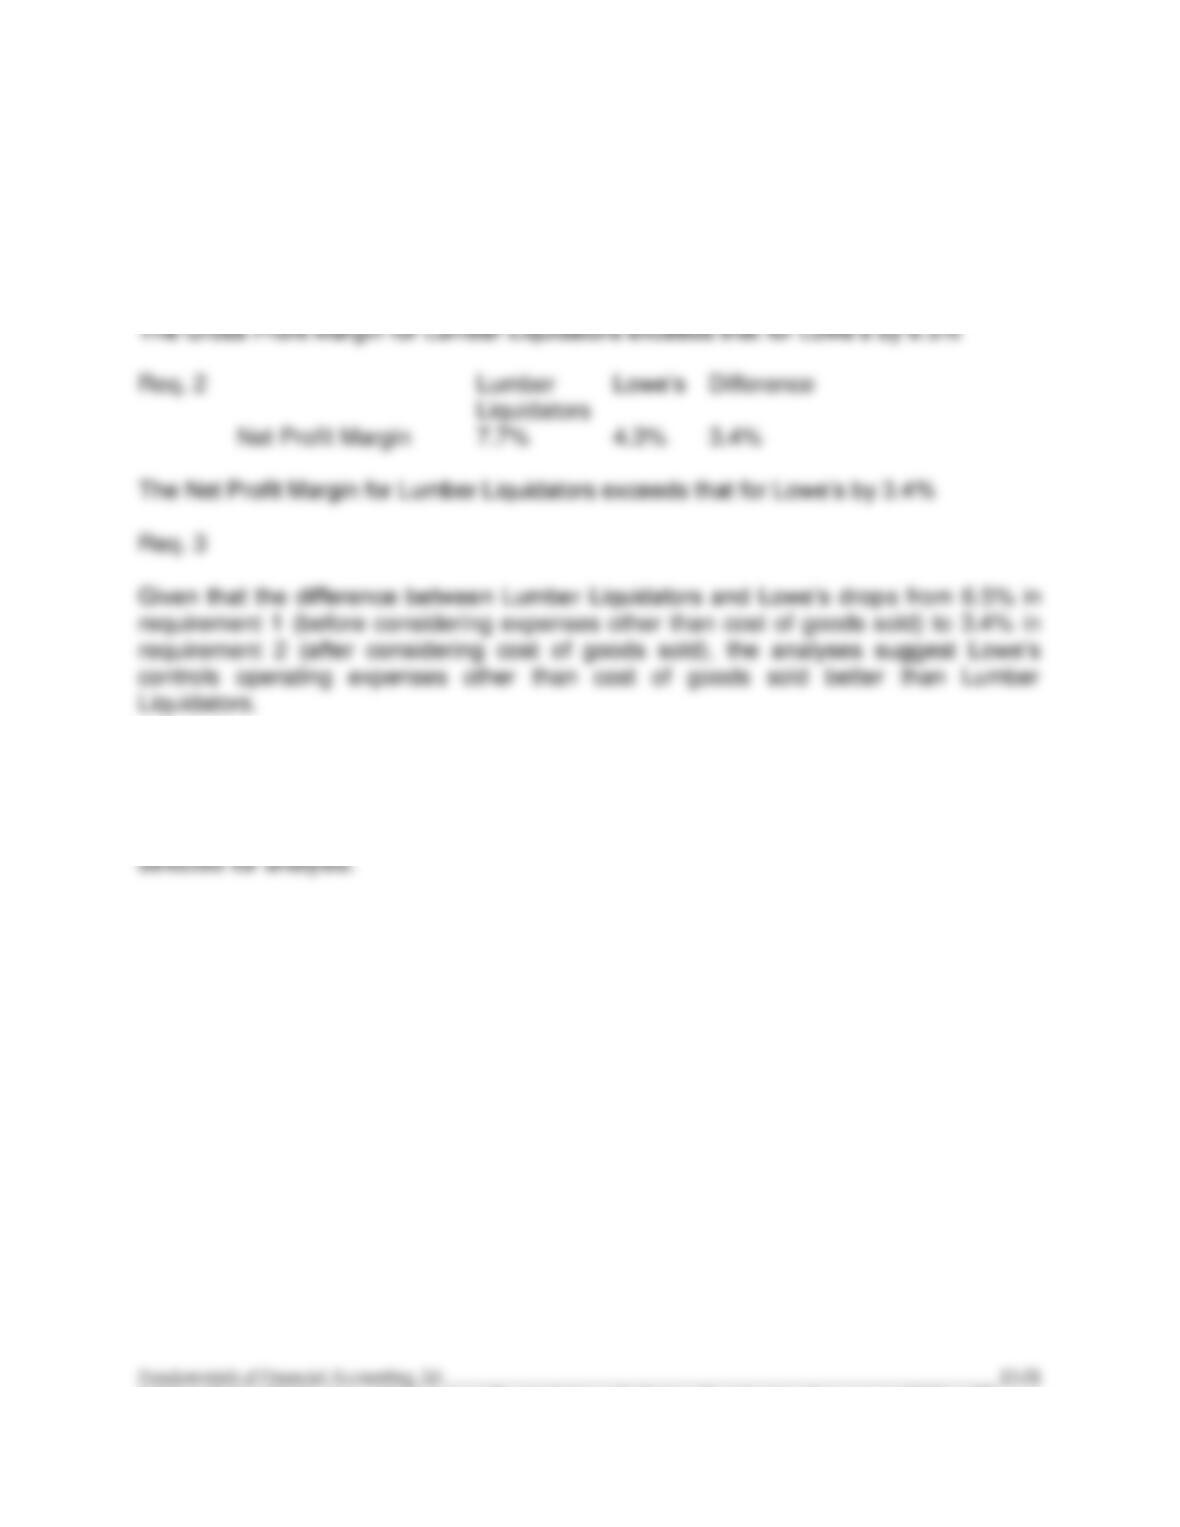
Req. 2
Lumber
Liquidators
Lowe’s
Difference
Net Profit Margin
7.7%
4.3%
3.4%
The Net Profit Margin for Lumber Liquidators exceeds that for Lowe’s by 3.4%
Req. 3
Given that the difference between Lumber Liquidators and Lowe’s drops from 6.5% in
requirement 1 (before considering expenses other than cost of goods sold) to 3.4% in
requirement 2 (after considering cost of goods sold), the analyses suggest Lowe’s
controls operating expenses other than cost of goods sold better than Lumber
Liquidators.
S13–3
The solutions to this project will depend on the company and/or accounting period
S13–4
This case encourages thinking critically about evaluating going concern problems.
Many critics who contend that auditors do a poor job of predicting business failures tend
to focus on only the failure to accurately predict instances where businesses do in fact
fail. These critics do not consider the problems that would arise if auditors predicted
business failures that were not likely to occur.
financing that would otherwise help it to survive difficult financial problems. The
company could be forced to accept unfavorable purchase terms from creditors (e.g.,
shorter repayment periods, higher interest rates), which would further amplify the
company’s problems and make it less profitable and less liquid. Essentially, an audit
report that inaccurately predicts business failure could become a “self-fulfilling
S13–5
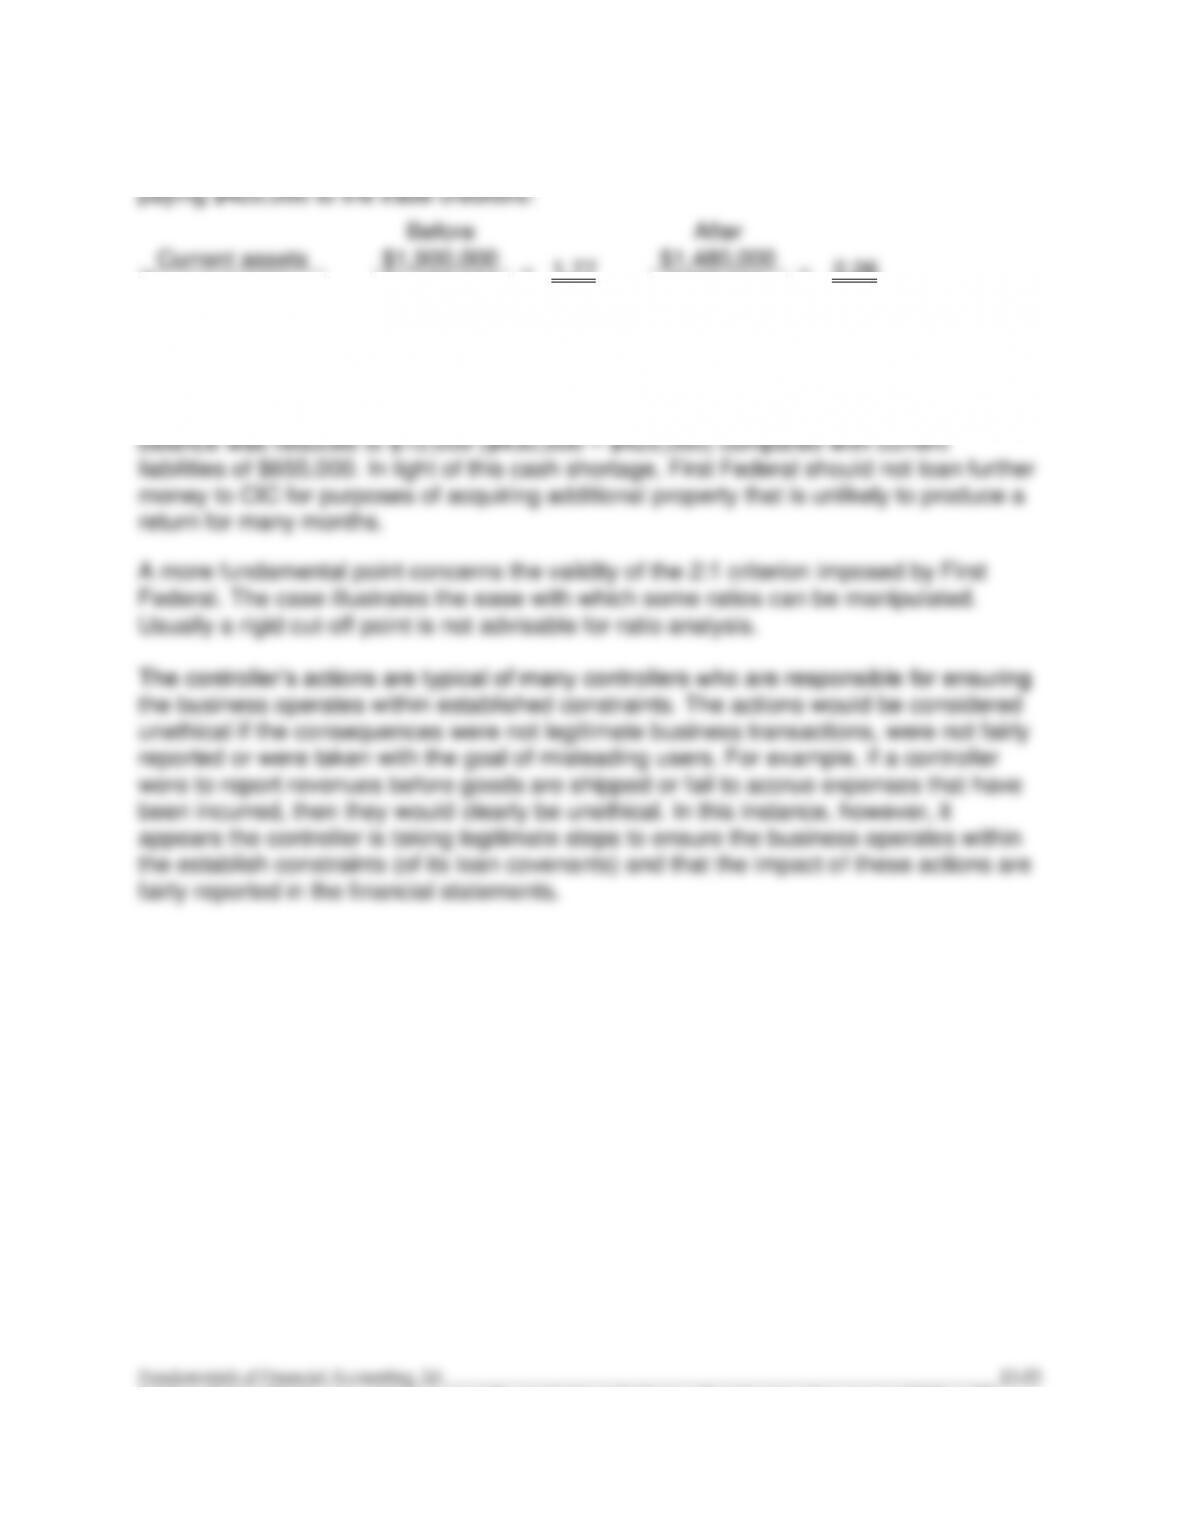
The current ratio for Capital Investments Corporation (CIC) increased as the result of
S13–6
Req. 1
The ratios that are likely to be affected by alternative depreciation methods are:
1.
Return on equity
5.
Debt to assets
2.
Fixed asset turnover
6.
Price/earnings ratio (P/E ratio)
3.
Earnings per share (EPS)
7.
Times interest earned
4.
Net profit margin
Alternative depreciation methods affect reported noncurrent assets, net income, and
© 2016 by McGraw-Hill Education. All rights reserved. No reproduction or distribution without the prior written consent of McGraw-Hill
Education.
S13–7
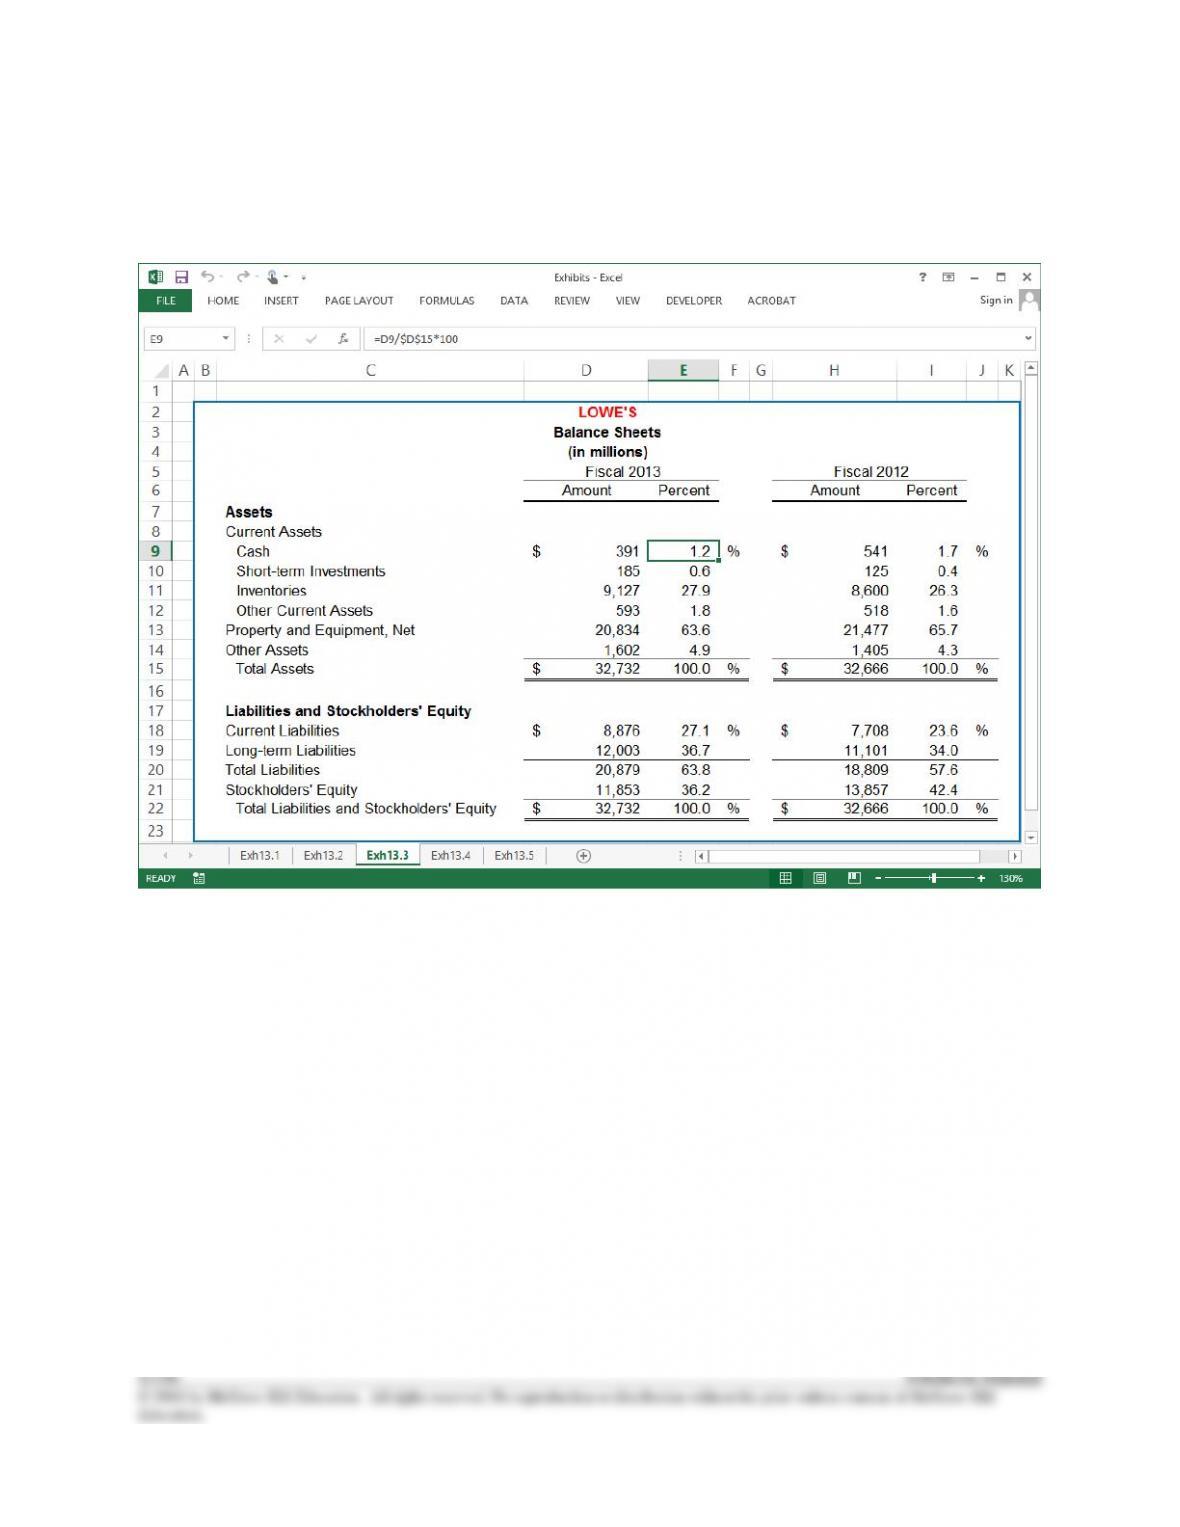
Req. 1
S13–7 (continued)
Req. 2
The formula to calculate the percent of total assets is shown in the formula bar.
© 2016 by McGraw-Hill Education. All rights reserved. No reproduction or distribution without the prior written consent of McGraw-Hill
Education.
CC13-1
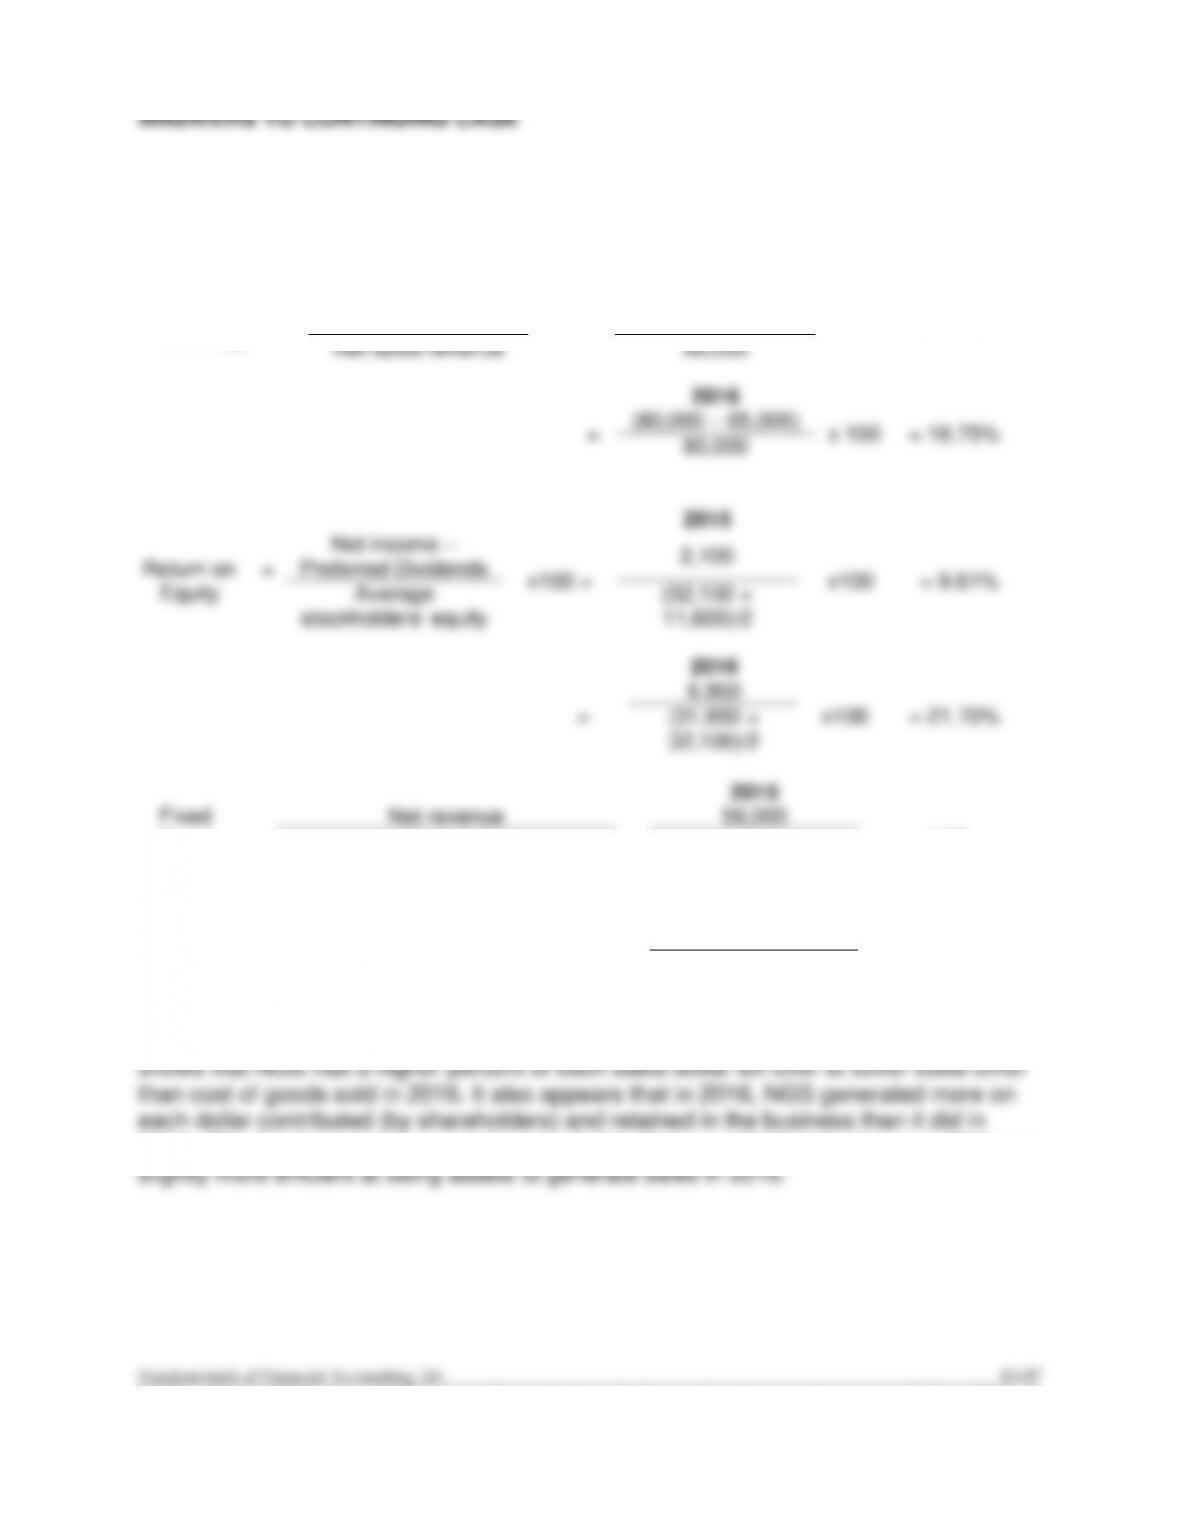
Req. 1
2015
Gross Profit
Percentage
=
Net sales revenue-
Cost of goods sold
x100 =
(56,000 – 48,000)
x 100
= 14.29%
Net sales revenue
56,000
2016
=
(80,000 – 65,000)
x 100
= 18.75%
80,000
2015
Return on
Equity
=
Net income –
Preferred Dividends
x100 =
2,100
x100
= 9.61%
Average
stockholders’ equity
(32,100 +
11,600)/2
2016
=
6,950
x100
= 21.70%
(31,950 +
32,100)/2
2015
Fixed
Asset
Turnover
=
Net revenue
=
56,000
= 1.06
Average net fixed assets
(79,000 + 27,000)/2
2016
=
80,000
= 1.12
(64,000 + 79,000)/2
NGS appears to be more profitable in 2016. The gross profit percentage analysis
2015. The fixed asset turnover ratio was slightly higher in 2016 indicating that NGS was
13-58 Solutions Manual
© 2016 by McGraw-Hill Education. All rights reserved. No reproduction or distribution without the prior written consent of McGraw-Hill
Education.
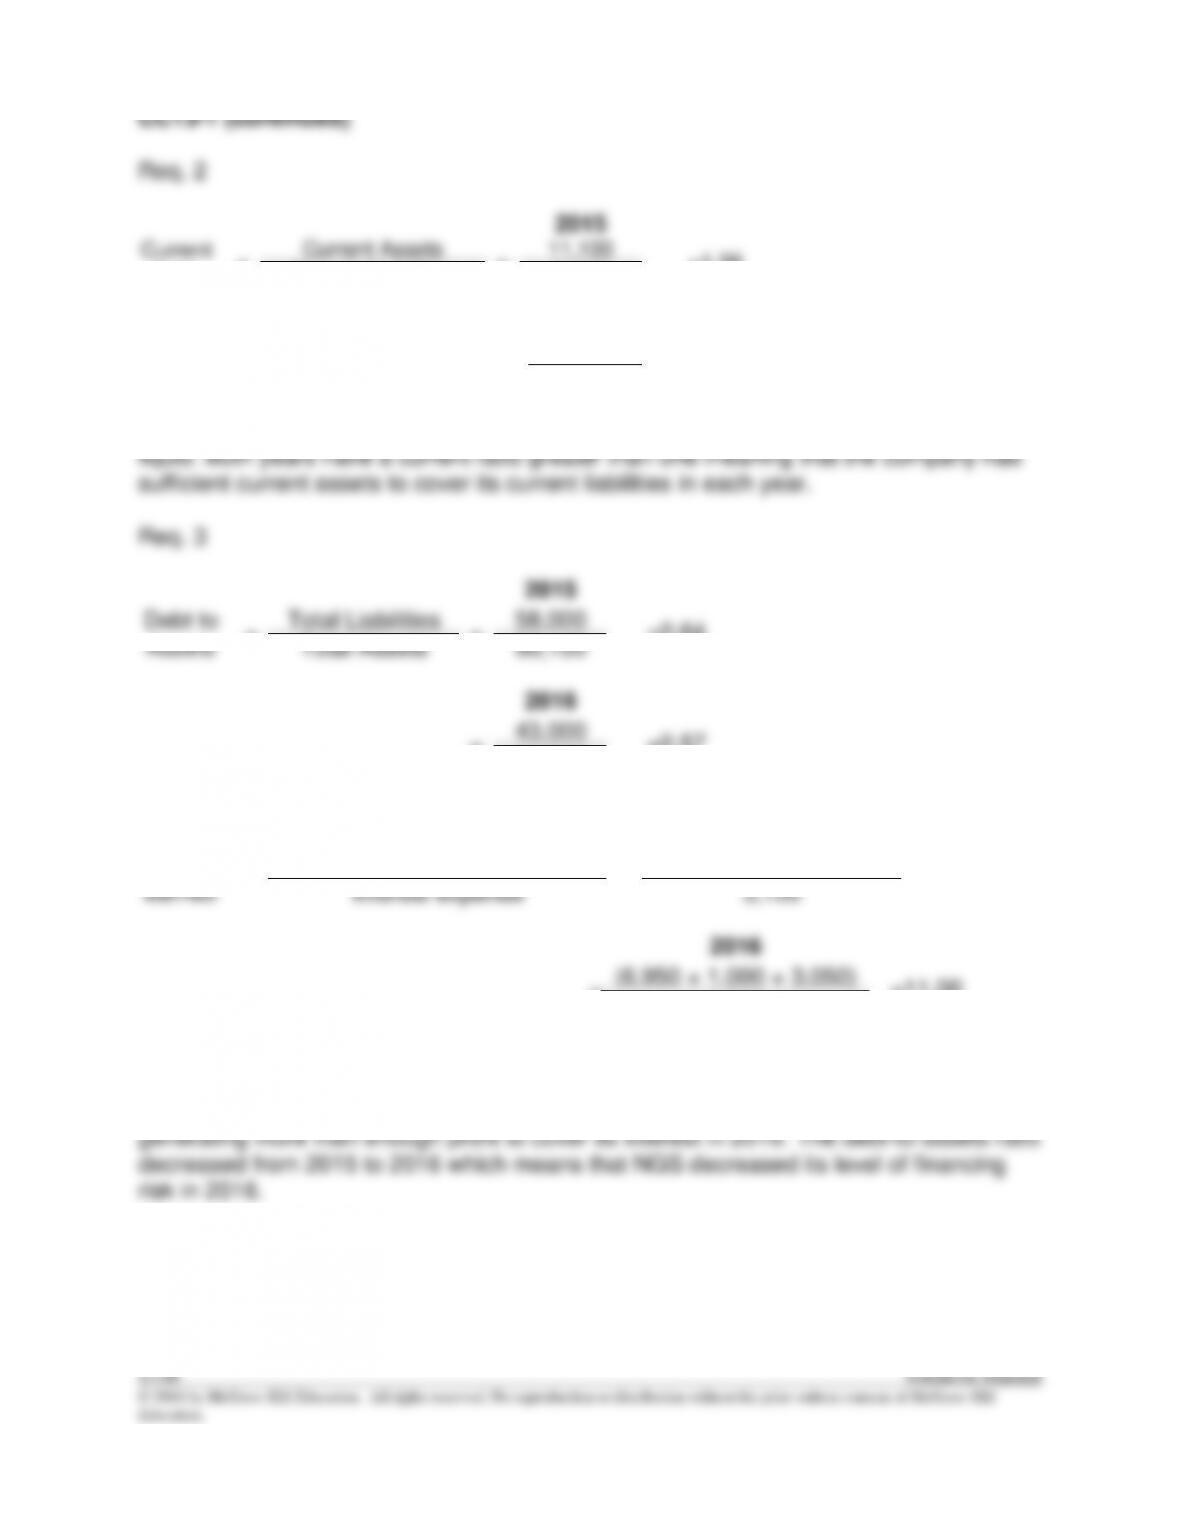
CC13-1 (continued)
Req. 2
2015
Current
Ratio
=
Current Assets
=
11,100
=1.39
Current Liabilities
8,000
2016
=
10,950
=1.37
8,000
By looking at the current ratio, it is difficult to determine in which year NGS was more
2015
Debt to
Assets
=
Total Liabilities
=
58,000
=0.64
Total Assets
90,100
2016
=
43,000
=0.57
74,950
2015
Times
interest
earned
=
Net income + Interest expense
+ Income tax expense
=
(2,100 + 3,100 + 800)
=1.94
Interest expense
3,100
2016
=
(6,950 + 1,000 + 3,050)
=11.00
1,000
NGS was more solvent in 2016. The times interest earned ratio indicates that NGS was