© 2016 by McGraw-Hill Education. All rights reserved. No reproduction or distribution without the prior written consent of McGraw-Hill
Education.
ANSWERS TO GROUP B PROBLEMS
PB13–1
Req. 1
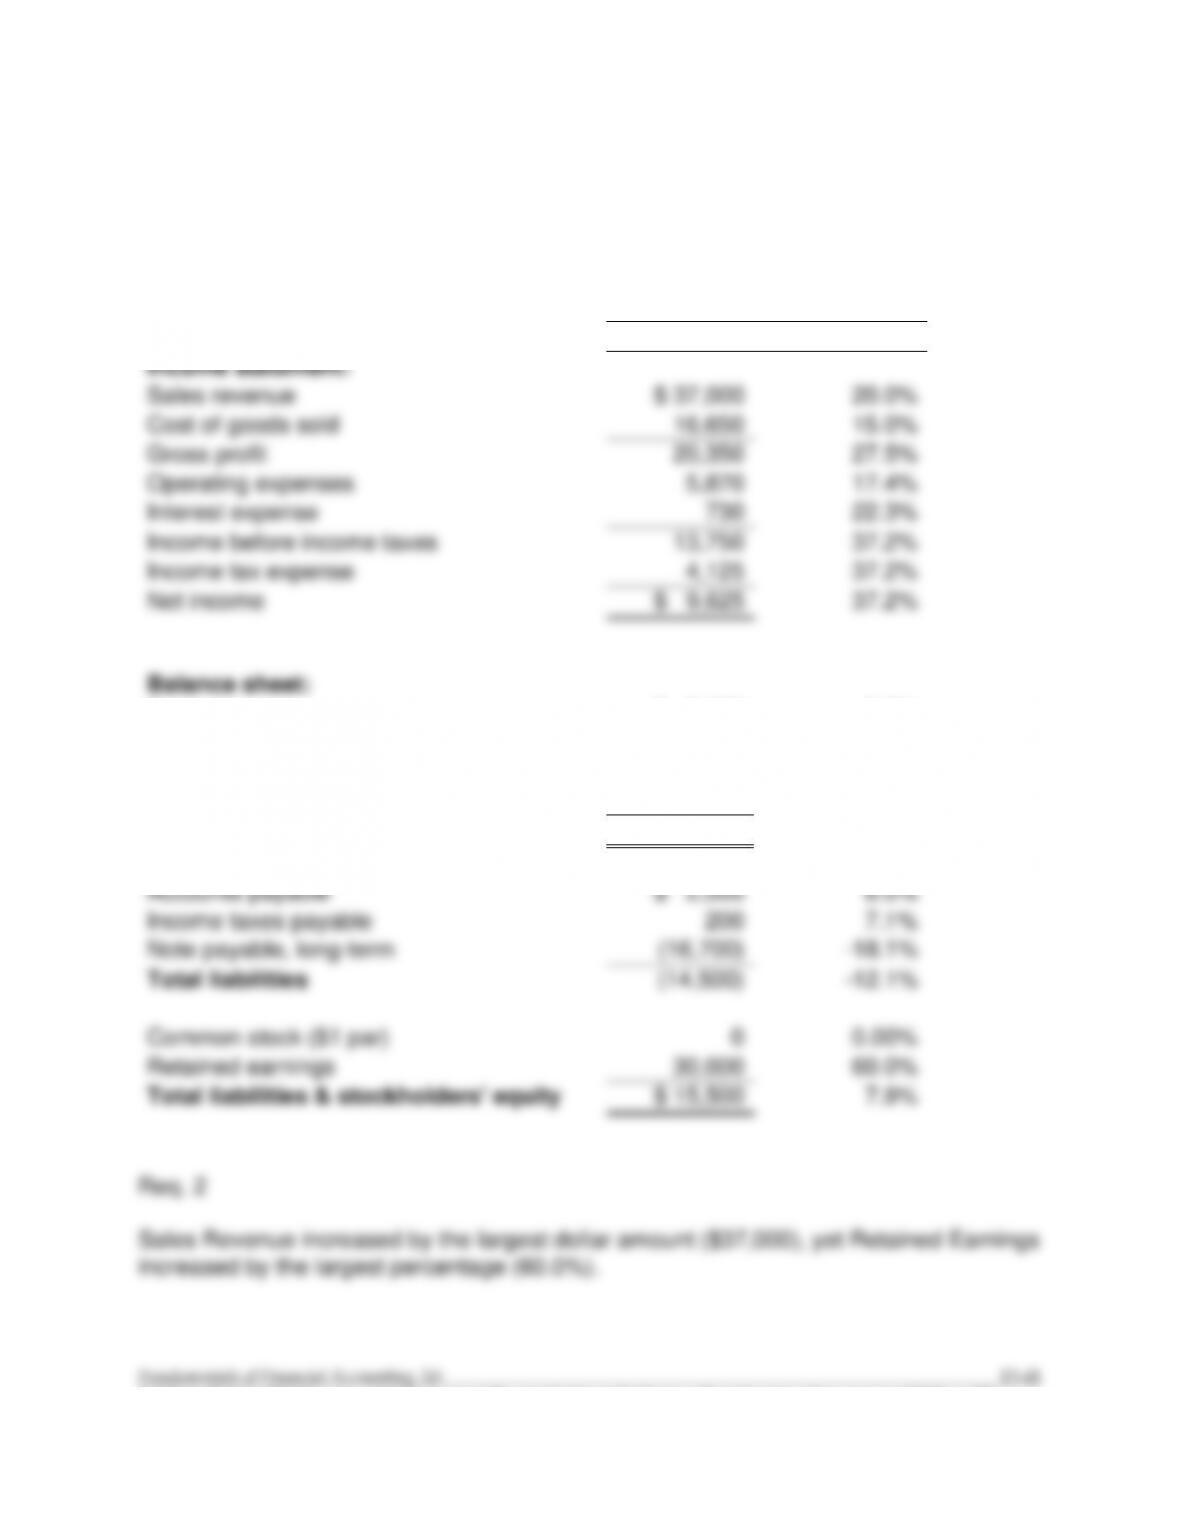
Tiger Audio Horizontal Analysis
Increase (Decrease)
in the current year (versus
the previous year)
Amount
Percentage
Income statement:
Sales revenue
$ 37,000
20.0%
Cost of goods sold
16,650
15.0%
Gross profit
20,350
27.5%
Operating expenses
5,870
17.4%
Interest expense
730
22.3%
Income before income taxes
13,750
37.2%
Income tax expense
4,125
37.2%
Net income
$ 9,625
37.2%
Balance sheet:
Cash
$ 2,000
5.3%
Accounts receivable (net)
2,500
15.6%
Inventory
3,000
13.6%
Property & equipment (net)
8,000
6.7%
Total Assets
$ 15,500
7.9%
Accounts payable
$ 2,000
8.0%
Income taxes payable
200
7.1%
Note payable, long-term
(16,700)
-18.1%
Total liabilities
(14,500)
–12.1%
Common stock ($1 par)
0
0.00%
Retained earnings
30,000
60.0%
Total liabilities & stockholders’ equity
$ 15,500
7.9%
Req. 2
Sales Revenue increased by the largest dollar amount ($37,000), yet Retained Earnings
increased by the largest percentage (60.0%).
PB13–2
Req. 1
Gross Profit Percentage =
Net Sales Revenue – Cost of Goods Sold
Net Sales Revenue
Current Year =
$222,000 – $127,650
=
42.5%
$222,000
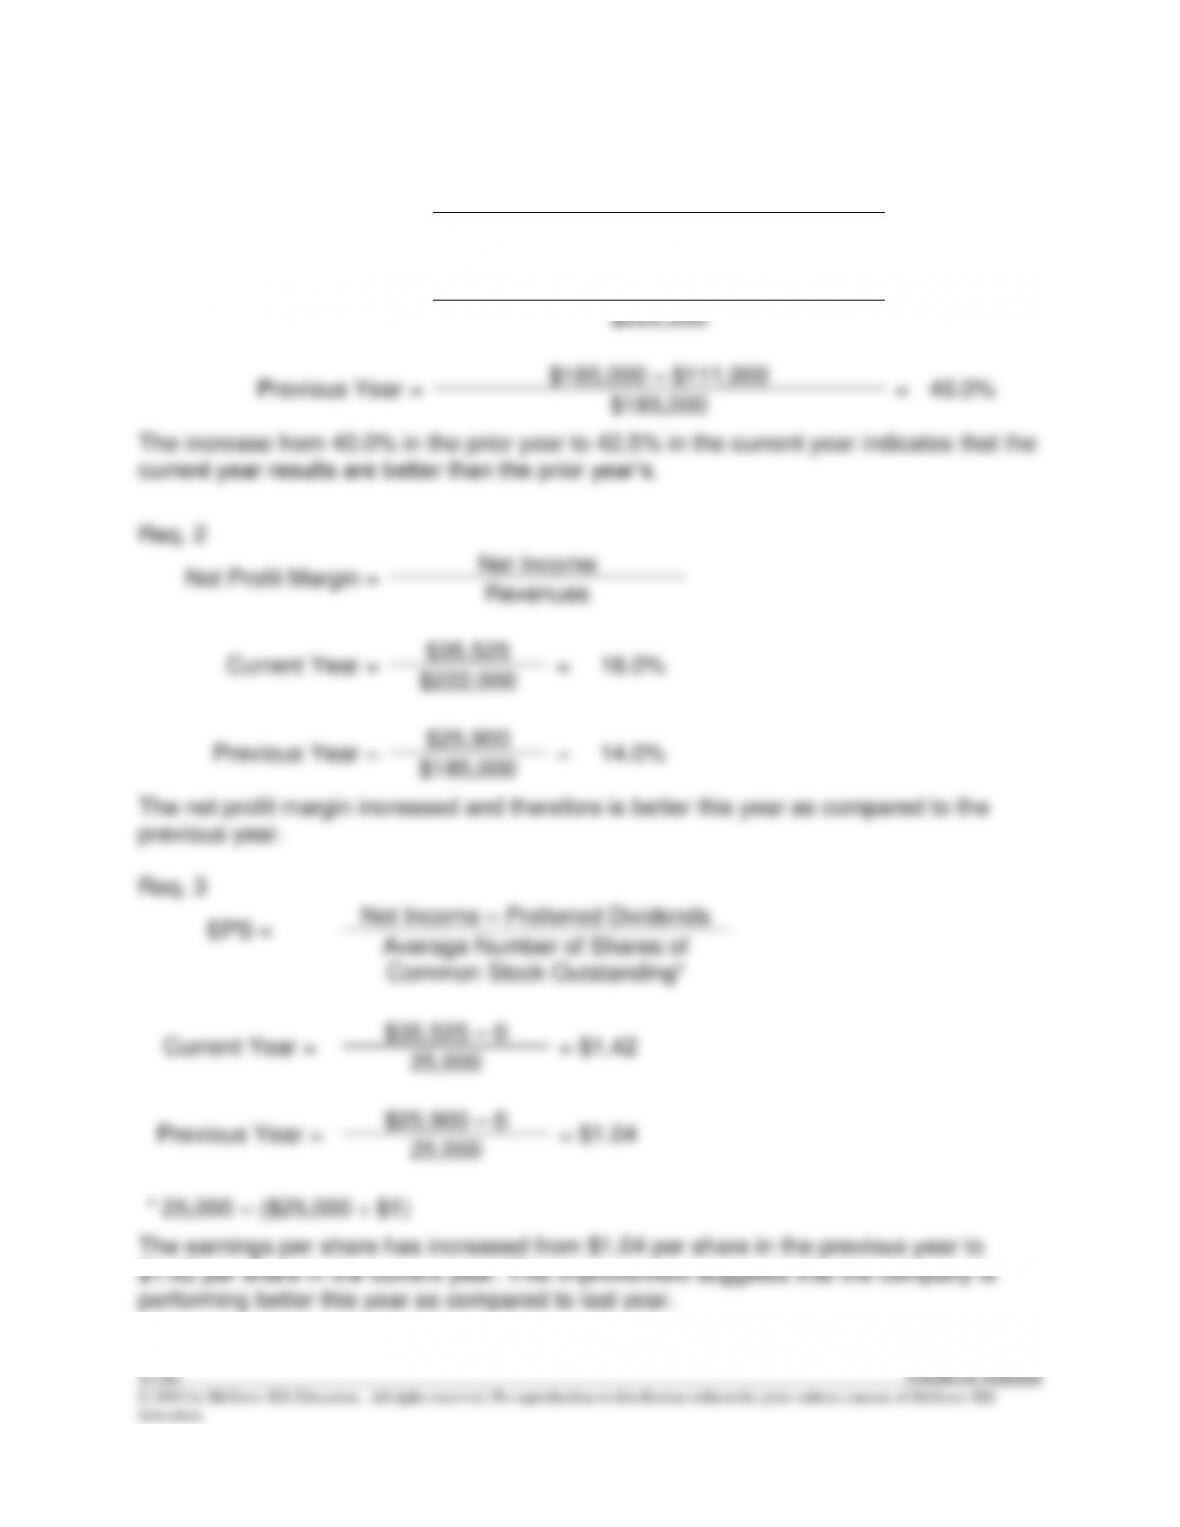
Previous Year =
$185,000 – $111,000
=
40.0%
$185,000
The increase from 40.0% in the prior year to 42.5% in the current year indicates that the
current year results are better than the prior year’s.
Req. 2
Net Profit Margin =
Net Income
Revenues
Current Year =
$35,525
=
16.0%
$222,000
Previous Year =
$25,900
=
14.0%
$185,000
The net profit margin increased and therefore is better this year as compared to the
previous year.
Req. 3
EPS =
Net Income – Preferred Dividends
Average Number of Shares of
Common Stock Outstanding*
Current Year =
$35,525 – 0
= $1.42
25,000
Previous Year =
$25,900 – 0
= $1.04
25,000
* 25,000 = ($25,000 ÷ $1)
PB13–2 (continued)
© 2016 by McGraw-Hill Education. All rights reserved. No reproduction or distribution without the prior written consent of McGraw-Hill
Education.
Req. 4
Return on Equity (ROE) =
Net Income – Preferred Dividends
Average Stockholders’ Equity
Current Year =
$35,525 – 0
=
39.5%
$90,000*
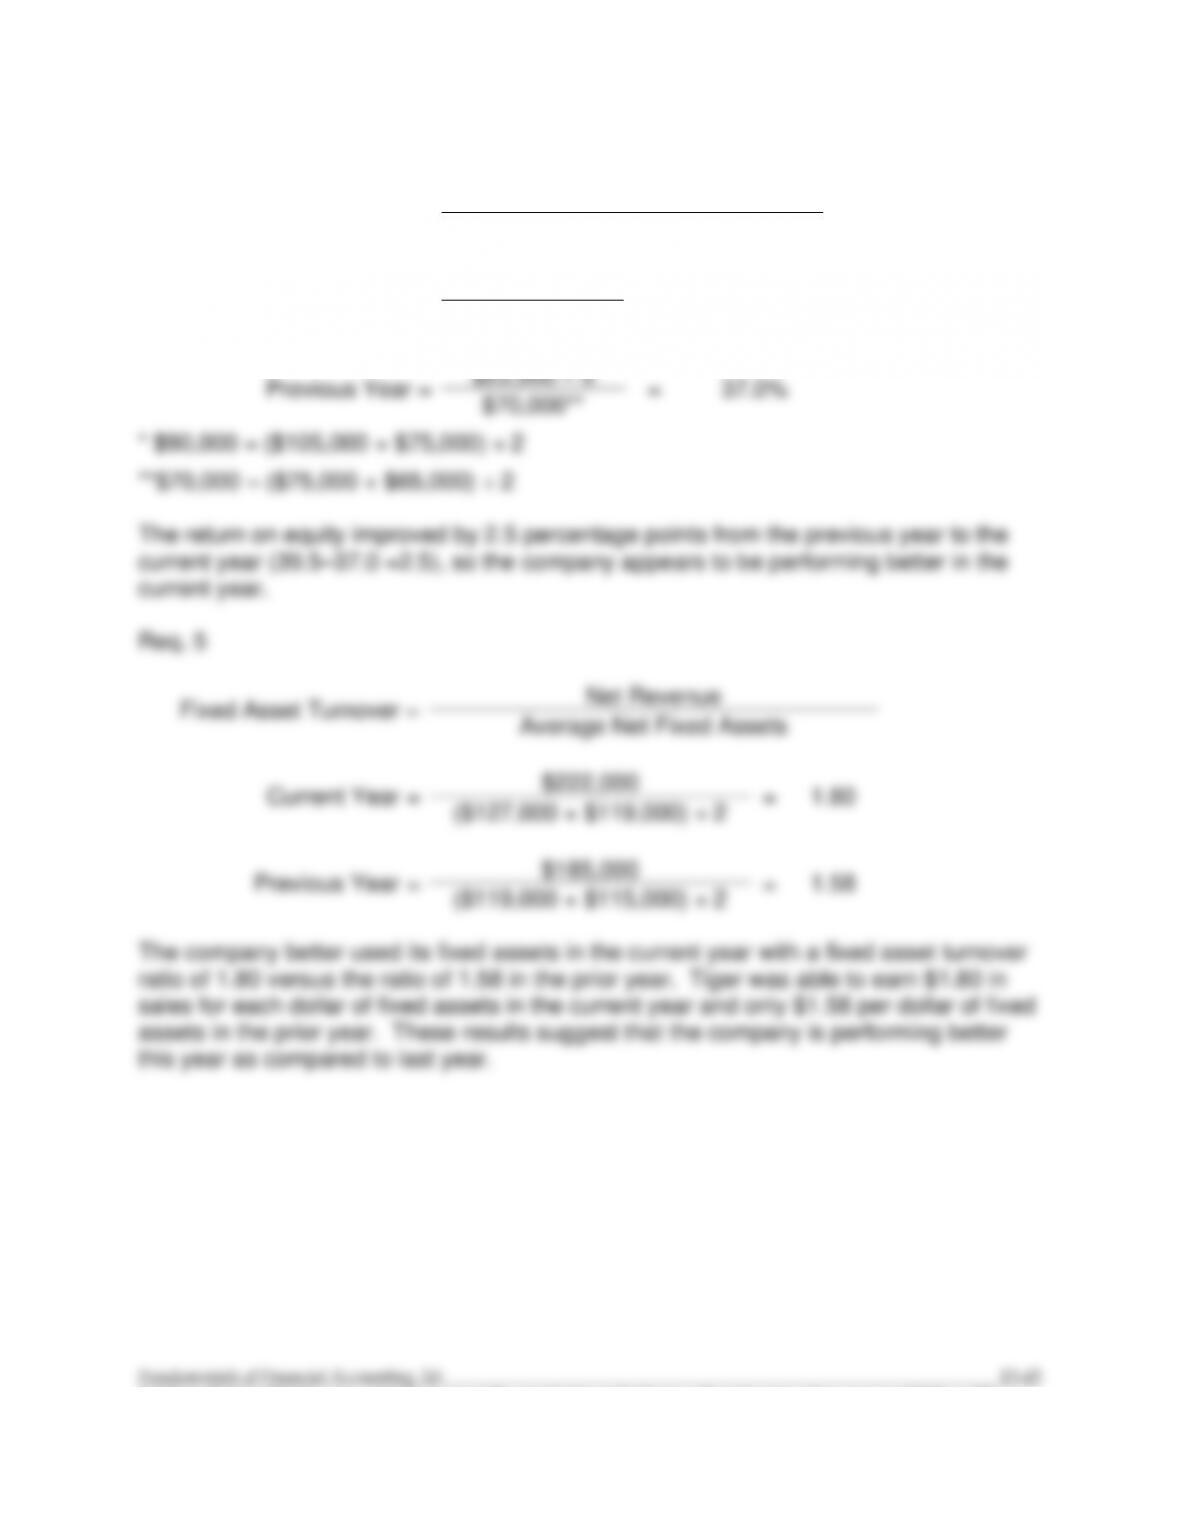
Previous Year =
$25,900 – 0
=
37.0%
$70,000**
* $90,000 = ($105,000 + $75,000) ÷ 2
**$70,000 = ($75,000 + $65,000) ÷ 2
The return on equity improved by 2.5 percentage points from the previous year to the
current year (39.5–37.0 =2.5), so the company appears to be performing better in the
current year.
Req. 5
Fixed Asset Turnover =
Net Revenue
Average Net Fixed Assets
Current Year =
$222,000
=
1.80
($127,000 + $119,000) ÷ 2
Previous Year =
$185,000
=
1.58
($119,000 + $115,000) ÷ 2
The company better used its fixed assets in the current year with a fixed asset turnover
ratio of 1.80 versus the ratio of 1.58 in the prior year. Tiger was able to earn $1.80 in
sales for each dollar of fixed assets in the current year and only $1.58 per dollar of fixed
assets in the prior year. These results suggest that the company is performing better
this year as compared to last year.
PB13–2 (continued)
Req. 6
Debt-to–Assets =
Total Liabilities
Total Assets
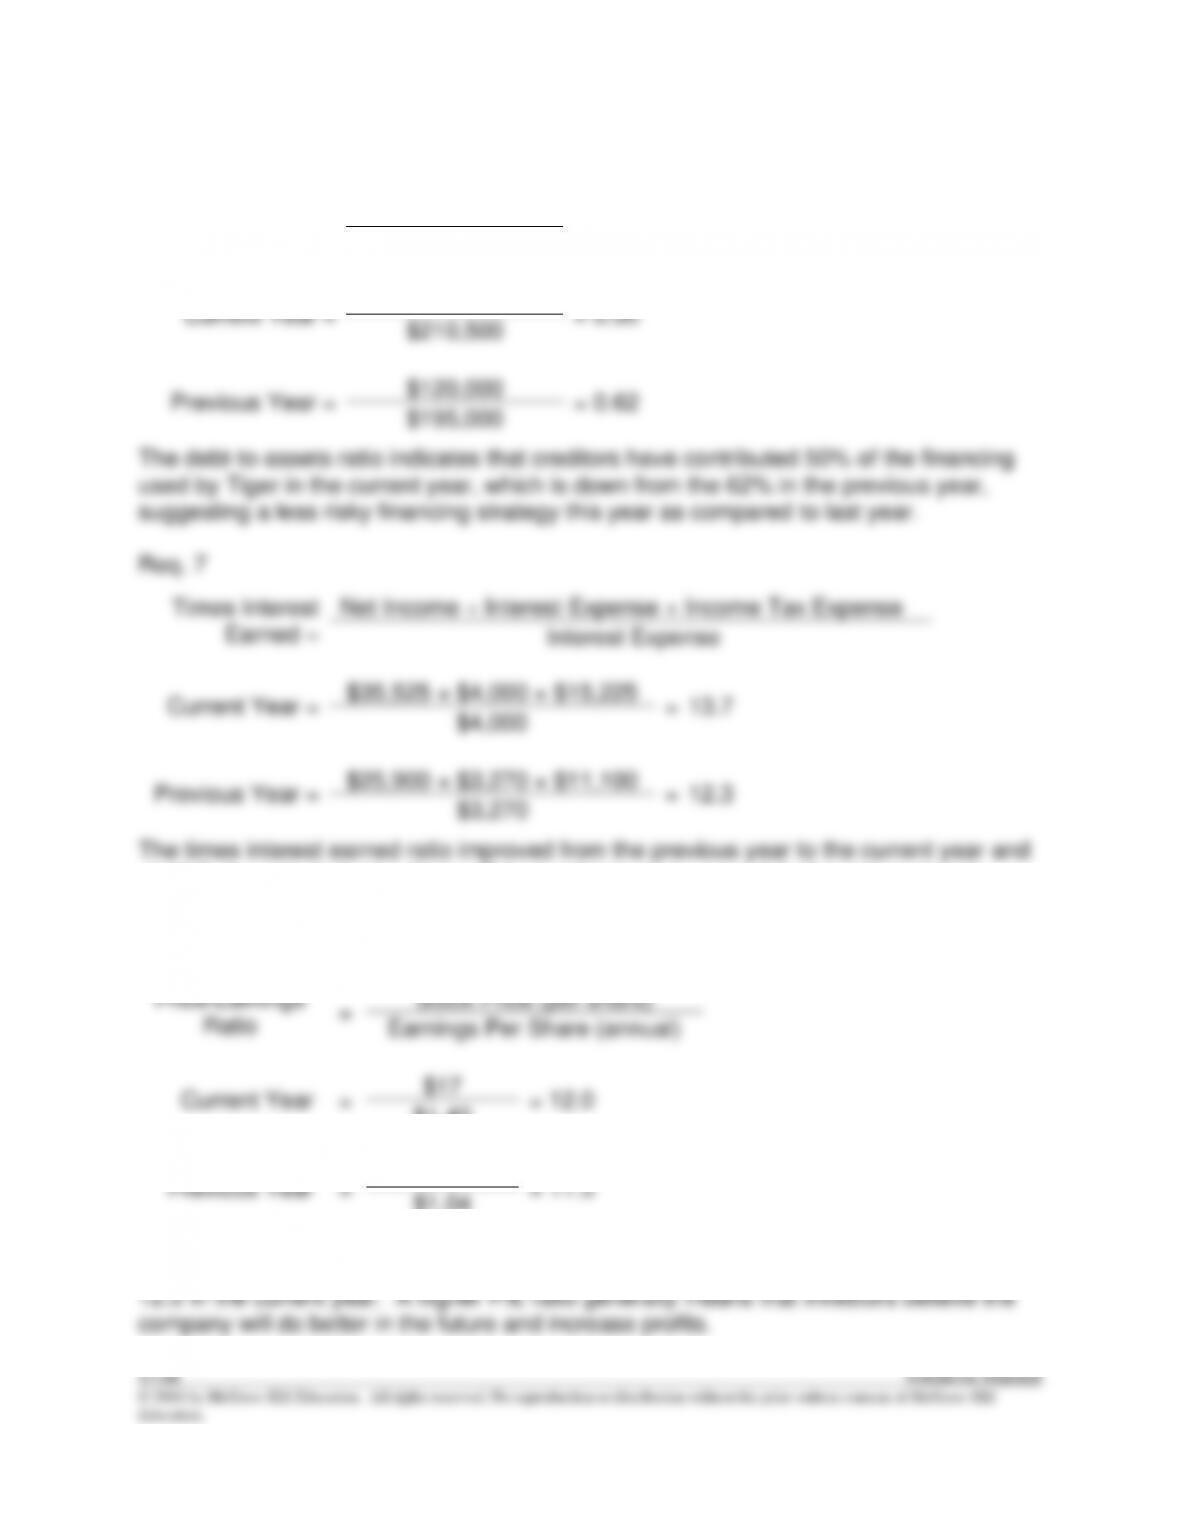
Current Year =
$105,500
= 0.50
$210,500
Previous Year =
$120,000
= 0.62
$195,000
Net Income + Interest Expense + Income Tax Expense
© 2016 by McGraw-Hill Education. All rights reserved. No reproduction or distribution without the prior written consent of McGraw-Hill
Education.
PB13–3
Req. 1
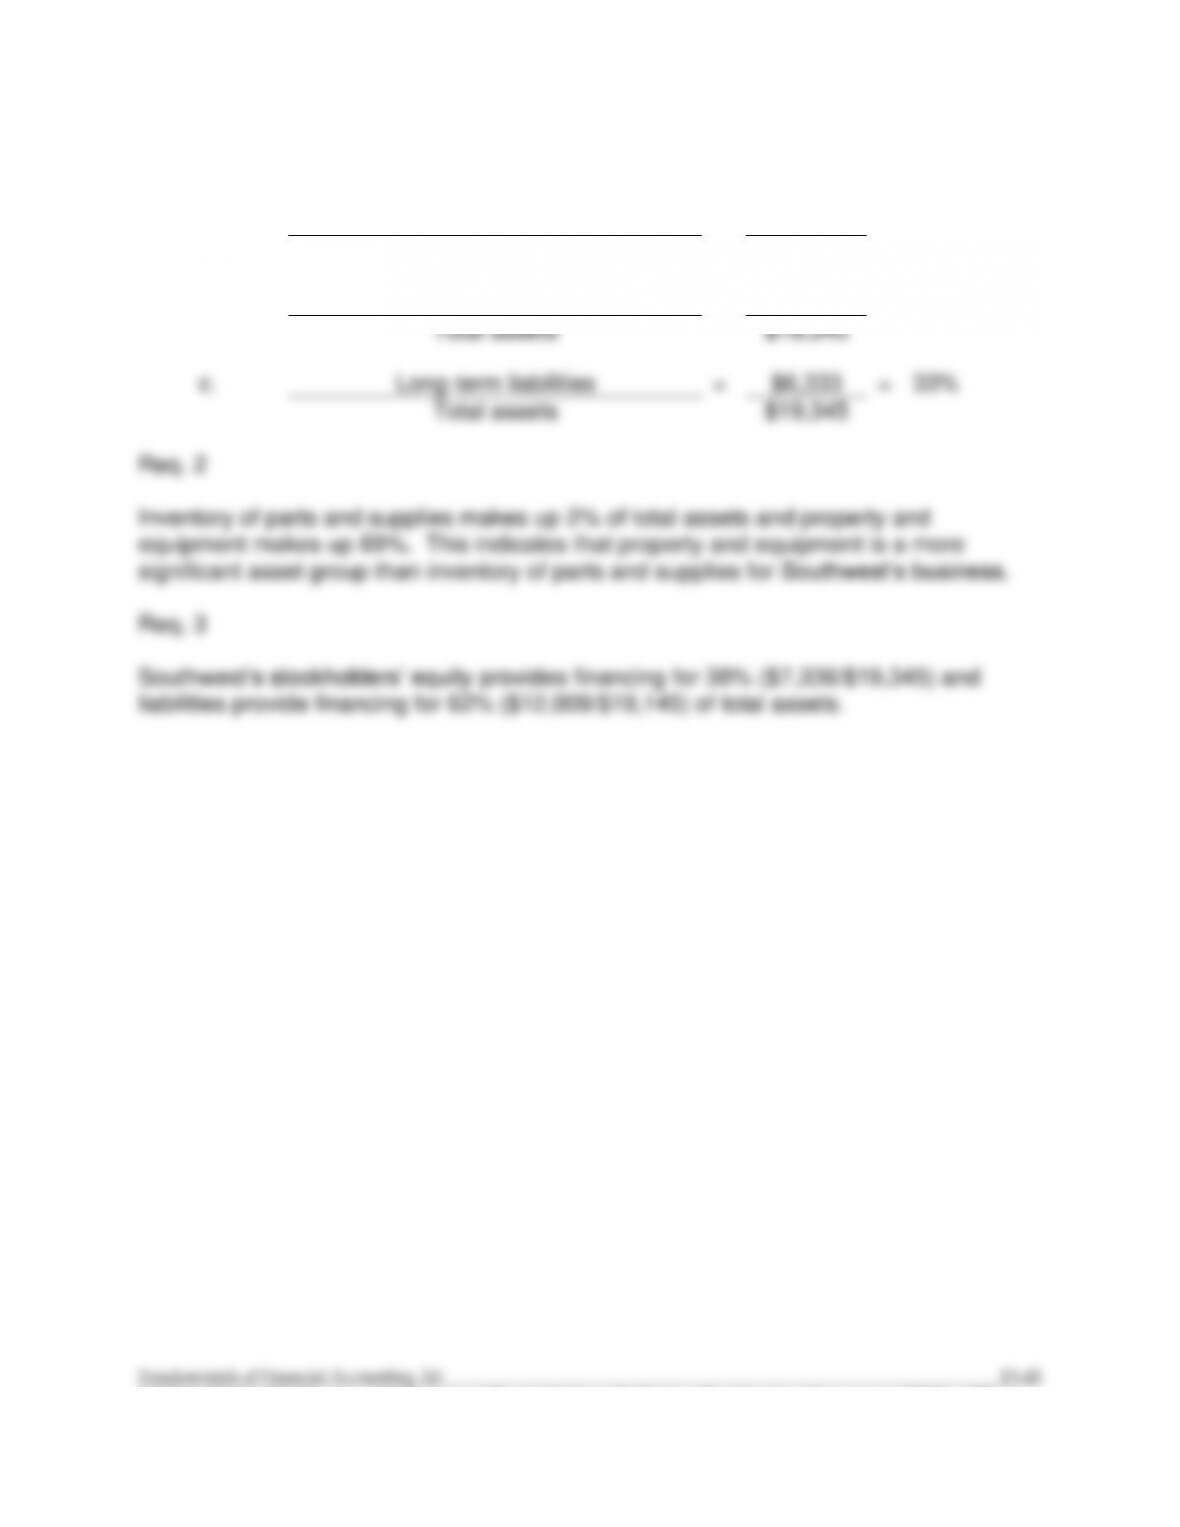
a.
Inventory of Parts and Supplies
=
$467
=
2%
Total assets
$19,345
b.
Property and Equipment, Net
=
$13,389
=
69%
Total assets
$19,345
c.
Long-term liabilities
=
$6,333
=
33%
Total assets
$19,345
PB13–4
Req. 1
a.
Fuel, oil, repairs, and maintenance
=
$6,843
=
39%
Sales revenues
$17,699
b.
Other operating expenses
=
$4,543
=
26%
Sales revenues
$17,699
c.
Net income
=
$754
=
4%
Sales revenues
$17,699
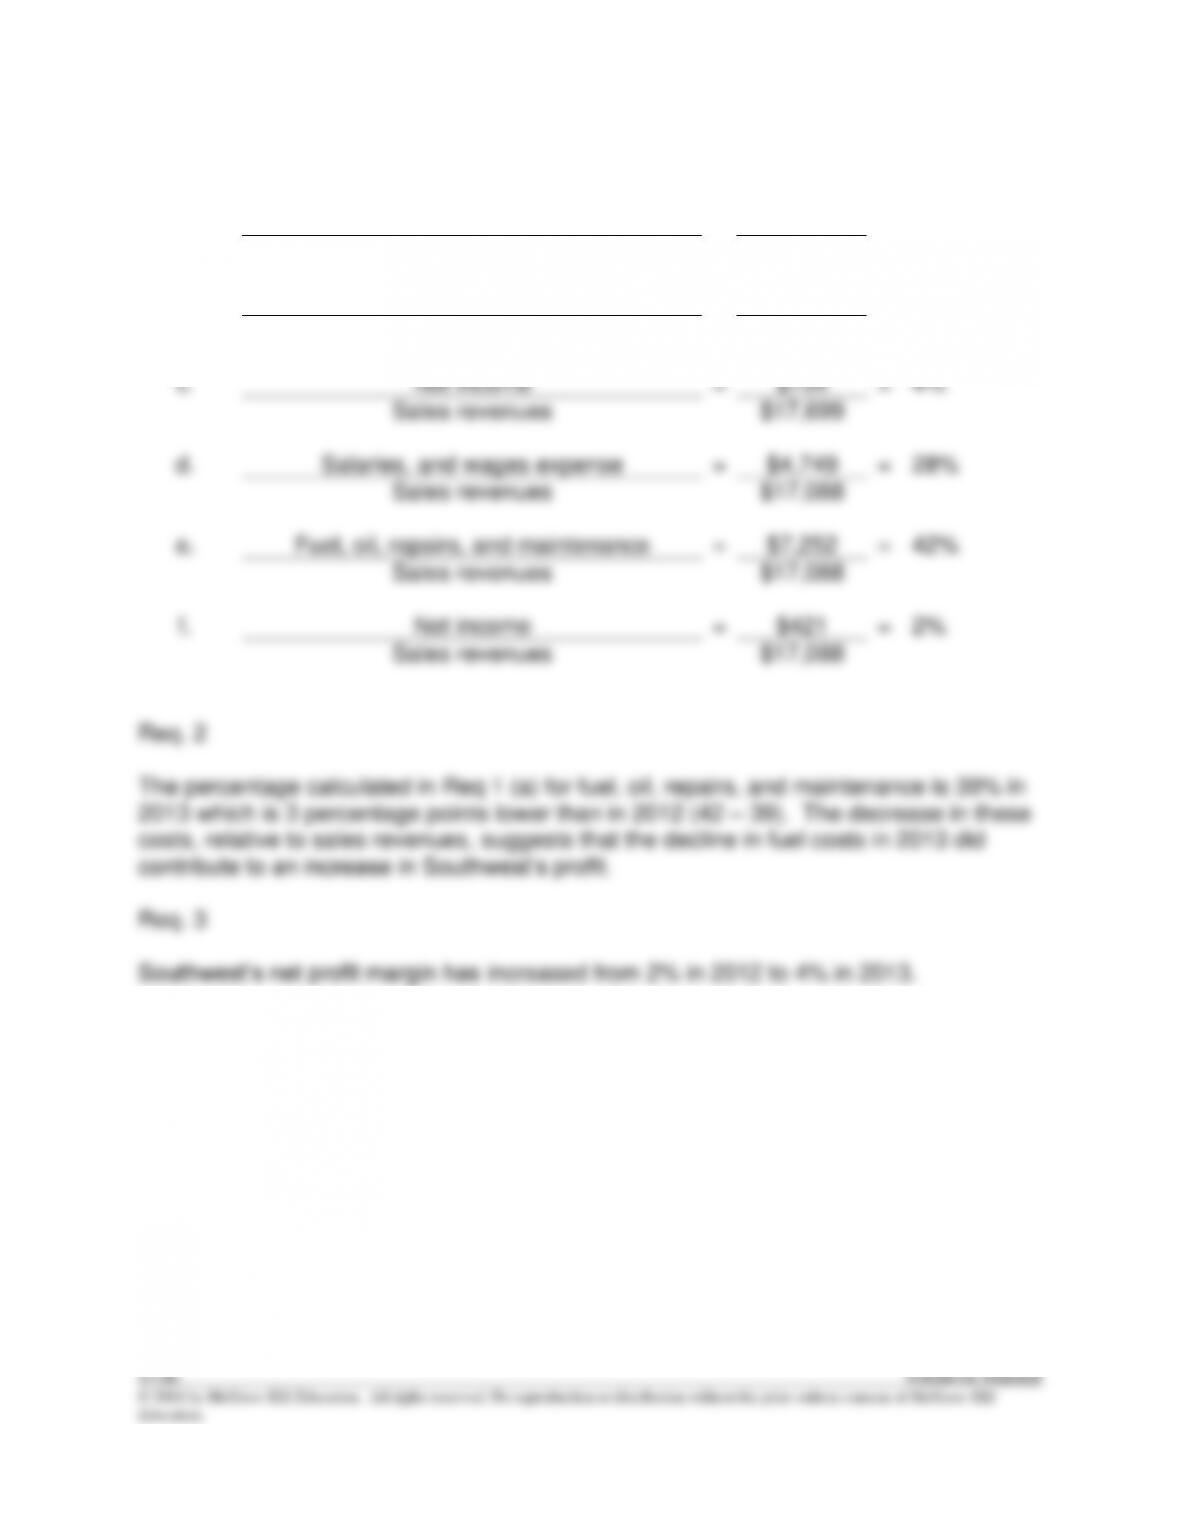
d.
Salaries, and wages expense
=
$4,749
=
28%
Sales revenues
$17,088
e.
Fuel, oil, repairs, and maintenance
=
$7,252
=
42%
Sales revenues
$17,088
f.
Net income
=
$421
=
2%
Sales revenues
$17,088
© 2016 by McGraw-Hill Education. All rights reserved. No reproduction or distribution without the prior written consent of McGraw-Hill
Education.
PB13–5
Req. 1
Three profitability ratios to be considered are (1) Gross profit percentage, (2) Net profit
margin, and (3) Return on equity. Hasbro’s gross profit percentage exceeds Mattel’s,
but Mattel’s “bottom line” net income is greater, as indicated by its larger net profit
(2) Inventory turnover ratio, and (3) Current ratio. Mattel has faster receivables turnover,
inventory turnover and current ratio, indicating that Mattel is more liquid than Hasbro.
Req. 3
Only the debt-to-assets ratio is available to evaluate solvency. This ratio indicates the
proportion of total assets that are financed by creditors, and indicates that Mattel has
PB13–6
Req. 1
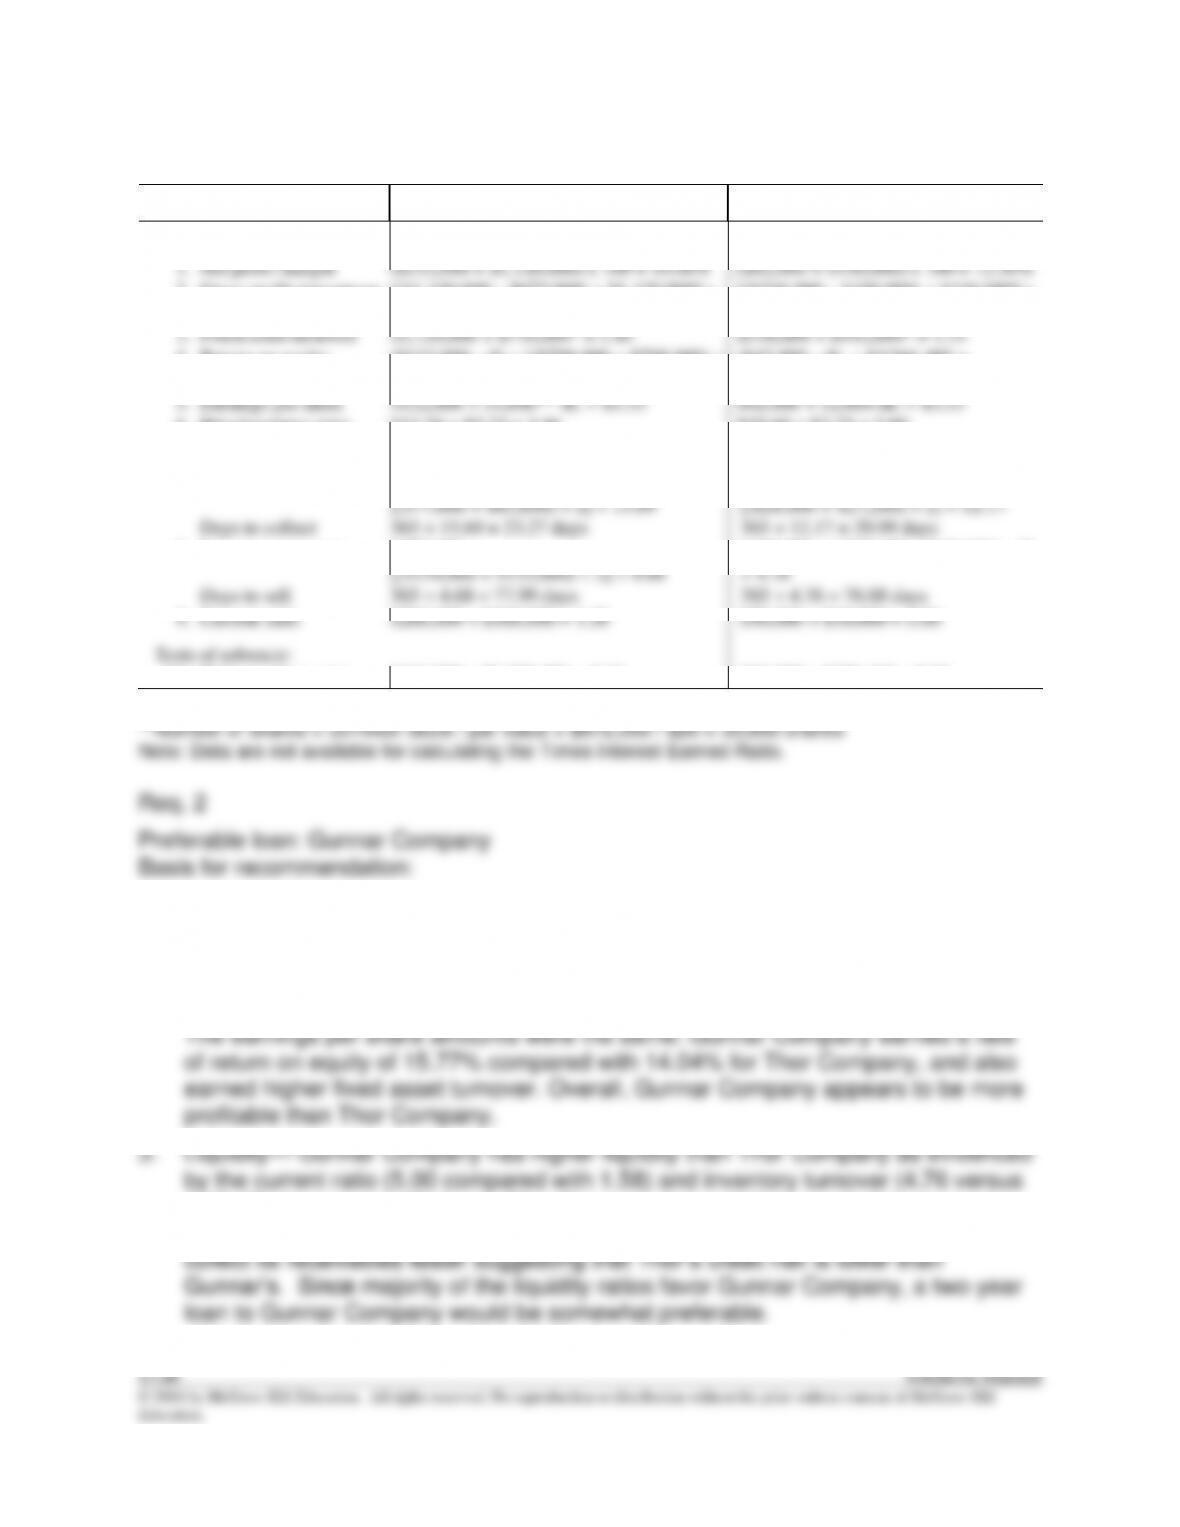
Ratio
Thor Company
Gunnar Company
Tests of profitability:
1.
Net profit margin
($112,000 ÷ $1,120,000) x 100 = 10.00%
($42,000 ÷ $336,000) x 100 = 12.50%
2.
Gross profit percentage
[($1,120,000 – $672,000) ÷ $1,120,000] x
100 = 40.00%
[($336,000 – $180,000) ÷ $336,000] x
100 = 46.43%
3.
Fixed asset turnover
$1,120,000 ÷ $770,000* = 1.45
$336,000 ÷ $192,000* = 1.75
4.
Return on equity
($112,000 – 0) ÷ [($798,000 + $798,000) ÷
2] x 100 = 14.04%
($42,000 – 0) ÷ [($266,400 +
$266,400) ÷ 2] x 100 = 15.77%
5.
Earnings per share
$112,000 ÷ 33,600** sh. = $3.33
$42,000 ÷ 12,600 sh. = $3.33
6.
Price/earnings ratio
$13.20 ÷ $3.33 = 3.96
$19.60 ÷ $3.33 = 5.89
Tests of liquidity:
7.
Receivables turnover
$1,120,000 ÷
[($77,000 + $65,800) ÷ 2] = 15.69
$336,000 ÷
[($28,000 + $27,200) ÷ 2] = 12.17
Days to collect
365 ÷ 15.69 = 23.27 days
365 ÷ 12.17 = 29.99 days
8.
Inventory turnover
$672,000 ÷
[($154,000 + $133,000) ÷ 2] = 4.68
$180,000 ÷ [($30,000 + $45,600) ÷ 2]
= 4.76
Days to sell
365 ÷ 4.68 = 77.99 days
365 ÷ 4.76 = 76.68 days
9.
Current ratio
$266,000 ÷ $168,000 = 1.58
$90,000 ÷ $18,000 = 5.00
Tests of solvency:
10.
Debt-to-assets ratio
$434,000 ÷ $1,232,000 = 0.35
$84,000 ÷ $350,400 = 0.24
* The problem indicates that the end-of-year ending balance approximates the average for the year.
1. Each set of financial statements is audited and each received an unqualified
opinion; therefore, there is no preference in terms of credibility of information.
2. Profitability—Gunnar Company had a higher gross profit percentage (46.43%
versus 40.00%) and net profit margin than Thor Company (12.50% versus 10.00%).
4.68; 77 days versus 78 days). Thor Company has a higher receivables turnover
(15.69 versus 12.17; 23 days versus 30 days), which indicates that Thor does
© 2016 by McGraw-Hill Education. All rights reserved. No reproduction or distribution without the prior written consent of McGraw-Hill
Education.
PB13–6 (continued)
4. Solvency—Gunnar Company clearly is in a less risky position on this factor. Gunnar
Company financed its operations by obtaining only 24% of its total assets using
5. A higher price/earnings ratio indicates that investors in the stock market believe
6. Constraint—The above analysis is based on only one year. Although this year is
relevant (it is the most recent), it limits the ability to conduct trend analyses.
PB13–7
1. Company A shows high EPS, high debt to assets, and high return on equity.
This suggests that Company A has a high level of debt, but is able to use it to
2. The low level of liquidity for Company A (low current ratio) is a concern given its
high debt-to-assets ratio.
3. Company A has a low price/earnings ratio. This often is an indication of limited
growth opportunities or concern in the market. In contrast, Company B has a