Education.
CP13–6 (continued)
(1.84 vs. 1.75), faster receivables turnover (23.82 vs. 15.00; 15.32 vs. 24.33 days to
collect), and faster inventory turnover (9.53 vs. 2.55; 38 vs. 143 days to sell). These
achievements are particularly noteworthy because they have not come at the expense
of reduced profits (as noted above).
CP13–7
1. Company A has a high level of liquidity as shown by the current ratio but
because the inventory turnover is low it is likely that much of the current assets
2. In addition to liquidity concerns, Company A shows a high debt–to-assets ratio
3. Company A does not seem to have good growth opportunities. The market has
valued Company A at a low price/earnings ratio.
13-32 Solutions Manual
© 2016 by McGraw-Hill Education. All rights reserved. No reproduction or distribution without the prior written consent of McGraw-Hill
Education.
ANSWERS TO GROUP A PROBLEMS
PA13–1
Req. 1
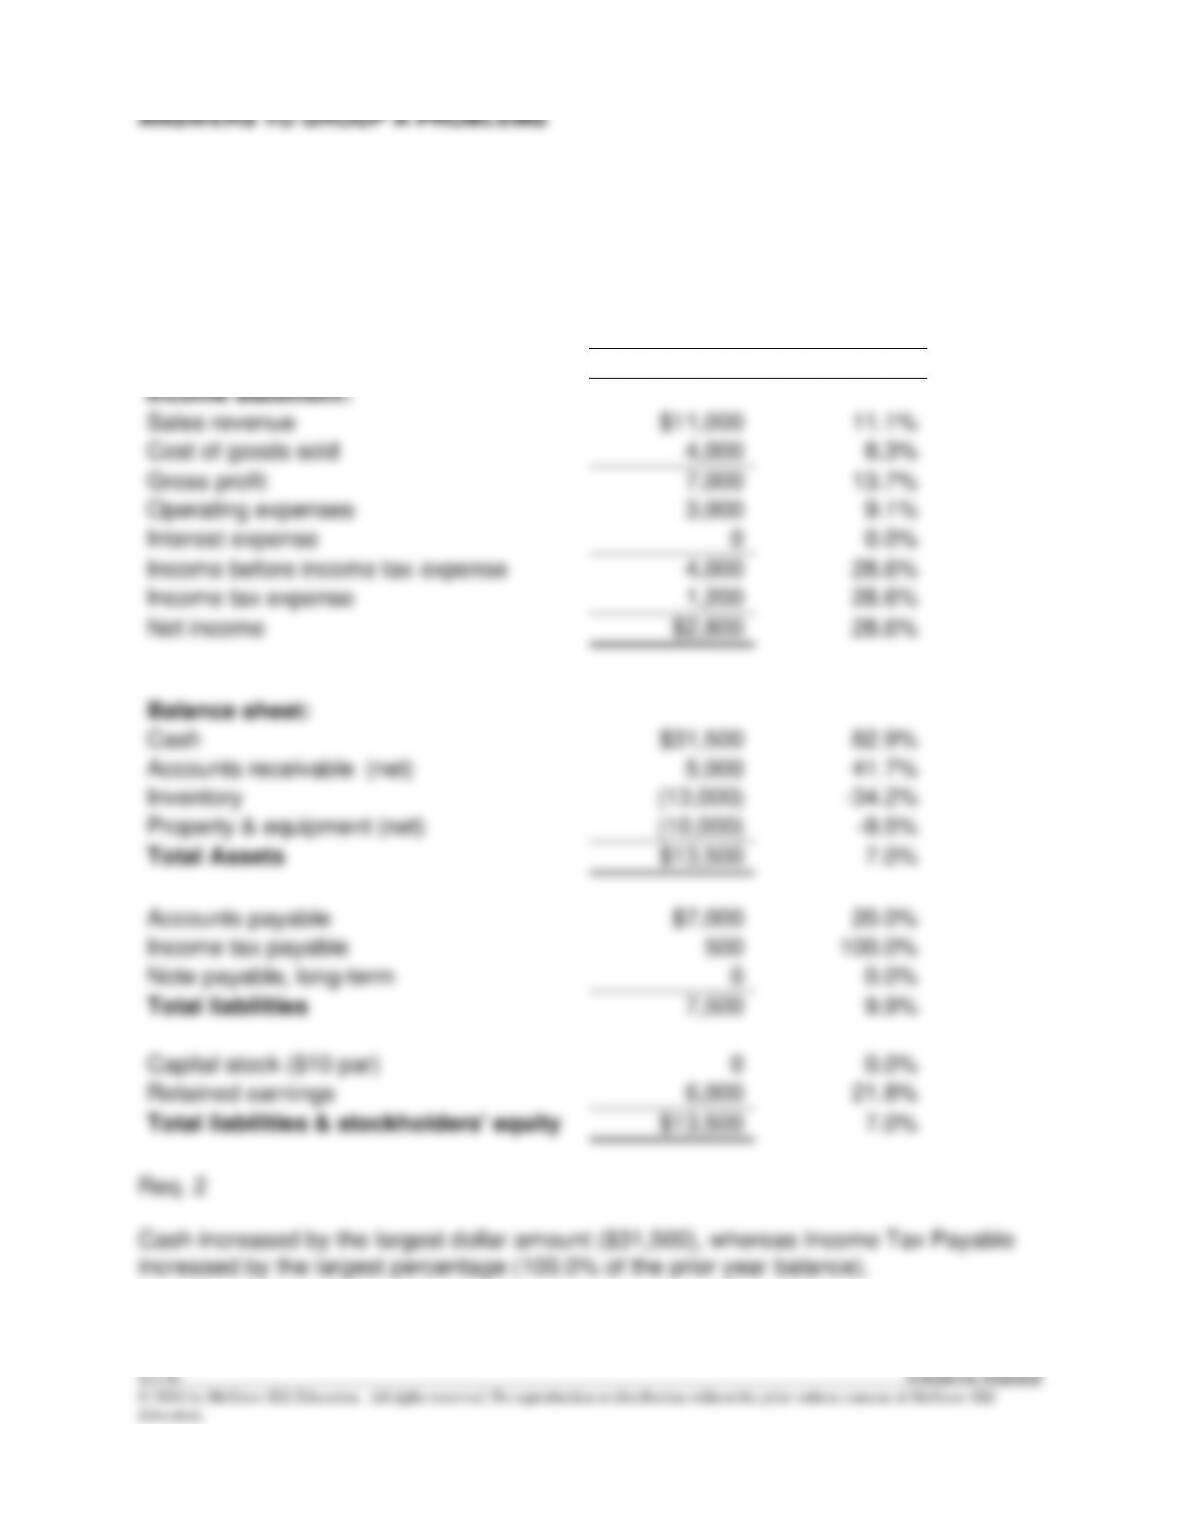
Pinnacle Plus Horizontal Analysis
Increase (Decrease)
in the current year (versus
the previous year)
Amount
Percentage
Income statement:
Sales revenue
$11,000
11.1%
Cost of goods sold
4,000
8.3%
Gross profit
7,000
13.7%
Operating expenses
3,000
9.1%
Interest expense
0
0.0%
Income before income tax expense
4,000
28.6%
Income tax expense
1,200
28.6%
Net income
$2,800
28.6%
Balance sheet:
Cash
$31,500
82.9%
Accounts receivable (net)
5,000
41.7%
Inventory
(13,000)
-34.2%
Property & equipment (net)
(10,000)
-9.5%
Total Assets
$13,500
7.0%
Accounts payable
$7,000
20.0%
Income tax payable
500
100.0%
Note payable, long-term
0
0.0%
Total liabilities
7,500
9.9%
Capital stock ($10 par)
0
0.0%
Retained earnings
6,000
21.8%
Total liabilities & stockholders’ equity
$13,500
7.0%
Req. 2
Cash increased by the largest dollar amount ($31,500), whereas Income Tax Payable
increased by the largest percentage (100.0% of the prior year balance).
=
=
PA13–2
Req. 1
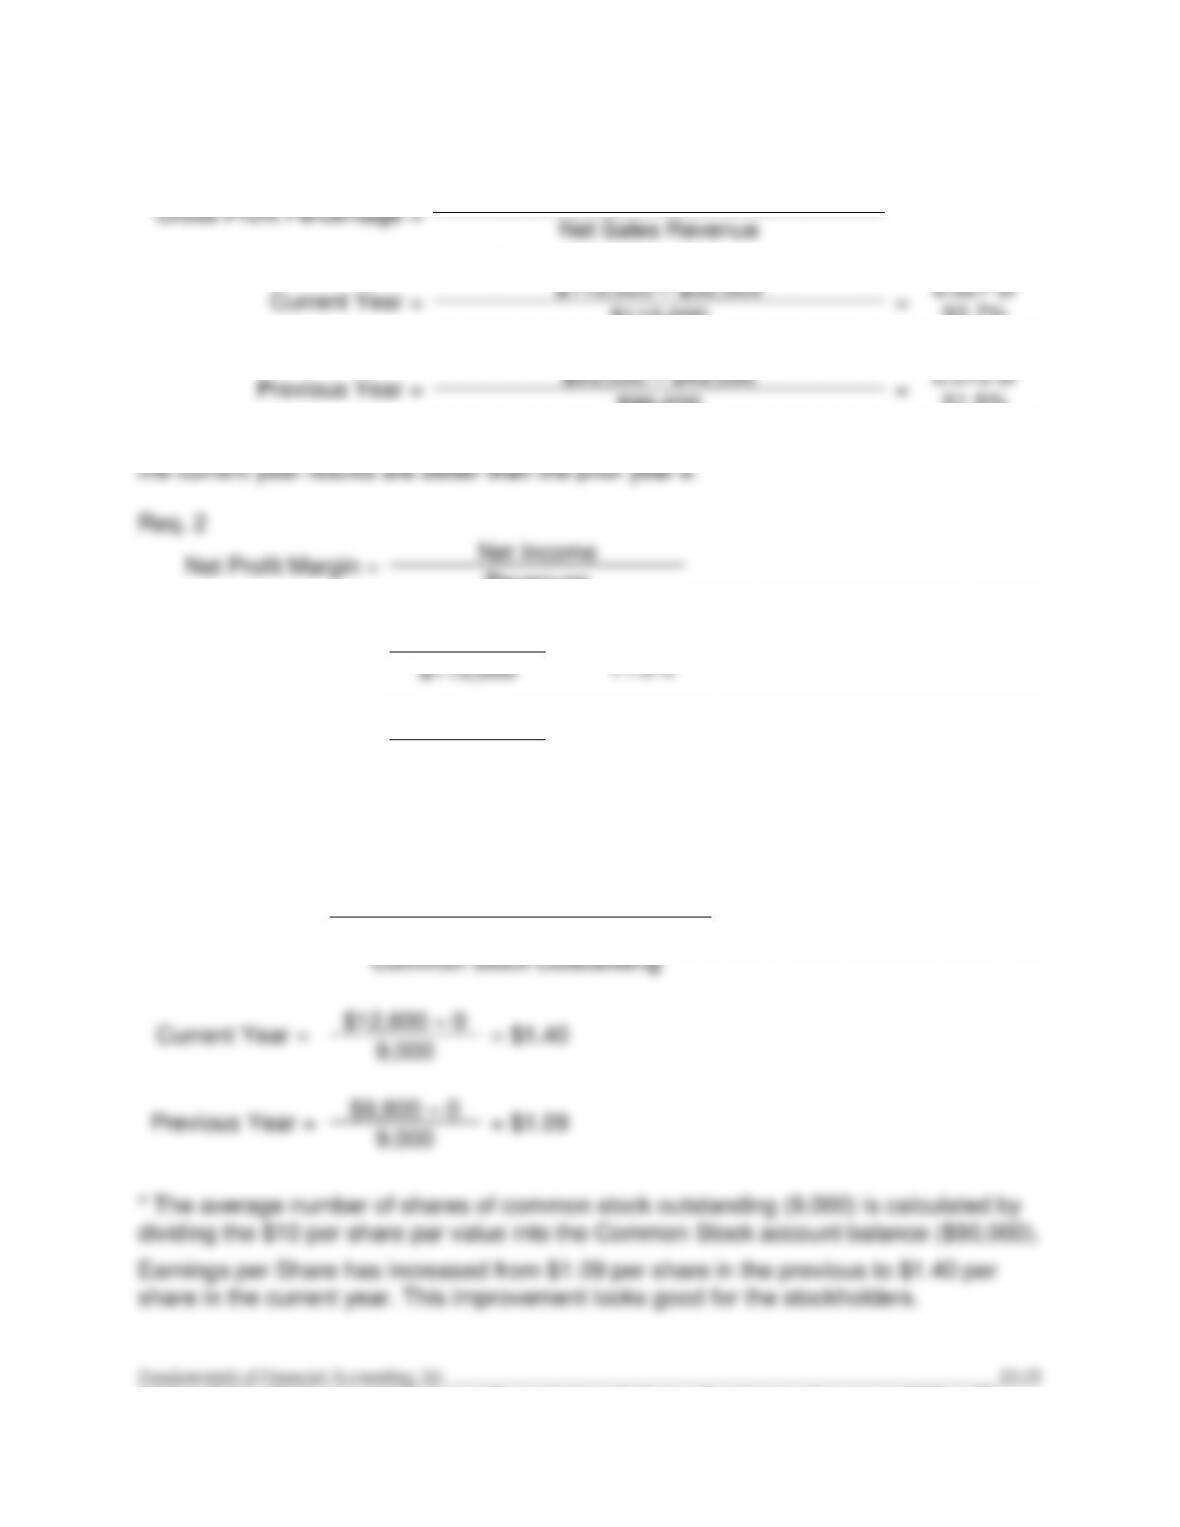
Gross Profit Percentage =
Net Sales Revenue – Cost of Goods Sold
Net Sales Revenue
Current Year =
$110,000 – $52,000
=
0.527 or
52.7%
$110,000
Previous Year =
$99,000 – $48,000
=
0.515 or
51.5%
$99,000
The increase from 51.5% in the prior year to 52.7% in the current year recognizes that
PA13–2 (continued)
Req. 4
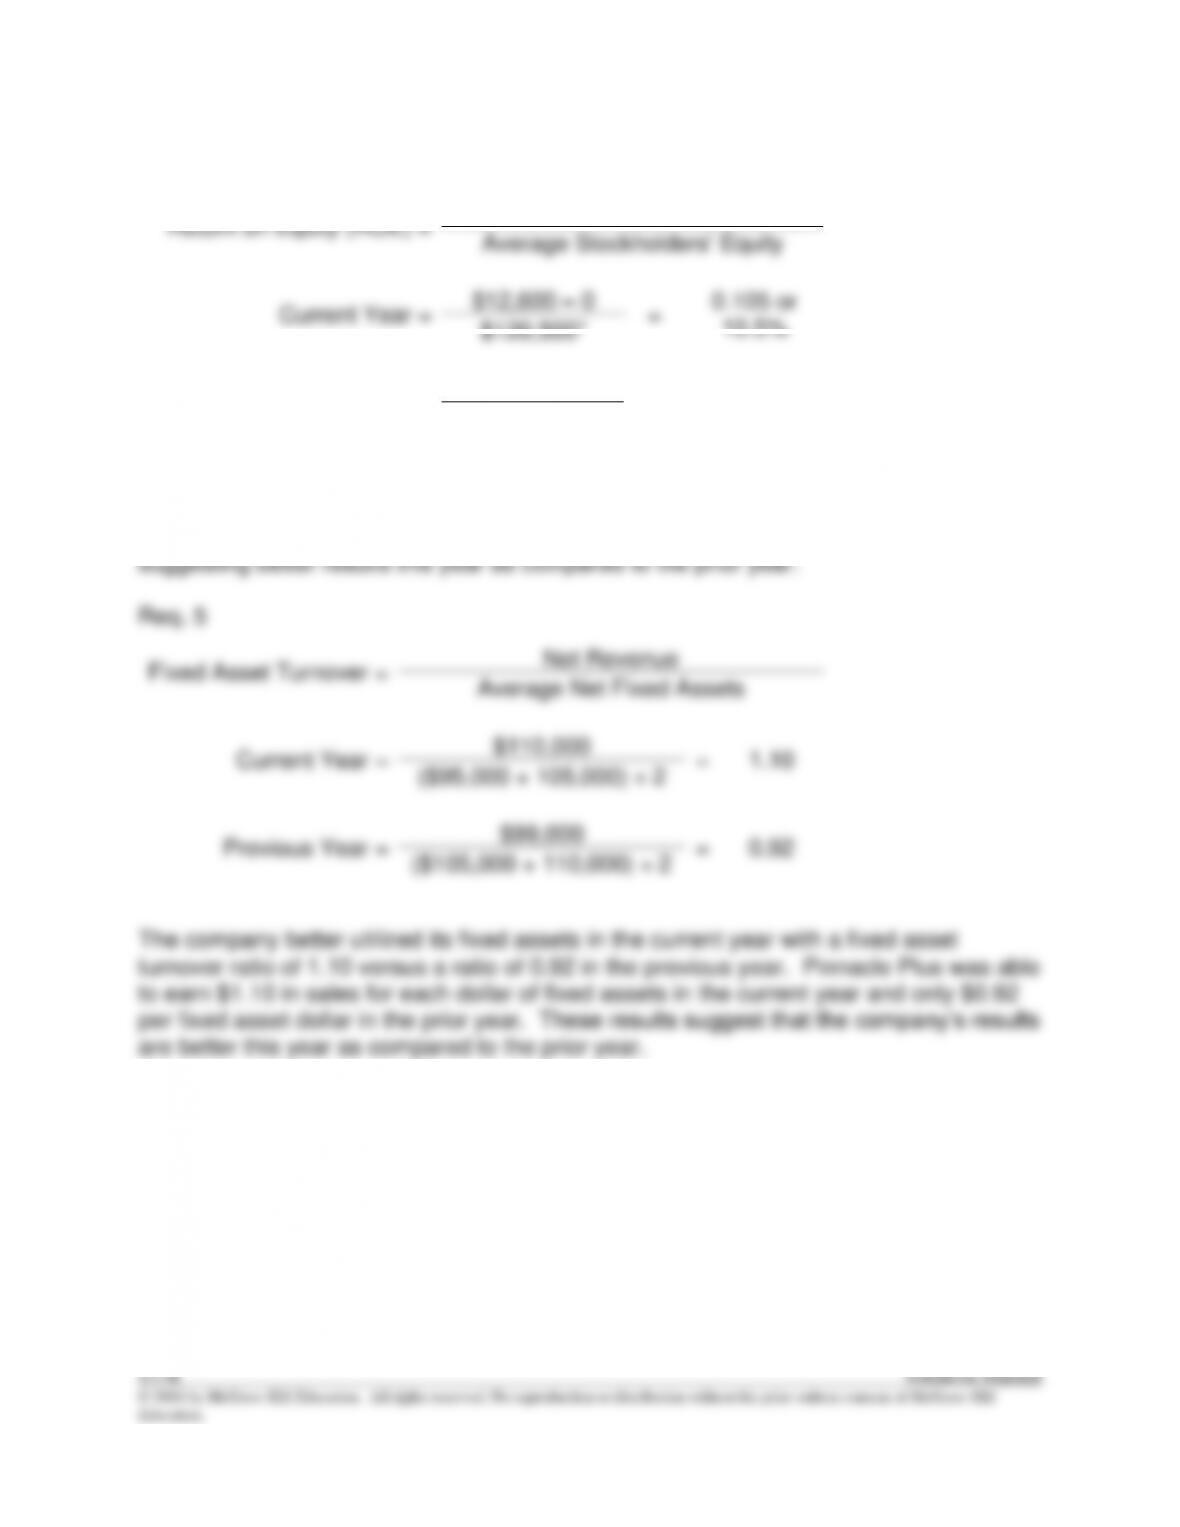
Return on Equity (ROE) =
Net Income – Preferred Dividends
Average Stockholders’ Equity
Current Year =
$12,600 – 0
=
0.105 or
10.5%
$120,500*
Previous Year =
$9,800 – 0
=
0.090 or
9.0%
$108,750**
* $120,500 = ($123,500 + $117,500) ÷ 2
**$108,750 = ($117,500 + $100,000) ÷ 2
The return on equity improved by 1.5% from the previous year to the current year
© 2016 by McGraw-Hill Education. All rights reserved. No reproduction or distribution without the prior written consent of McGraw-Hill
Education.
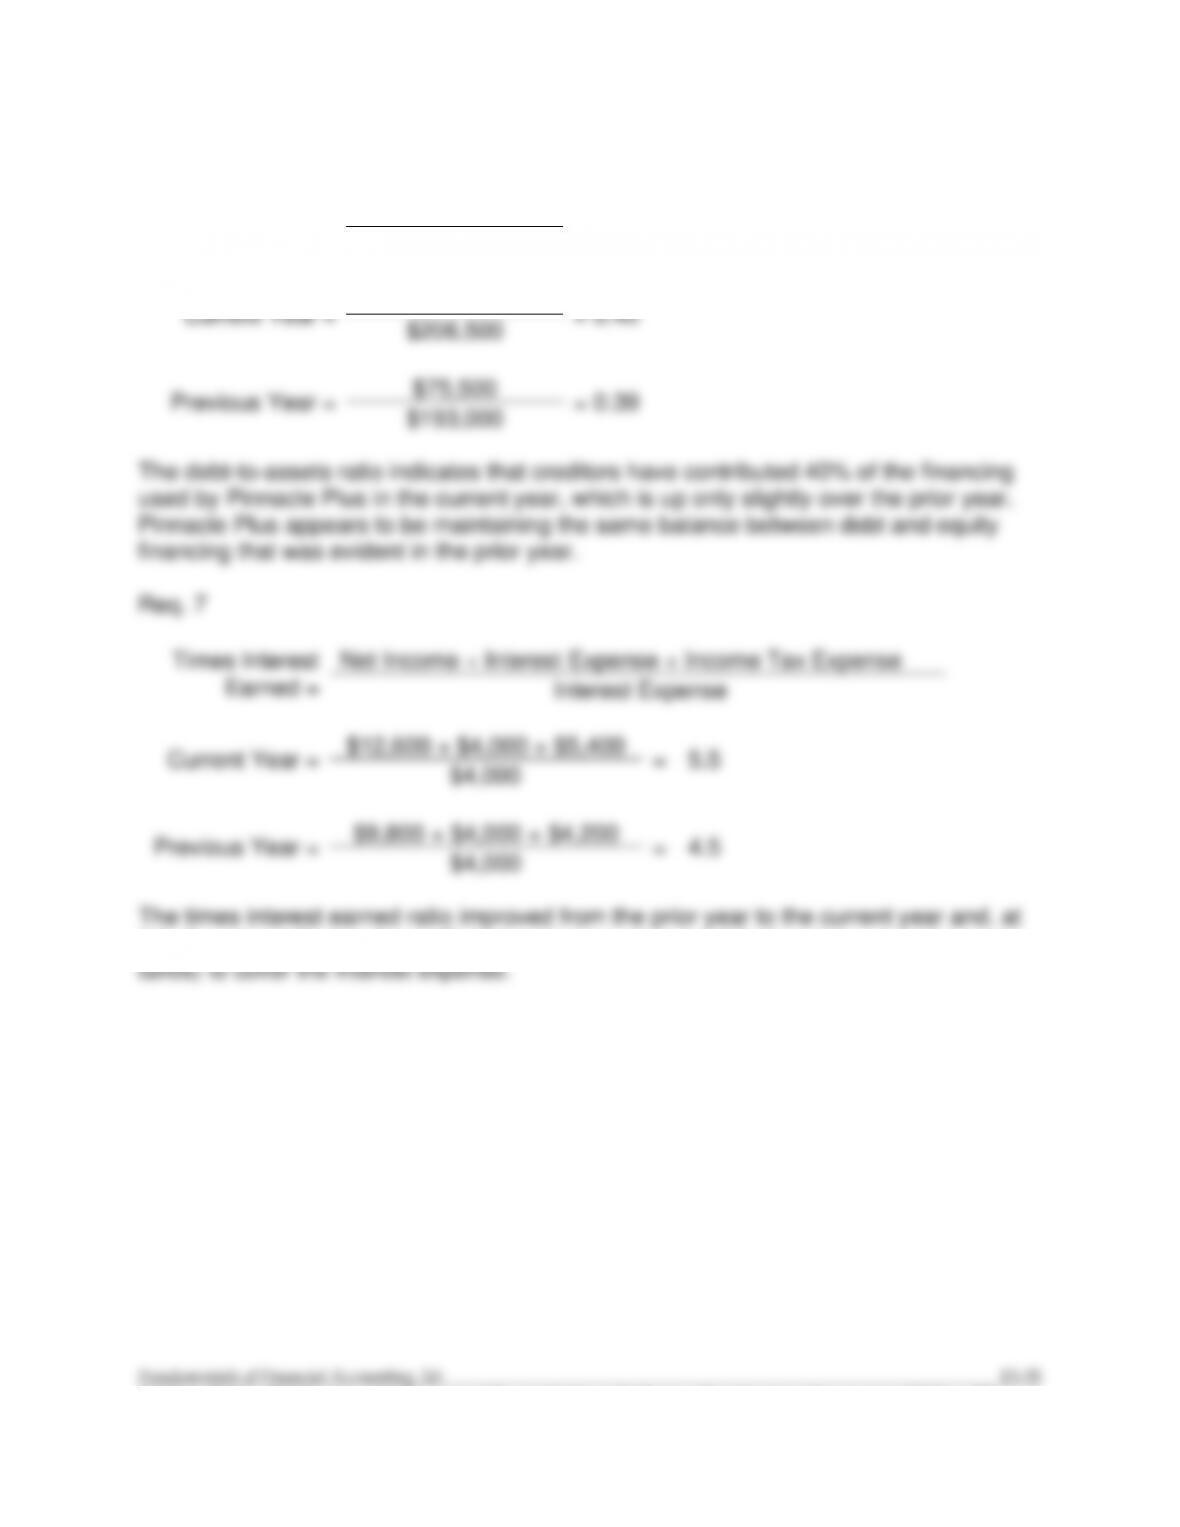
PA13–2 (continued)
Req. 6
Debt-to–Assets =
Total Liabilities
Total Assets
Current Year =
$83,000
= 0.40
$206,500
Previous Year =
$75,500
= 0.39
$193,000
The debt-to-assets ratio indicates that creditors have contributed 40% of the financing
used by Pinnacle Plus in the current year, which is up only slightly over the prior year.
Pinnacle Plus appears to be maintaining the same balance between debt and equity
financing that was evident in the prior year.
Req. 7
Times Interest
Earned =
Net Income + Interest Expense + Income Tax Expense
Interest Expense
Current Year =
$12,600 + $4,000 + $5,400
=
5.5
$4,000
Previous Year =
$9,800 + $4,000 + $4,200
=
4.5
$4,000
The times interest earned ratio improved from the prior year to the current year and, at
5.5, the ratio indicates that sufficient net income is earned (before interest and income
PA13–2 (continued)
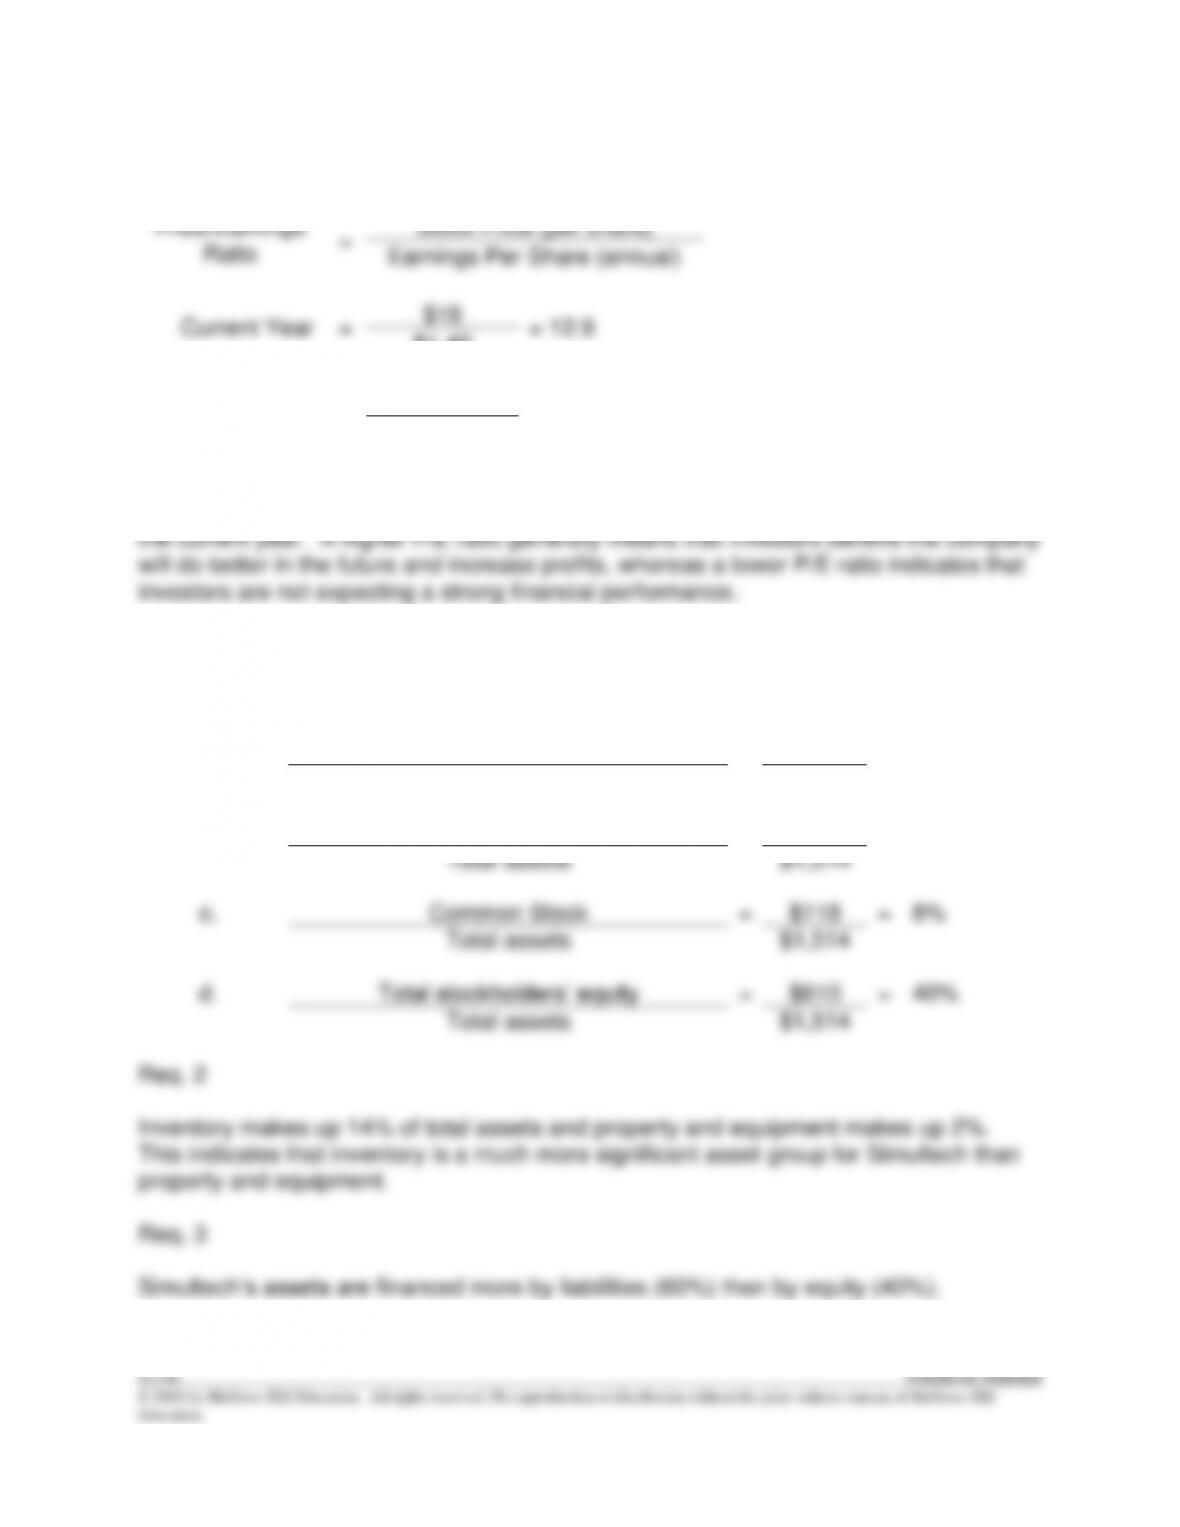
Req. 8
Price/Earnings
Ratio
=
Stock Price (per share)
Earnings Per Share (annual)
Current Year
=
$18
= 12.9
$1.40
Previous Year
=
$15
= 13.8
$1.09
It appears that investors have become less optimistic about the future success of
Pinnacle Plus because the P/E ratio has decreased from 13.8 in the prior year to 12.9 in
PA13–3
Req. 1
a.
Other current assets
=
$109
=
7%
Total assets
$1,514
b.
Total liabilities
=
$904
=
60%
Total assets
$1,514
c.
Common Stock
=
$118
=
8%
Total assets
$1,514
d.
Total stockholders’ equity
=
$610
=
40%
Total assets
$1,514
© 2016 by McGraw-Hill Education. All rights reserved. No reproduction or distribution without the prior written consent of McGraw-Hill
Education.
PA13–4
Req. 1
a.
Selling, general, and administrative expenses
=
$333
=
16%
Sales revenues
$2,062
b.
Interest expense
=
$22
=
1%
Sales revenues
$2,062
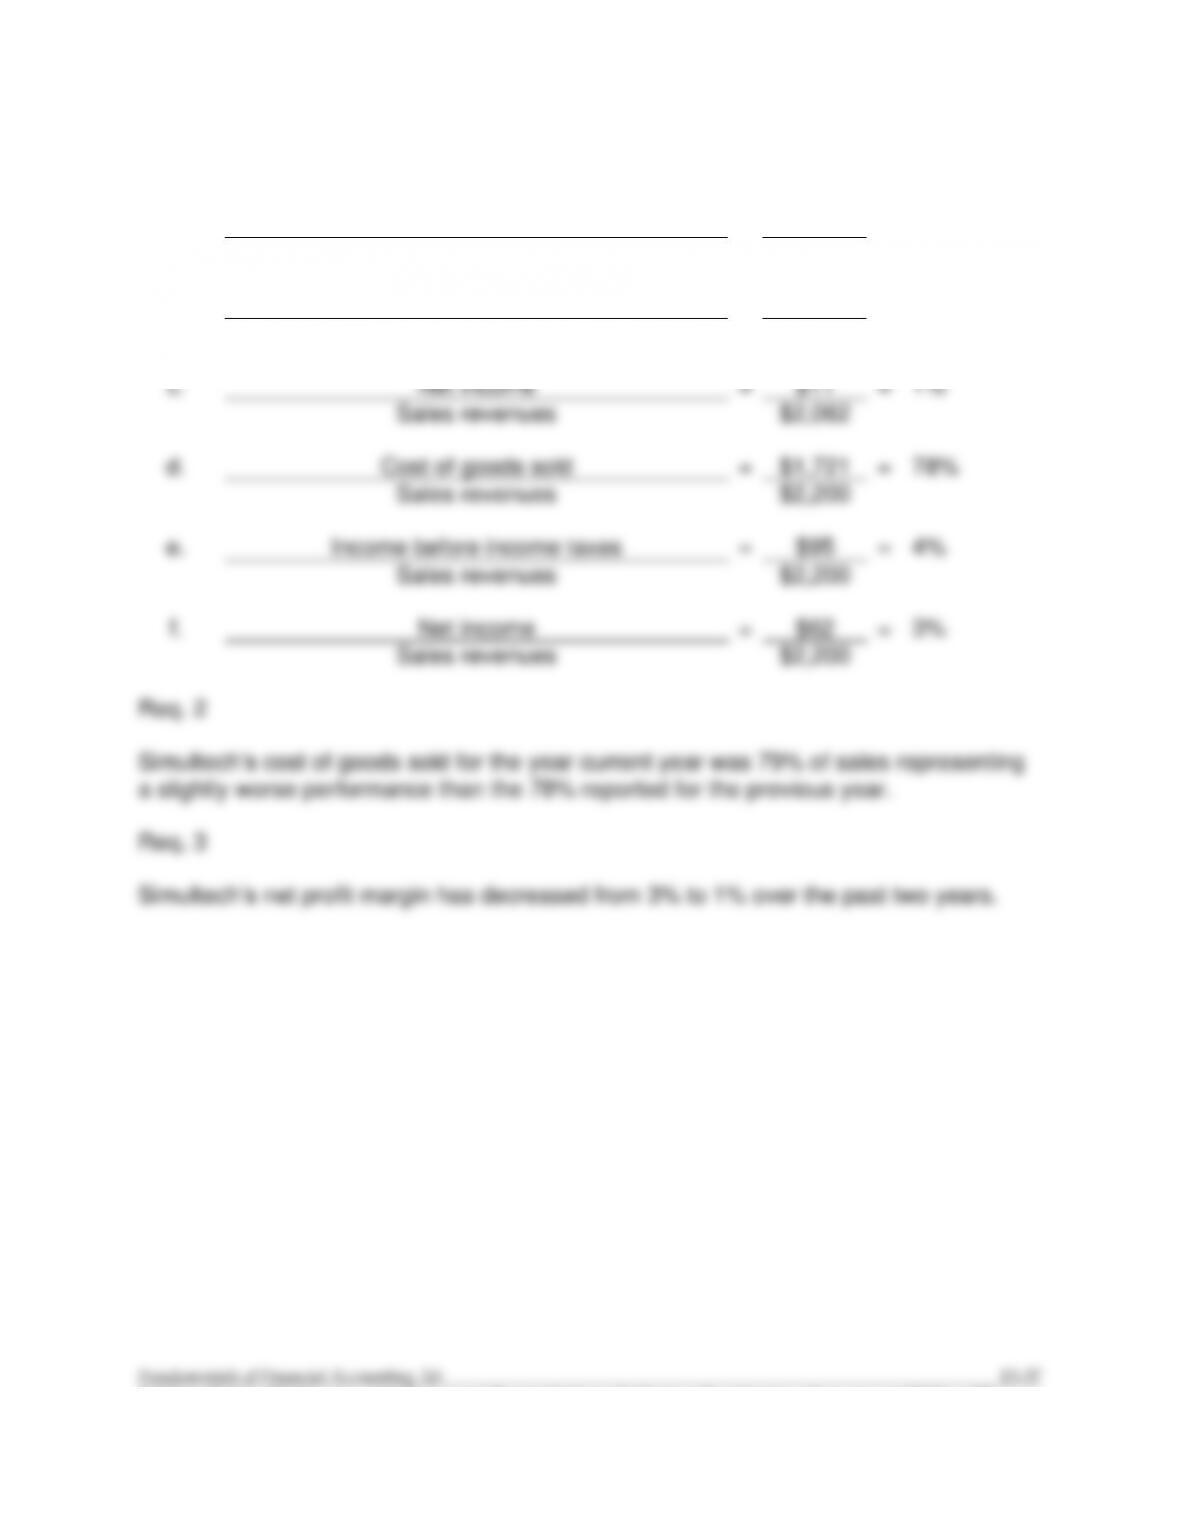
c.
Net income
=
$11
=
1%
Sales revenues
$2,062
d.
Cost of goods sold
=
$1,721
=
78%
Sales revenues
$2,200
e.
Income before income taxes
=
$95
=
4%
Sales revenues
$2,200
f.
Net income
=
$62
=
3%
Sales revenues
$2,200
PA13–5
Req. 1
In terms of generating profits, Coca-Cola appears to be the more profitable company
with a higher gross profit percentage and net profit margin. Earnings per share (EPS) is
excluded from between-company comparisons because it could be affected by
differences in stock structure that do not reflect differences in profitability.
Req. 2
© 2016 by McGraw-Hill Education. All rights reserved. No reproduction or distribution without the prior written consent of McGraw-Hill
Education.
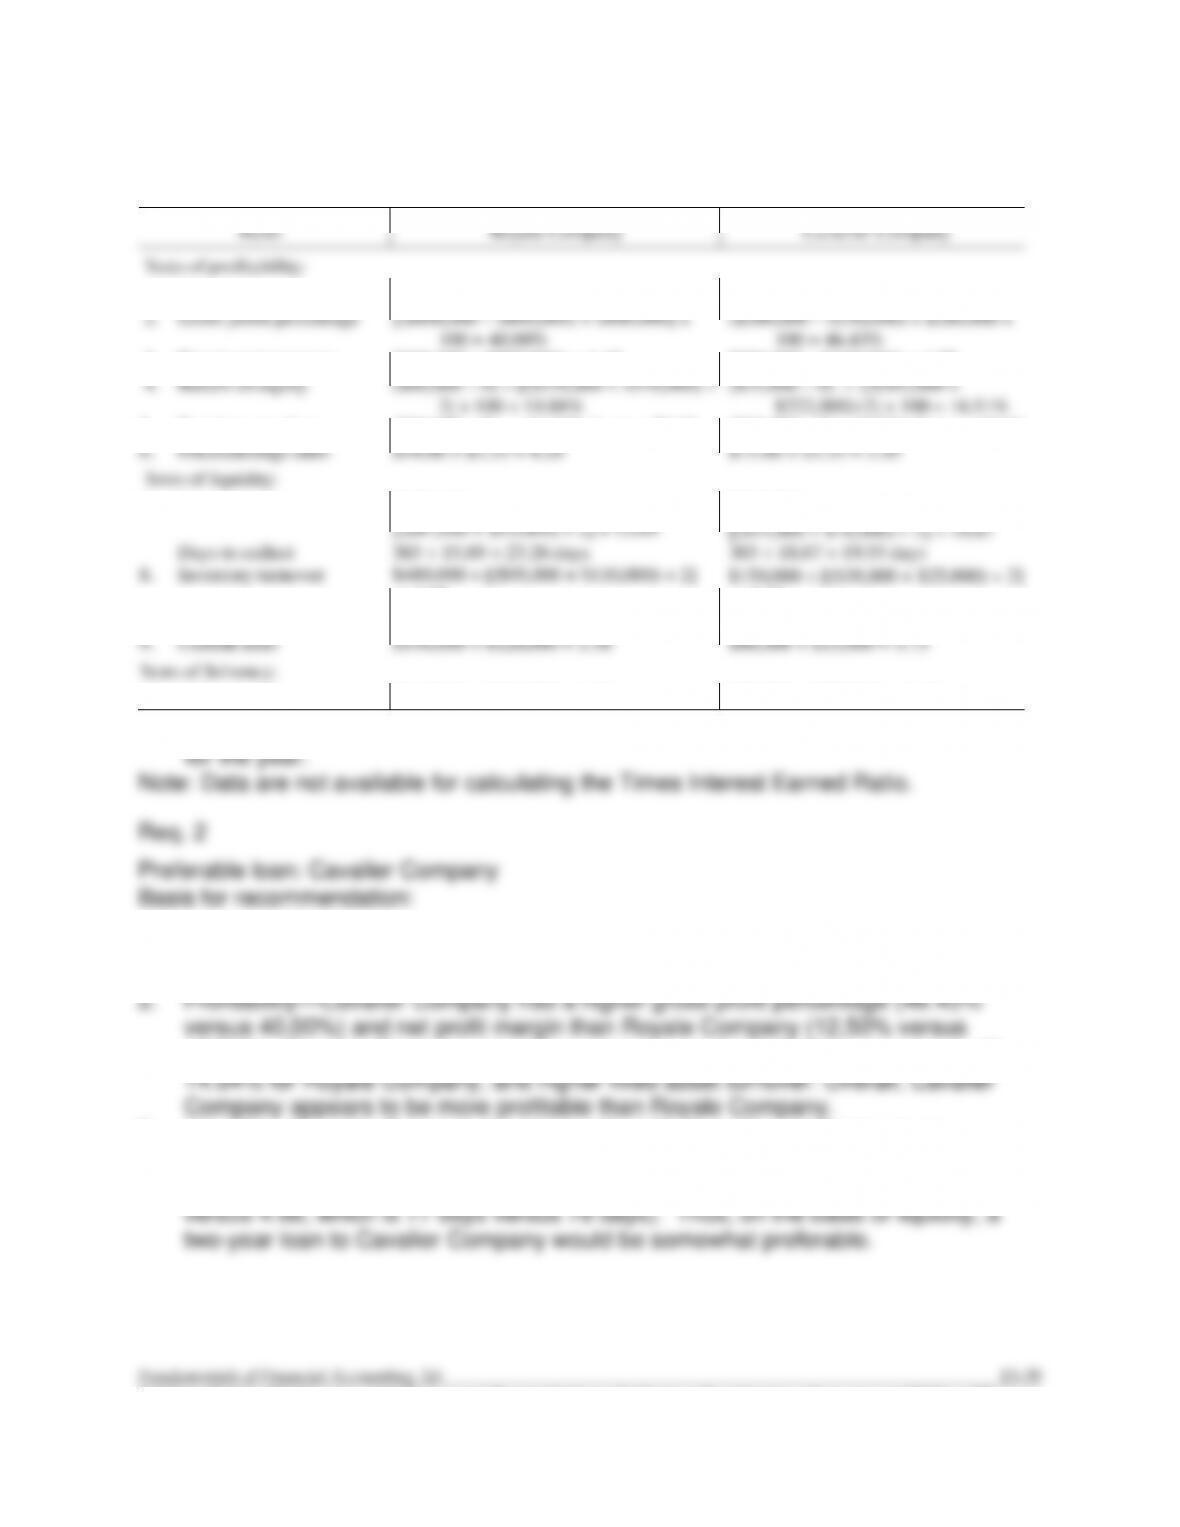
PA13–6
Req. 1
Ratio
Royale Company
Cavalier Company
Tests of profitability:
1.
Net profit margin
($80,000 ÷ $800,000) x 100 = 10.00%
($35,000 ÷ $280,000) x 100 = 12.50%
2.
Gross profit percentage
[($800,000 – $480,000) ÷ $800,000] x
100 = 40.00%
($280,000 – $150,000) ÷ $280,000 x
100 = 46.43%
3.
Fixed asset turnover
$800,000 ÷ $550,000* = 1.45
$280,000 ÷ $160,000* = 1.75
4.
Return on equity
($80,000 – 0) ÷ [($570,000 + $570,000) ÷
2] x 100 = 14.04%
($35,000 – 0) ÷ [($202,000 +
$222,000)÷2] x 100 = 16.51%
5.
Earnings per share
($80,000 – 0) ÷ 24,000 shares = $3.33
($35,000 – 0) ÷ 10,500 shares = $3.33
6.
Price/earnings ratio
$14.00 ÷ $3.33 = 4.20
$11.00 ÷ $3.33 = 3.30
Tests of liquidity:
7.
Receivables turnover
$800,000 ÷
[($47,000 + $55,000) ÷ 2] = 15.69
$280,000 ÷
[($14,000 + $16,000) 2] = 18.67
Days to collect
365 ÷ 15.69 = 23.26 days
365 ÷ 18.67 = 19.55 days
8.
Inventory turnover
$480,000 ÷ [($95,000 + $110,000) ÷ 2]
= 4.68
$150,000 ÷ [($38,000 + $25,000) 2]
= 4.76
Days to sell
365 ÷ 4.68 = 77.99 days
365 ÷ 4.76 = 76.68 days
9.
Current ratio
$190,000 ÷ $120,000 = 1.58
$86,000 ÷ $15,000 = 5.73
Tests of Solvency:
10.
Debt-to-assets
$310,000 ÷ $880,000 = 0.35
$70,000 ÷ $292,000 = 0.24
* The problem indicates that the end–of-year ending balance approximates the average
1. Each set of financial statements is audited and each received an unqualified
opinion; therefore, there is no preference in terms of credibility of information.
10.00%). Cavalier Company earned a return on equity of 16.51% compared with
3. Liquidity—Cavalier Company has higher liquidity than Royale Company as
evidenced by the current ratio (5.73 compared with 1.58), receivables turnover
(18.67 versus 15.69, which is 20 days versus 23 days) and inventory turnover (4.76
13-40 Solutions Manual
© 2016 by McGraw-Hill Education. All rights reserved. No reproduction or distribution without the prior written consent of McGraw-Hill
Education.
PA13–6 (continued)
4. Solvency—Cavalier Company clearly is in a less risky position on this factor.
Cavalier Company financed its operations by obtaining only 24% of its total assets
5. The price/earnings ratio provides little evidence in favor of either company.
6. Constraint—The above analysis is based on only one year. Although this year is
relevant (it is the most recent), it limits the ability to conduct trend analyses.
7. Accounting decisions—Cavalier’s higher bad debt estimates reduced its profitability
ratios (net profit margin, return on equity, earnings per share) relative to Royale.
Despite this, the company still appeared more profitable. The higher bad debt
PA13–7
1. Company A’s low current ratio, combined with its high inventory turnover ratio,
2. The price/earnings ratio for Company A suggests a profitable company with
good growth prospects.
3. The low debt-to-assets ratio and high times interest earned ratio suggests